
Abstract
Assessing the impact of climate change on vulnerable populations and the implications of such impacts is a critical step toward climate and environmental justice. In general, indices or metrics that aim at studying linkages between climatic environmental impacts and vulnerable populations lack housing information. Financially relevant real estate data (e.g., mortgages, evictions) alongside other socioeconomic and physical risk information can, however, provide a crucial lens to assess climate justice. In addition, standard socioeconomic and demographic variables aggregated at census units lack the granularity required to capture inequalities, especially in heterogeneous communities, so there is a need for publicly available, ready-to-use, digitized, and distributed datasets containing relevant inequality metrics using real estate and financial information. Also, studies focusing on damages and financial impacts of climate change often use commercial datasets, which must be acquired for hundreds of thousands of dollars, making the inclusion of such information prohibitive for advocacy groups, journalists, and other interested people. With this in mind, we integrated multiple publicly available datasets that include socioeconomic, climate risk scores, evictions, and housing variables at the census tract level over the United States to be used to investigate environmental justice themes. Our goal is that the dataset proposed here will allow for testing, assessing, and generating new analysis and metrics that can address inequalities and climate injustice. To demonstrate the potential of the new dataset, we report examples of application to the Miami area, where the recent increased risk of floods and extreme events has exposed socially vulnerable populations to the consequences of climate change.
Introduction
Assessing the consequences of climate change on socially vulnerable people is a critical step toward climate and environmental justice. Impacts of climate change can manifest through physical damages of infrastructures and homes, the loss of human lives, as well as rebuilding livelihoods that are damaged or destroyed. Other mechanisms that are exerted on socially vulnerable populations are not always directly observable nor can the specific impact be overtly linked to climate hazards, such as the way in which rising insurance costs associated with living in hazard prone areas disproportionately increases the financial burden on low-income populations. In Florida, for example, where the threat of climate change is manifested through increased exposure to floods and extreme events, flood insurance rates can range from around $200 to more than $2,000 a year, according to data from the Federal Reserve Survey of Consumer Finances. 1 This is in addition to already high and rising insurance rates as a result of more destructive hurricanes. 2 , 3 Another mechanism through which climate impacts can manifest is through losses in the real estate market. Recent work has shown that properties to be inundated with tidal flooding by 2032 can lose $3.08 each year for each square foot of living area, with properties near roads that will be inundated with tidal flooding in 2032 losing $3.71 each year on each square foot of living area. 4
In general, indices or tools that aim at identifying such damages are composed of census-derived socioeconomic/demographic datasets without including direct financial or real estate data (e.g., mortgages, evictions). This is driven by the abundance of standardized socioeconomic and demographic datasets, on the one hand, and to the absence of publicly available, ready-to-use datasets concerning real estate and financial information, on the other. A problem with relying on census data is that, apart from the decennial censuses, the inter-census data come from a sample of households that can have significant sampling errors, resulting in inconsistencies in results. 5 Studies focusing on damages and financial consequences of climate change often make use of commercial datasets that are acquired for hundreds of thousands of dollars. Moreover, the commercial sector often has proprietary and limited use contracts related to the purchase and applications of such datasets that inhibit the proper assessment of their quality as well as prohibit a critical analysis or validation of the data. All of these factors limit critical scientific consideration of the data, which greatly increases the risk for such companies themselves to hold a monopoly on analysis and become the standard on which government policies and recommendations are built. The use of multiple datasets and the proper assessment of the quality of each are crucial for a fair and just scientific analysis.
We stress that open access to data and the documentation of the scientific process in a replicable way should be the primary pillar of a digital, fair society. 6 Limits on the reproducibility of results infringe on the scientific applicability of these products and threaten the advancement of environmental justice, which seeks to ensure that we consider a fair distribution of benefits and burdens arising from environmental and climate factors. To this end, we created a dataset based on publicly available data intended to be used for environmental justice themes that integrate socioeconomic, physical risk, evictions, and housing datasets (including race, ethnicity, and gender information) for addressing climate change impacts. For practical purposes, we abbreviate the integrated data as the Socio-Economic Physical Housing Eviction Risk (SEPHER) dataset. Our hope and goal are that SEPHER will allow for testing, assessing, and generating new analysis and metrics (such as, for example, fine-tuned vulnerability indices) that account for the financial burden of vulnerability associated with the housing market (e.g., mortgages and evictions). SEPHER covers the entire United States. However, in this study, we report examples of application to the Miami area, due to the high concentration of socially vulnerable populations in this region and in view of the high levels of exposure to sea level rise and extreme flooding through cyclone, storm surge, and high tide events.
Background
In 2007, the International Panel on Climate Change defined vulnerability as “the degree to which a system is susceptible to, and unable to cope with adverse effects of climate change, including climate variability and extremes.” 7 More recent definitions of vulnerability make reference to the extent of harm that can be expected under certain conditions of exposure, susceptibility, and levels of resilience. A currently widely accepted, general conceptualization of vulnerability can be formulated as:
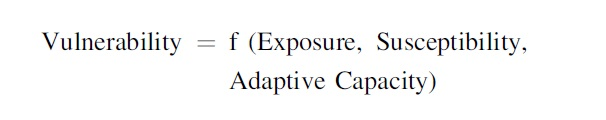
Exposure can be defined as the nature and degree to which a system experiences environmental or sociopolitical stress. 8 Susceptibility involves sensitivity to risk when exposed to a hazard and relates to system characteristics, including the social context of damage formation. 9 Adaptive capacity can be seen as the capacity of a system to suffer any perturbation by maintaining significant levels of efficiency in its social, economic, environmental, and physical components. Socially and economically vulnerable populations are expected to suffer more harm and have less capacity to adapt given the same exposure. It is also argued that “people's vulnerability is being used against them, or put another way, is being weaponized—exacerbating their precarity by excluding them from much needed and due assistance, while directing resources instead to bolstering the well-being of those already well-positioned to respond to climate threats.” 10 This is consistent with the recent finding that “mitigation and adaptation policies, done poorly, exacerbate power asymmetries and dispossess vulnerable communities in ways that amplify various kinds of insecurities.” 11
Several methods have been proposed in the literature that create indices for vulnerability given indicator variables meant to serve as proxies to track progress. The Environmental Vulnerability Index has been used to measure national-level environmental problems since the 1990s, 12 whereas other studies develop corresponding indexes that are relevant to environmental, economic, and social aspects at subnational scales. 13 Widely used vulnerability indices have also been created at the U.S. county and census tract levels, such as the Social Vulnerability Index (SVI) using a straightforward additive approach. 14 The SVI is also provided as a recipe 15 to create an index through a principal component analysis (PCA) by using the data for whatever case study. In this regard, numerous studies have applied this approach beyond the United States with the variables available in those areas. 16 , 17 , 18 , 19 Aggregate census data are used to characterize areas of vulnerability, but increasingly other data sources related to housing and real estate are becoming more openly available to capture metrics from anonymized individuals, in contrast to the use of proprietary, commercial datasets. Some of the literature accounts for vulnerability associated with the housing market and real estate. However, the work reported in the literature on this topic focuses mostly on understanding the impact of extreme events on real estate prices, 20 improving estimates of the economic losses due to sea level rise by accounting for lost coastal amenities, 21 comparing prices for houses based on their inundation threshold under projections of sea level rise, 22 and assessing the influence of different exposure levels on real estate market discounts. 23 However, there is still a need to integrate socioeconomic, risk, and financial information from real estate databases on housing changes as a metric to assess climate injustices to vulnerable populations. This is the goal of SEPHER.
Materials and Methods
As mentioned, SEPHER is obtained from the integration of multiple datasets, summarized in Table 1 and described later. The final SEPHER dataset is generated at the census tract level for the entire United States by joining the different variables through the open source QGIS software. We do not currently replace missing data with other values, as we want to present the data “as is” for use by others. However, approaches to fill incomplete data based on statistical norms such as probabilistic principal component analysis are encouraged for future work. 24
List of Datasets Integrated Into the Socioeconomic Physical Housing Eviction Risk Dataset
The table describes the full name of the original dataset in the first column, the links to the documentation or dictionary in the second column, the temporal coverage in the third column, and the link to access the original data in the last column.
CDC, Centers for Disease Control and Prevention; FEMA, Federal Emergency Management Agency.
Centers for Disease Control and Prevention SVI data
The Centers for Disease Control and Prevention (CDC) provides an SVI containing data on the four following categories: (1) socioeconomic status, (2) household composition and disability, (3) minority status and language, and (4) housing and transportation. The dataset ranks a total of 15 social factors, including poverty, lack of vehicle access, and crowded housing, and it groups them into four related themes. 25 Data are available for the years 2000, 2010, 2014, 2016, and 2018.
American Community Service data
The American Community Service (ACS) is a nationwide survey designed to provide communities with reliable and timely social, economic, housing, and demographic data every year. 26 The ACS estimates are aggregated over a period of years. The dataset is the source data of the CDC SVI dataset. It contains raw variables on population, housing unit, and household characteristics for states, counties, cities, school districts, congressional districts, census tracts, block groups, and many other geographic areas.
Home Mortgage Disclosure Act data
Data about mortgages reported every year by thousands of financial institutions are disclosed by the Consumer Financial Protection Bureau of the United States Government to the public under the Home Mortgage Disclosure Act. Data are currently available for the period 2007–2017 and contain information concerning, for example, whether the application was approved or denied, pre-approvals and loans sold from one institution to another, the property characteristics, the applicant demographics, ethnicity, race, and gender. The data are stripped of sensitive information and are modified to protect applicant and borrower privacy. 27
Eviction data
Eviction data are provided by The Eviction Lab at Princeton University. The lab has collected, cleaned, geocoded, aggregated, and publicized all recorded court-ordered evictions that occurred between 2000 and 2016 in the United States, consisting of more than 80 million records. 28
Federal Emergency Management Agency (FEMA) National Risk Index
FEMA's Natural Hazards Risk Assessment Program combines the likelihood and consequence of natural hazards with social factors and resilience capabilities. The goal is to take a holistic view and create a nationwide baseline of natural hazard risk. Through various partnerships and working groups, the FEMA developed a methodology and procedure to create the National Risk Index (NRI) dataset. The dataset and the accompanying application help to identify communities that are most at risk to hazards.
Results and Discussion
SEPHER provides data from the United States and includes climate threats from different sources (e.g., fires, droughts, etc.). Here, however, we focus on a specific region in relation to flooding to show examples of the potential of the dataset. We report the results of a quantitative analysis over the Miami area, where sea level rise and extreme weather are having and will continue to have a significant impact on the economy and socially vulnerable people. Our study area (Fig. 1) includes Miami Beach, the Biscayne Bay area and inland areas. This region was selected due to its exposure to recent extreme events. In fact, several studies have focused on these areas and stressed the variation in terms of population, ethnicity, income, and other socioeconomic factors that characterize it. 29
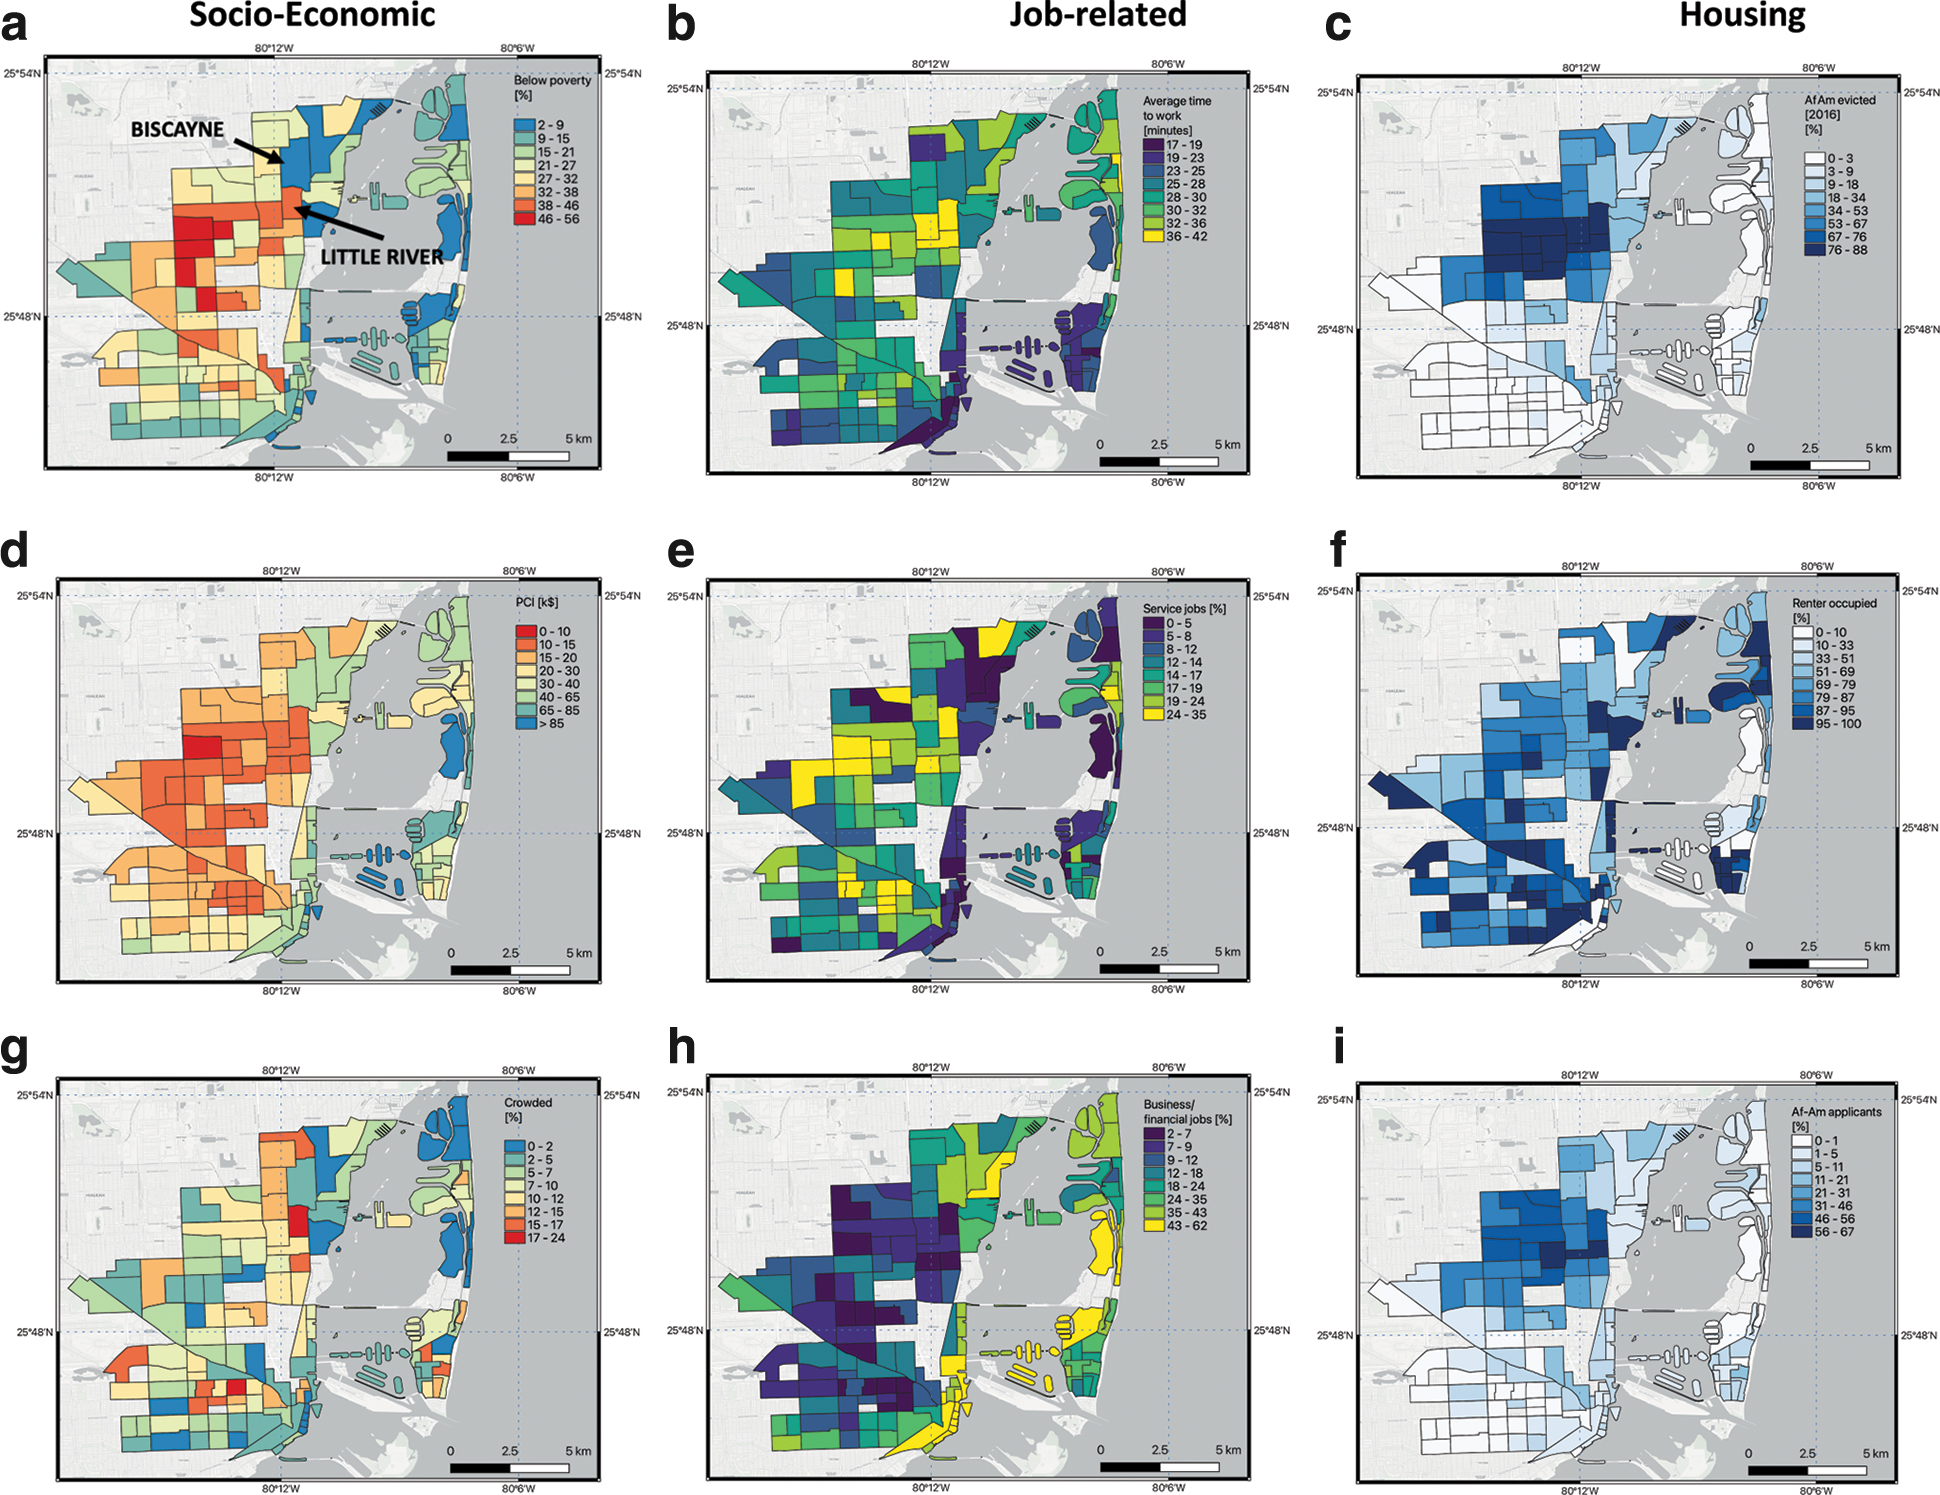
Maps of selected socioeconomic, job-related, and housing-based variables for the Miami region used in this study.
Figure 1 provides examples of variables contained within SEPHER. Specifically, in the case of socioeconomic data, we show the percentage of (a) people living below the poverty level, (d) annual Per Capita Income (PCI, in thousands of U.S. dollars), and (g) crowded homes (here defined as households with more people than rooms) as derived from the SVI CDC 2016 dataset. In the case of jobs, we show the (b) average time to work, (e) percentage of people with Service jobs, and (h) the percentage of people with Management/business/financial jobs. Lastly, in the far right panel, we show the (c) percentage of evictions for African Americans, (f) the percentage of renter-occupied homes, and (i) the percentage of African American applicants for mortgages, also for 2016. The maps point to the complementary nature of the three datasets. The analysis of the maps in Figure 1 highlights the gradient of the socioeconomic status of the population living along Miami Beach, characterized by a low percentage of people living below the poverty level, a high PCI, and a relatively low percentage of crowded homes against that of areas inland, characterized by reversed conditions. Consistently, the distribution of Management and Service jobs shows that most of the Management/Financial jobs are located along the coast, with Service jobs located into the interior, where more socially vulnerable people live. The map of the average time to work indicates a less geographically concentrated distribution of values than the Service and Management jobs indicate. Nevertheless, this map indicates that some of the areas inland (where the percentage of population living below the poverty level is high) are characterized by the highest commuting times. The maps of the Housing variables indicate that the areas with low PCI and high percentage of people below the poverty level show a high number of evicted African Americans, a relatively high number of renter-occupied properties, and a relatively high number of African Americans applying for loans.
As a further example, we focus on the two census tracts containing the neighborhoods of Little River/Little Haiti (Tract No. 12086001402) and Biscayne (Tract No. 12086001104), highlighted in Figure 1a. In Figure 2, we show the histograms of socioeconomic and loan variables for Biscayne (panels a, c, and e) and Little River (panels b, d, and f). More specifically, in Figure 2a and b we show the percentage of people living below poverty level, unemployed, and minority for the years 2000, 2010, 2014, 2016, and 2018 in the case of the Biscayne (Fig. 2a) and Little River (Fig. 2b). In Figure 2c and d, we report the number of originated loans for Whites, African Americans, Native Americans, Asians, and Native Hawaiians or Other Pacific Islanders for the period 2007–2017 for Biscayne (Fig. 2c) and Little River (Fig. 2d). Lastly, Figure 2e and f show the same as (c) and (d) but for the percentage of denied loans. The time series of the socioeconomic data for the two neighborhoods point to a mild increase of minority for Biscayne between 2000 and 2018 and a reduction of people below the poverty level. The percentage of unemployed people for the same neighborhood, after increasing between 2000 and 2014, started to decrease in 2014, reaching a minimum level of 5%. In the case of Little River, the percentage of people below the poverty level decreased consistently starting in 2010, when the maximum of 64% was reached, dropping to 43%. Still for Little River, the percentage of people belonging to minorities remained high, at levels above 85%, reaching a maximum of 98% in 2018. The analysis of the number of loans originated for the different races show that the number of originated loans in the Biscayne neighborhood is generally higher than the one for Little River. Moreover, despite the drop in the total number of loans evident after 2007 and 2008, because of the housing market crisis, the number of loans remained relatively stable in Biscayne, recovering between 2013 and 2014 and remaining relatively stable after then, with a majority of loans to White people. In the case of Little River, on the contrary, the number of loans remained very low, dropping from around 45 loans in 2007, of which half were to Whites and half to African Americans, to less than 5 starting in 2009, highlighting the unequal impact of the house crisis on socially vulnerable people of this neighborhood. Comparing the denied loans for the two neighborhoods, we notice that for the Biscayne neighborhood the number of denied loans to White people remained relatively stable, with a mean of 78% and standard deviation of 8%, and so does the number of denied loans for African Americans (mean of 17% and standard deviation of 9%). On the other hand, in the case of Little River, the percentage of denied loans for African Americans is much higher (44%) with a higher variability (standard deviation of 23%) than those for White populations (mean of 49% and standard deviation of 25%).
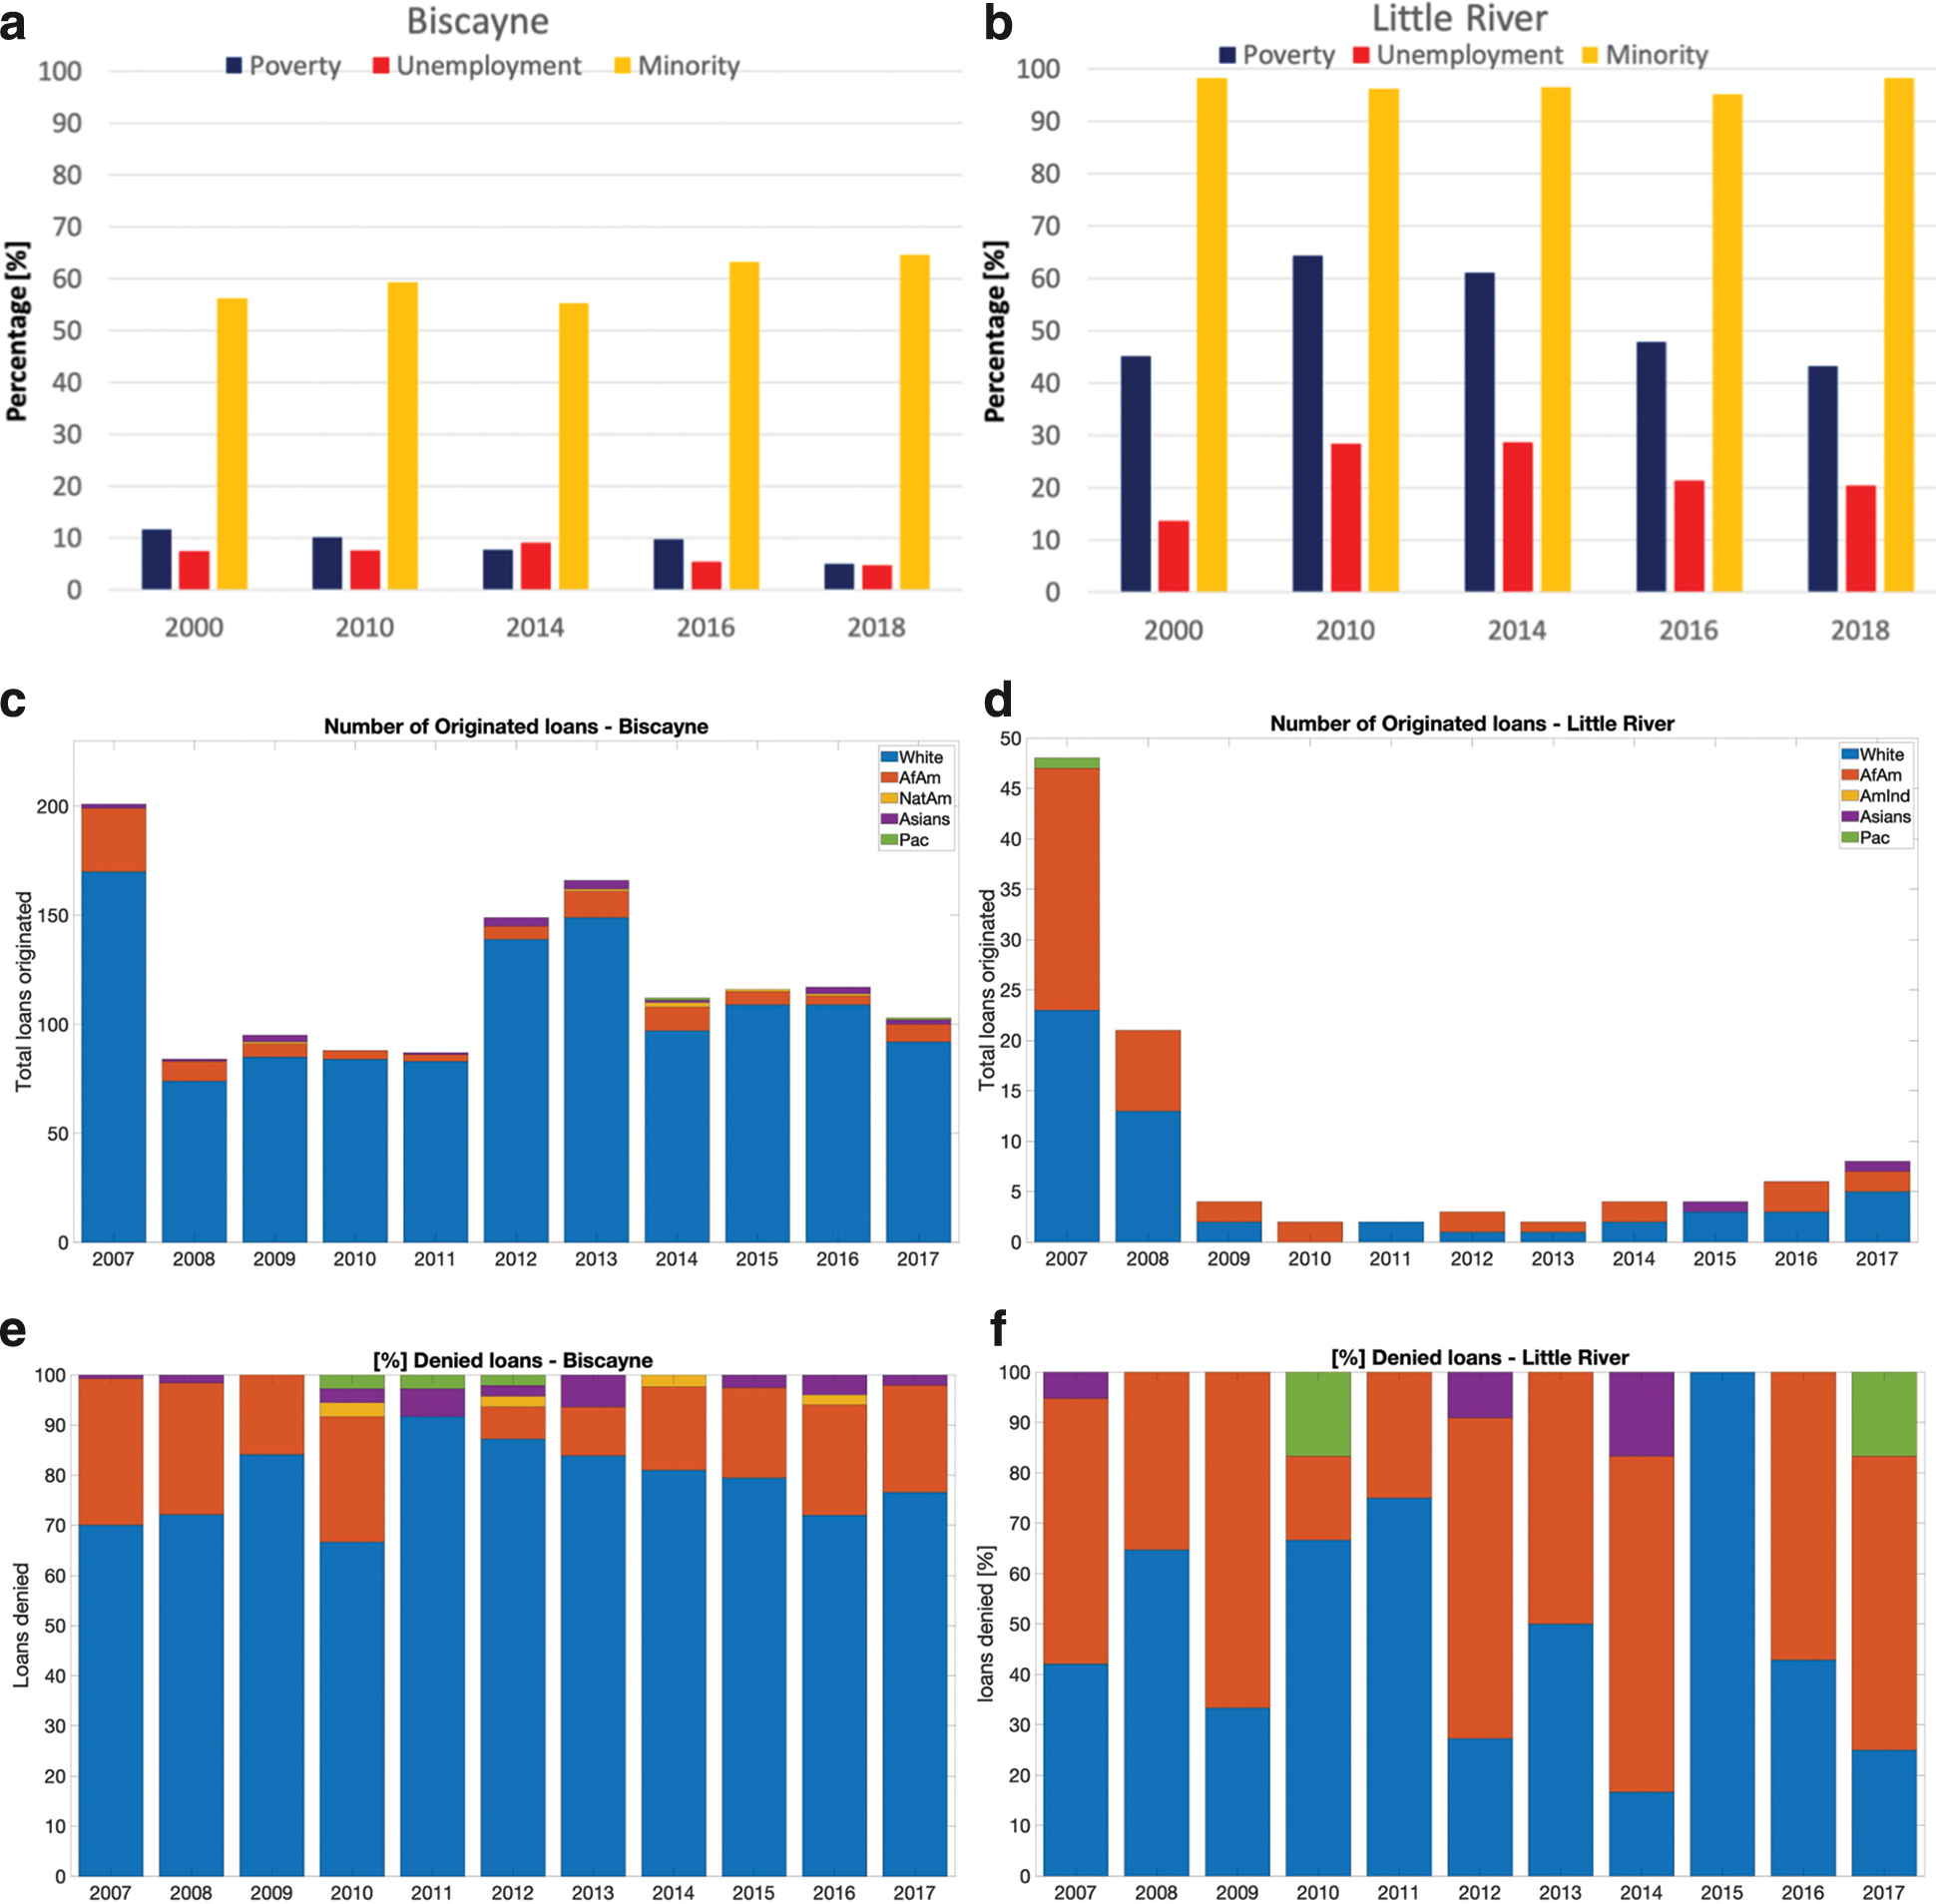
Bar charts of socioeconomic and loan variables for Biscayne
SEPHER contains more than 700 variables in its current version for all categories. To highlight some of the exploratory analysis that can be performed with this dataset, we selected a subset of those variables (43 in total) from the socioeconomic, job-related, housing, evictions, and physical risk subcategories (Fig. 3). The evictions, socioeconomic, and house mortgage data refer, as an example, to the year 2016. We, then, performed a PCA-based analysis to further reduce the dimensionality of the dataset. From the results of such analysis (Supplementary Data, Figure S1, Tables S1 and S2), we selected 12 variables, based on both the loadings for the different principal components and to balance the number of the final variables from the different datasets. We point out that the results here reported are not primarily aiming at developing a comprehensive framework to identify specific variables that can be readily used for creating indices, but to show the potential of the SEPHER dataset in identifying relationships between housing, ethnicity, and race variables with socioeconomic ones as well as physical risks. In Figure 4, we show the correlation matrix for the 12 variables obtained from the PCA analysis. We find a strong inverse correlation between the Hispanic evicted population and the evicted African Americans (−0.75) and the number of loans to African Americans (0.75). We also find a strong positive correlation between the evicted Hispanics and the percentage of people with Limited English (0.81). In the case of evicted African Americans, we found a mild and positive correlation with people with Limited English (−0.36) but higher correlations with the percentage of unemployed people (0.77) and African American loans (0.75). We also found an inverse correlation between the FEMA Risk Score and PCI (−0.50) and positive correlations between the Risk Score and the percentage of people paying more than 30% of income on rent (0.42) and people with Limited English (0.49). Lastly, we found that coastal flooding risk is mildly inversely correlated with Unemployment (−0.39) and with the number of evicted African Americans (−0.35).
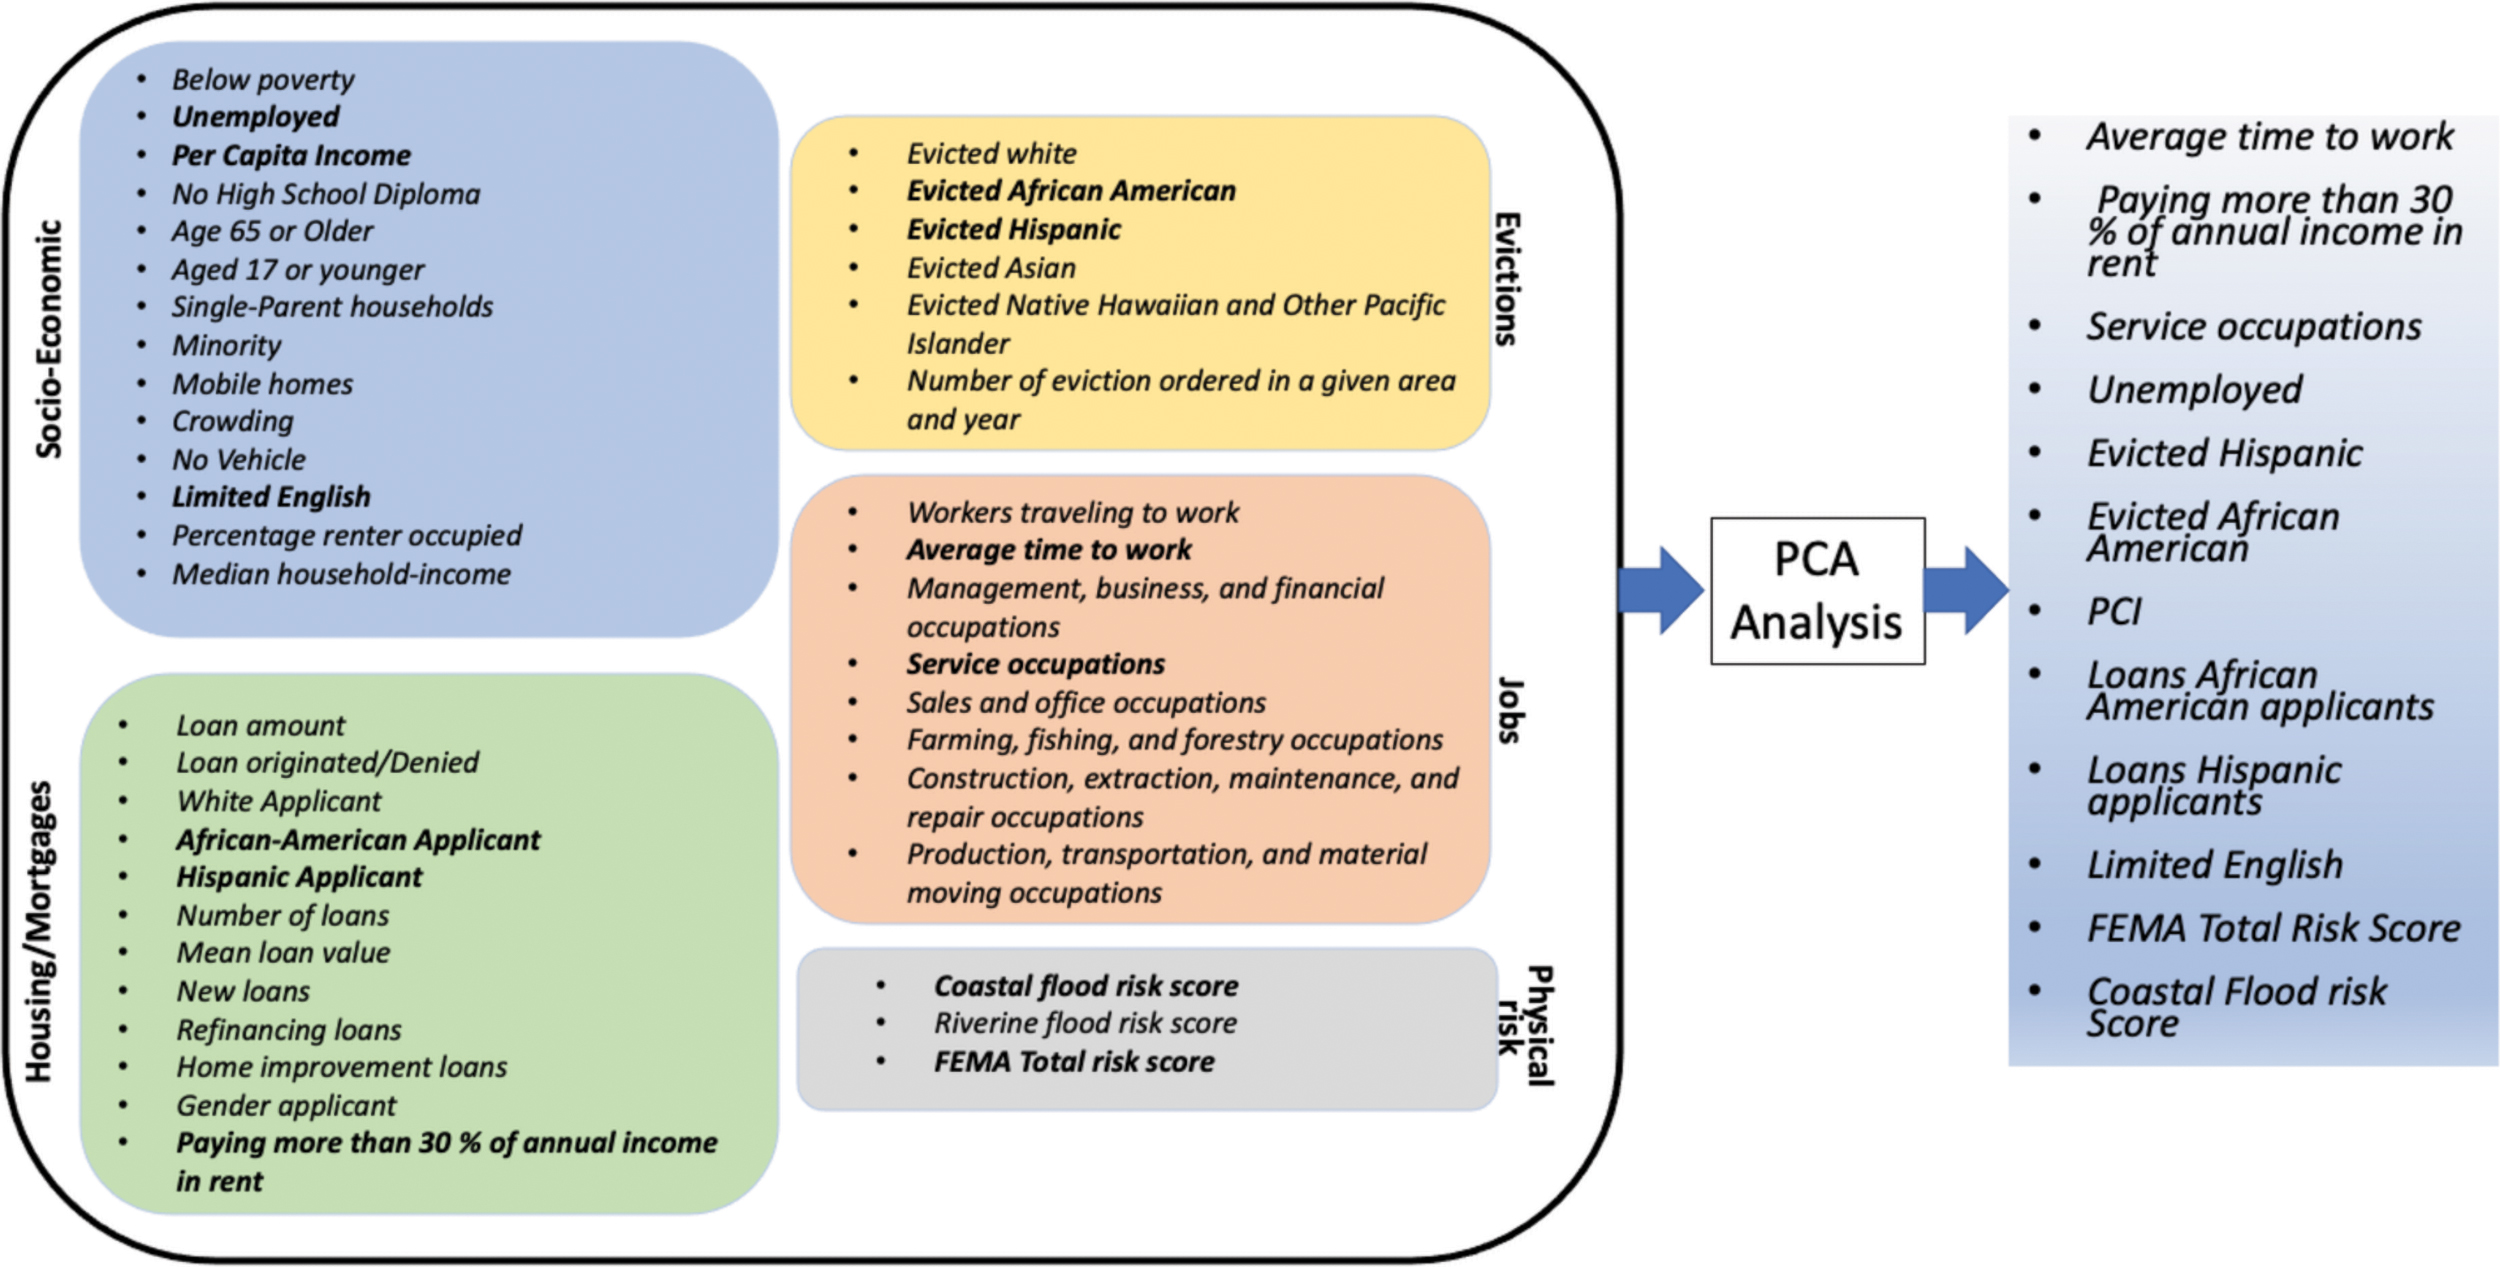
List of variables used in the PCA analysis (left) along with selected variables of interest for a correlation analysis (right). PCA, principal component analysis; FEMA, Federal Emergency Management Agency. Color images are available online.
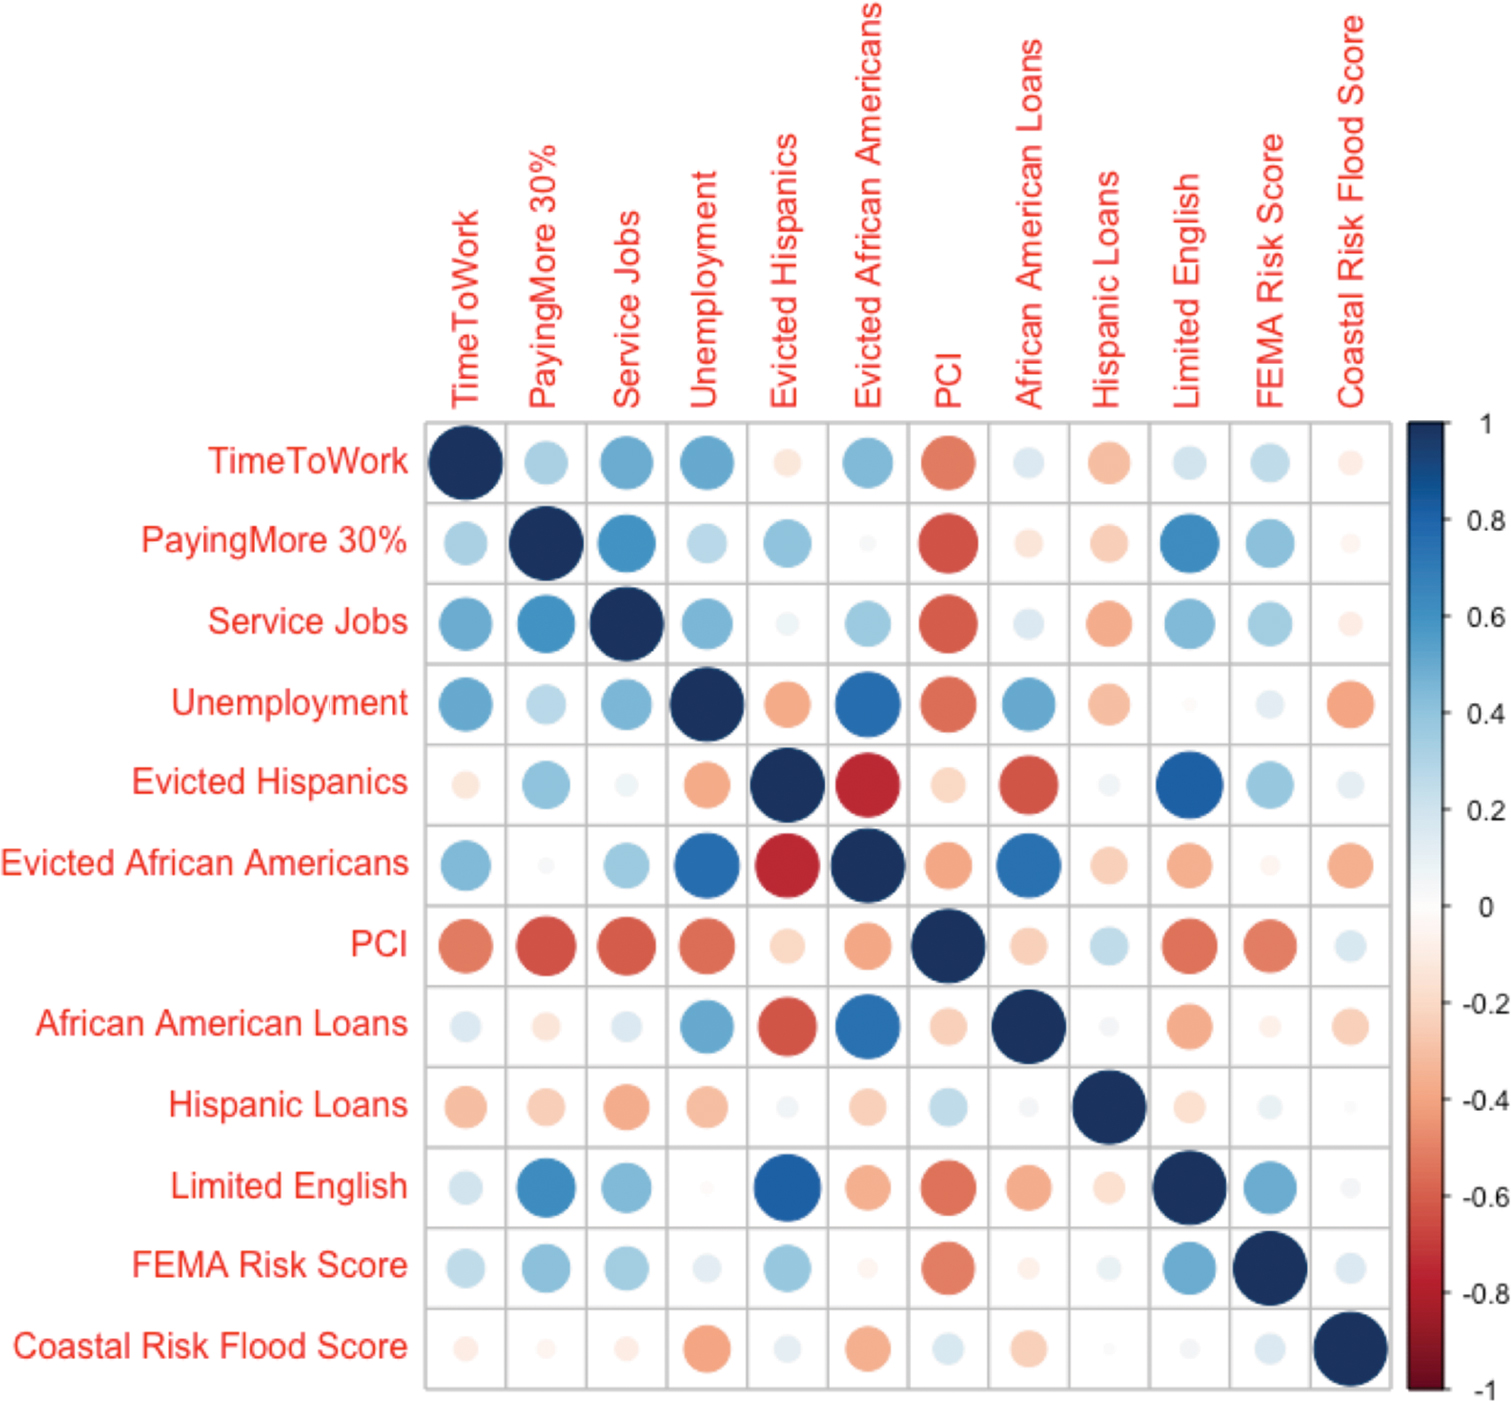
Correlation matrix for the variables selected from the PCA. The size of the circles is proportional to the magnitude of the correlation. Blue color indicates a positive correlation. Red color indicates a negative value. Color images are available online.
Further, we generated three indices based on socioeconomic data, coastal and riverine risk, as well as mortgages and evictions using selected variables obtained from the PCA analysis. As already mentioned, we are not suggesting to use such indices for general use (though we do not exclude this possibility) but here we aim at showing the potential information arising from the granularity of the datasets concerning, for example, racial and ethnic variables related to financial housing data.
We define a socioeconomic index (SEI) by using the percentage of people with limited English (LIMENG) and of unemployed people (UNEMP) as
We derive the Coastal and Riverine Index (CRI) from the Coastal Flood Score (CFS) and Riverine Flood Score (RFS) available within the FEMA NRI dataset as follows:
Lastly, we obtain an Eviction and Mortgage Index (EMI) from the number of evictions (EVIC) and the number of house mortgages (HMO) as follows:
The three indices are normalized to their maximum values (e.g., ranging between 0 and 1) to allow a comparison across the three of them. The indices are lastly used to create a Total Index (TI) as follows:
also normalized between 0 and 1 for consistency purposes. To account for the race and ethnicity information in the SEPHER dataset, we created two separate EMI indices, one for African Americans (EMIAfAm) and one for Hispanics (EMIHisp). Our idea behind this choice was to evaluate the potential differences arising from indices that can include racial and ethnic information to address the needs of a specific racial or ethnic category. In Figure 5, we show the maps for (a) the SEI, (b) CRI, (c) EMIAfAm, (d) EMIHisp, (e) TIAfAm, and (f) TIHisp. The SEI index (Fig. 5a) highlights pockets of areas at high socioeconomic risk in the southwest portion of our study area, with the geographic distribution of the values highlighting strong contrast among nearby neighborhoods without identifying specific larger regions of risk. The CRI (Fig. 5b) indicates, as expected, that regions facing the ocean and along river bodies (e.g., North Fork Miami River) have higher risks, with tracts inland (such as, for example, Little River and Biscayne) showing a non-negligible to moderate risk. When looking at the EMI (Fig. 5c, d), we note stark differences when considering African Americans (Fig. 5c) or Hispanics (Fig. 5d). In the case of African Americans, indeed, the areas with the highest index values are located in the northwest portion of our study area, showing a strong complementary geographic pattern with respect to those having high values in the case of Hispanics. The map of TIAfAm (Fig. 5e) shows that there is riverine flood risk in the southwest portion of our study area and exposure to flooding along the coast, as well as the potential risk arising from evictions and mortgages in the northwest. On the other hand, in the case of Hispanics (TIHisp; Fig. 5f), the highest risk is concentrated in the southwest portion.
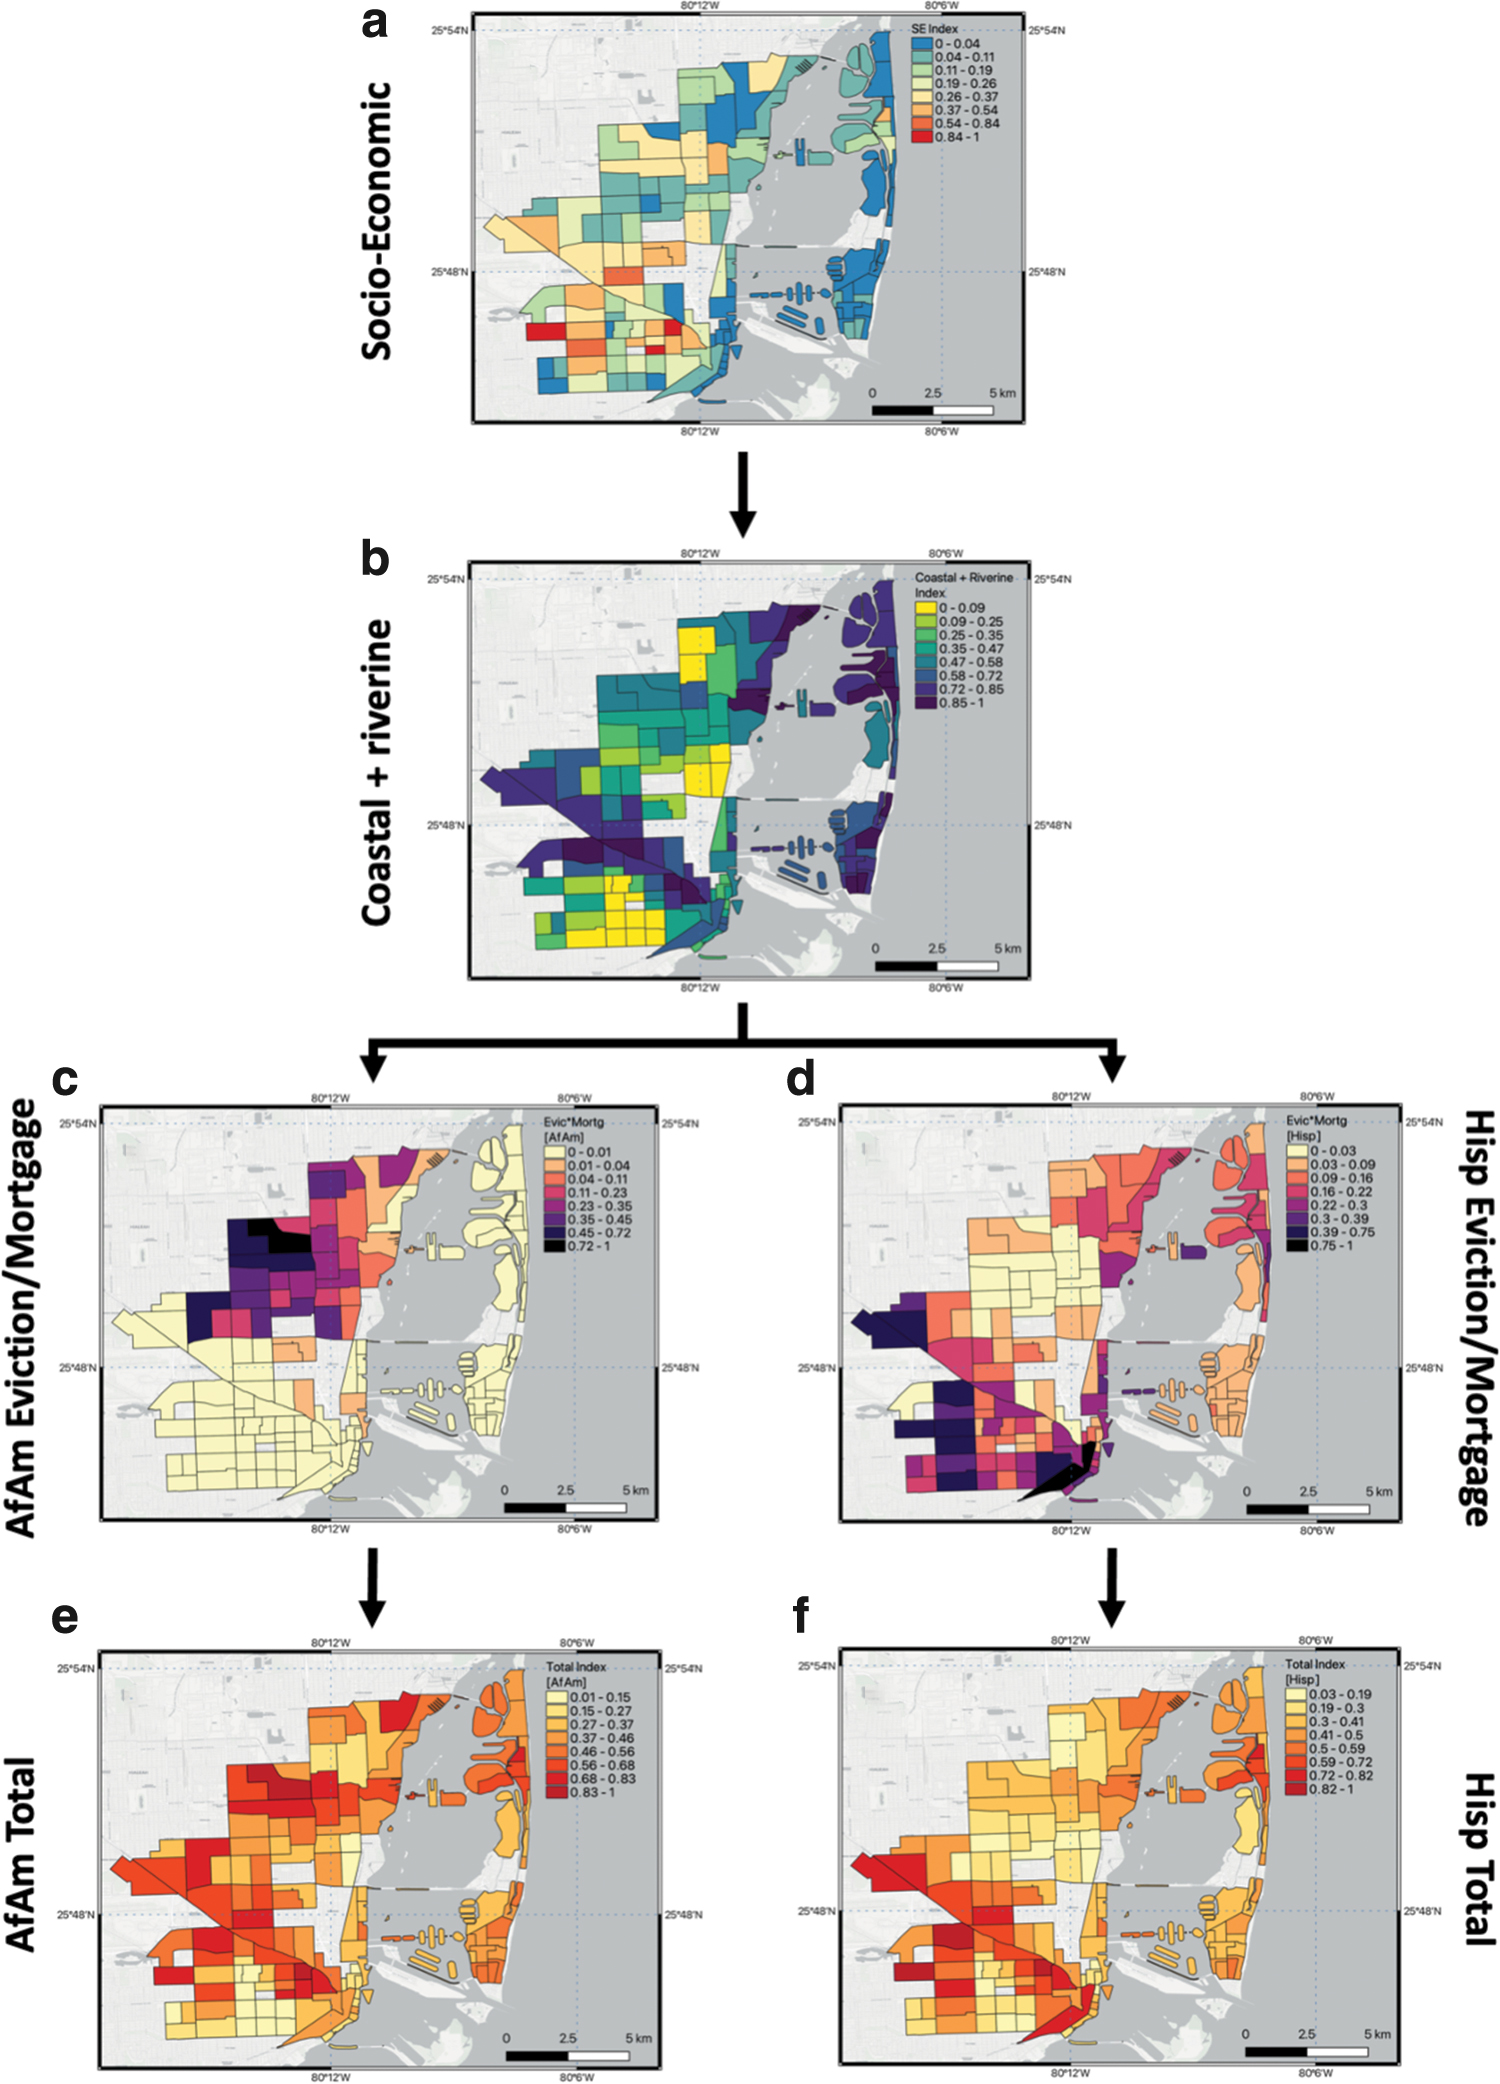
Indices obtained from selected variables derived from the PCA analysis.
Conclusions
Our results show the complementary information that can arise from considering racial, ethnic, and other factors for indices or score developments and highlight the potential of the SEPHER dataset in developing or deploying more just metrics related to the impact of climate change on socially vulnerable people. Datasets that directly tie financial circumstances to factors of vulnerable populations are critical for evaluating areas of vulnerability. Typically, census data used for assessing vulnerability are aggregated to spatial units without connections between socioeconomic vulnerability, house data, or accounting for race, ethnicity, or gender. In this study, we introduced a new dataset (named SEPHER) integrating socioeconomic, physical risks, evictions, and mortgage data at the census tract level for the United States, which accounts for the stated factors with the goal of supporting the development of metrics that can pursue climate justice. Clearly, data itself does not solve the problem, but it is a first step, as one cannot truly understand where the worst inequities lie until the data are available and can be properly used or assessed. In this regard, SEPHER builds on publicly available datasets, contrary to the current tendency of using commercial, proprietary data. There are numerous opportunities to utilize SEPHER to create metrics and consider factors that are important to environmental justice in case studies throughout the United States. To this end, we presented examples of results showing the potential complementary nature of the different variables included within SEPHER and applied PCA-based analysis to show how it is possible to evaluate relationships among the many variables. We focused on the city of Miami, where sea level rise and extreme weather are having and will continue to have a significant impact on the economy and socially vulnerable people. Our results indicate that accounting for variables derived from house mortgages and eviction datasets, in conjunction with racial or ethnic information, is important for addressing or assessing the impacts of climate on several socially vulnerable groups.
The dataset and the tool here presented can be used for several applications. Studies focusing on the gentrification associated with increased floods might be able to focus on specific ethnicities or races to capture the processes driven by policy choices or government actions. For example, in many of the areas we observed with SEPHER we found (not reported in this manuscript) that several areas where climate gentrification is occurring fall within the so-called Opportunity Zones, whose purpose is to spur economic growth and job creation in low-income communities while providing tax benefits to investors. Another application concerns the studying of the relationships between the evolution of mortgages, evictions, ethnicity, and the pressure on specific categories of jobs. The dataset can also be used in conjunction with machine-learning tools that have become very popular in recent years to capture complex relationships. This would allow for the identification of new ways to support environmental and climate justice through the adoption of better-informed policies and actions that address socio-vulnerable populations from a racial and ethnic perspective.
On our side, we plan to continue exploring the potential of the SEPHER dataset to address issues related to the housing market and climate justice over other areas within the United States when considering physical risks beyond flooding. We encourage future research in this direction and invite public, media, advocacy groups, and researchers to make use of the SEPHER publicly available integrated dataset.
Footnotes
Authors' Contributions
The work has not previously been published and is not under consideration for publication elsewhere. All authors have read and agree with the contents of the submission and have contributed substantially to the work. M.T. conceived the study. M.T. and C.G.H. contributed to the development of the work. All authors contributed to the writing of the manuscript.
Data Availability
The SEPHER dataset is freely available on request by sending an e-mail to the corresponding author.
Author Disclosure Statement
The authors declare no conflict of interest.
Funding Information
This work was supported by the Columbia RISE program and the Earth Institute at Columbia University.
Supplementary Material
Please find the following supplemental material available below.
For Open Access articles published under a Creative Commons License, all supplemental material carries the same license as the article it is associated with.
For non-Open Access articles published, all supplemental material carries a non-exclusive license, and permission requests for re-use of supplemental material or any part of supplemental material shall be sent directly to the copyright owner as specified in the copyright notice associated with the article.