
Abstract
Minority communities in Louisiana have long been at the forefront of the struggle to achieve environmental justice. To date, much of this struggle has focused on communities located in the Mississippi River Chemical Corridor, where rural African American communities have historically been disproportionately impacted by the growth of the petrochemical industry. This research examines the broader oil and gas production chain and shows that minority groups residing in Louisiana's coastal zone have been increasingly disproportionately impacted by the development of the offshore oil and gas industry. Extracting and processing oil and gas is an energy-intensive undertaking that requires an expansive network of land-based infrastructure. This infrastructure includes gas processing plants, refineries, petrochemical plants, and a pipeline network that link extraction activities to production activities. In addition, there is extensive infrastructure associated with oil and gas development that is not usually considered within the oil and gas production hierarchy, such as platform fabrication, ship building, and pipe coating. Due to the often-conflicting geographies of risk and settlement, these hazards are not equitably distributed across social groups. Using a combined risk and proximity-based hazardousness of place model to assess the cumulative impacts of these industries, this research found that oil and gas development from 1980 through 2010 has increasingly impacted the Native American and Asian populations in coastal Louisiana, groups that have historically been dependent on the region's abundant fisheries. This research also found that racial and ethnic minority groups are more likely to be disproportionately impacted than other socially vulnerable population groups.
INTRODUCTION
Extracting and processing offshore oil and gas is an energy-intensive undertaking that requires an expansive network of land-based infrastructure. This infrastructure includes gas processing plants, refineries, petrochemical plants, and a pipeline network that link extraction activities to production activities. In addition, there is extensive infrastructure associated with oil and gas development located offshore on the outer continental shelf (OCS) that is not usually considered within the oil and gas production hierarchy. Industries such as platform fabrication, ship building, and pipe coating facilitate oil and gas exploration and downstream production activities.
Although the development and expansion of the oil and gas industry has fostered economic growth and provided employment opportunities for many coastal residents, there are also potential negatives associated with living and working in proximity to oil and gas infrastructure. 1 The oil and gas production process is often associated with physical and public safety hazards, in addition to air, water, noise, odor, and light pollutants. 2 Due to the often-conflicting geographies of risk and settlement, these hazards are likely not equitably distributed across social groups. Previous research indicates the potential for both participatory and distributive injustices in populations living near all phases of oil and gas development, from the wells 3 through the refineries. 4 In some cases, economic development and the growth of industry may exacerbate injustice, making some socially vulnerable groups more vulnerable than they were before this development.
This research assesses the spatiotemporal inequities and environmental justice concerns of upstream and downstream oil and gas operations in coastal Louisiana. In the oil and gas sector, the term “upstream” broadly refers to the searching for and production of crude oil and natural gas and includes those activities that occur before oil and gas production has started. 5 The upstream supply chain reaches its endpoint at the extraction site, be it an onshore well or an offshore drilling rig. Conversely, the downstream supply chain refers to those activities that occur after the extraction of product and includes the transportation and processing of crude oil and natural gas. 6 For many oil and gas operations in coastal Louisiana, the downstream supply chain reaches a terminus in the Mississippi River Chemical Corridor, an 85-mile stretch of river home to more than 150 industrial and petrochemical facilities.
The Chemical Corridor has come to be emblematic of environmental justice concerns in Louisiana, with more than 80% of releases reported through the Toxic Release Inventory emanating from this stretch of the Mississippi River, 7 but it is far from the only such concern. The potential for adverse impacts exists at all points along the extensive petroleum supply chain spread throughout the Louisiana's vast coastal and estuarine environments. Previous research conducted in coastal Louisiana for the U.S. Bureau of Ocean Energy Management (BOEM) revealed that minority residents of the wetland fringe, such as members of the United Houma Nation tribe, are far more likely to reside in proximity to oil and gas infrastructure. 8
The inherent threat presented by industrial development in Louisiana's coastal zone is often compounded by natural hazards and tropical weather events. Hurricanes Katrina and Rita, for example, destroyed 46 offshore platforms and damaged 20 others, in addition to damaging nearly 100 pipelines. These incidents resulted in more than 200 “minor” spills involving less than 500 barrels of oil, many of which directly affected small rural communities in the immediate vicinity of the spills. Other incidents at downstream facilities such as refineries have the potential to impact larger numbers of people. The largest release associated with Hurricane Katrina occurred at the Murphy Oil refinery, which spilled ∼819,000 gallons of crude oil into a highly populated area of St. Bernard Parish after an above-ground storage tank was damaged as a result of storm surge and flooding associated with Hurricane Katrina. 9 The broad spatial scale of the oil and gas production chain presents a highly complex hazards surface with the potential to negatively impact human populations at several key points.
Environmental justice and social vulnerability are the two theoretical concepts that form the framework of this assessment. As defined by government agencies, environmental justice functions as an accounting system whereby agency personnel seek to identify minority and low-income populations and determine whether an agency's actions have a disproportionate impact. 10 In this context, environmental justice examines the relationship between governmental actions, environmental risk, and population distribution. Social vulnerability measures the extent to which disadvantaged population groups have a heightened potential for social and economic losses during and after a hazardous event. 11 Building on these concepts, the current research assesses spatiotemporal variations in exposure to oil- and gas-related hazards across various social and economic populations in coastal Louisiana.
Understanding the historical dynamics of inequity generation over decades can help determine the goals, policy demands, and development strategies for future oil and gas development. 12 To explore the dynamic aspects of social vulnerability in the offshore oil and gas industry, this study analyzes the potential impacts of OCS-related hazards across three decadal periods from 1980 to 2010 for a number of socially vulnerable population groups in coastal Louisiana.
Environmental justice
Broadly speaking, environmental justice focuses on the notion of achieving equity within the realm of public policy and environmental protection. In providing standardized guidance for federal agencies, the United States Environmental Protection Agency (USEPA) defines areas of environmental justice concern as those locations where minority, low-income, tribal, or indigenous populations or communities potentially experience disproportionate environmental harms and risks as a result of greater vulnerability to environmental hazards. 13
One of the core tenets of environmental justice from a governmental perspective is that the development, implementation, and enforcement of environmental laws, regulations, and policies involve the fair treatment and meaningful involvement of all people, regardless of race, color, national origin, or income. 14 From a regulatory standpoint, fair treatment means that “no group of people should bear a disproportionate burden of environmental harms and risks, including those resulting from the negative environmental consequences of industrial, governmental, and commercial operations or programs and policies.” 15
This research examines the spatial distribution of technological hazards associated with the offshore oil industry and how this distribution varies among different socioeconomic groups in coastal Louisiana. BOEM, an agency of the United States Department of the Interior, has a legal mandate under the Outer Continental Shelf Lands Act (OCSLAA) to consider the potential impacts of oil and gas exploration on the human environment. The human environment is defined by the OCSLAA as the “physical, social, and economic components, conditions, and factors which interactively determine the state, condition, and quality of living conditions, employment, and health of those affected, directly or indirectly, by activities occurring on the OCS.” 16 Activities occurring on the OCS directly influence a range of upstream and downstream industrial activities that occur onshore, potentially impacting the human environment and creating potential environmental justice concerns.
Social vulnerability
Environmental justice research initially concentrated on the presence of environmental hazards in neighborhoods dominated by poor populations or specific racial groups. Recent research, however, has begun to focus on other socially vulnerable populations, including those defined by age, level of disability, and gender. 17 Social vulnerability refers to the characteristics of population groups that may influence their capacity to anticipate, cope with, resist, or recover from the impact of a hazards event. 18 Environmental justice and equity research focuses specifically on low-income and minority populations, whereas social vulnerability assessments focus more broadly on the inherent sensitivity of these and other population groups that may ultimately influence how they respond to hazardous events.
Previous research found that social vulnerability in coastal Louisiana is linked to several factors, including economic status, rural population, age, and natural resource dependence. 19 Socially vulnerable populations have a heightened potential for losses and adverse recovery outcomes compared with the entire population of individuals that are occupying at-risk locations in coastal Louisiana. In the case of gradual onset events, such as coastal land loss and long-term exposure to oil and gas pollution, immediate evacuation may not be needed, but issues related to population relocation become important.
Natural resource dependence is a unique sensitivity, because it occurs alongside environmental change and a wider political economy of resource use. Economic and cultural reliance on natural resources can be altered by climate change and other exogenous factors. 20 Natural resource dependence on the oil and gas industry is a social vulnerability because of the boom-bust cycles associated with the expansion and contraction of global petroleum markets. 21 The impacts of these fluctuations ripple through resource-dependent communities and are experienced at multiple scales, including the community, the household, and the individual. An overreliance on extractive industries can, therefore, lead to unstable economic growth, particularly in rural communities, which can lead to long-term economic stagnation and the perpetuation of poverty. 22
METHODS
This research utilizes a combination of geospatial and statistical analyses to assess historical changes in exposure to industrial hazards in coastal Louisiana. An industrial hazardousness of place model was developed and used to make inferences about the disproportionate risk of being exposed to cumulative oil and gas-related hazards on a decadal basis from 1980 to 2010. To operationalize the model, this research focused on the following three elements: biophysical, social, and place vulnerability. 23 The delineation of oil-related hazard zones provided biophysical vulnerability, whereas social and demographic characteristics yielded measures of social vulnerability. The interchange of biophysical and social vulnerability factors provides overall place vulnerability assessed at the census block level.
Study area
The focus of this study was the 39 coastal and near-coastal Louisiana parishes defined by the National Oceanic and Atmospheric Administration (NOAA)
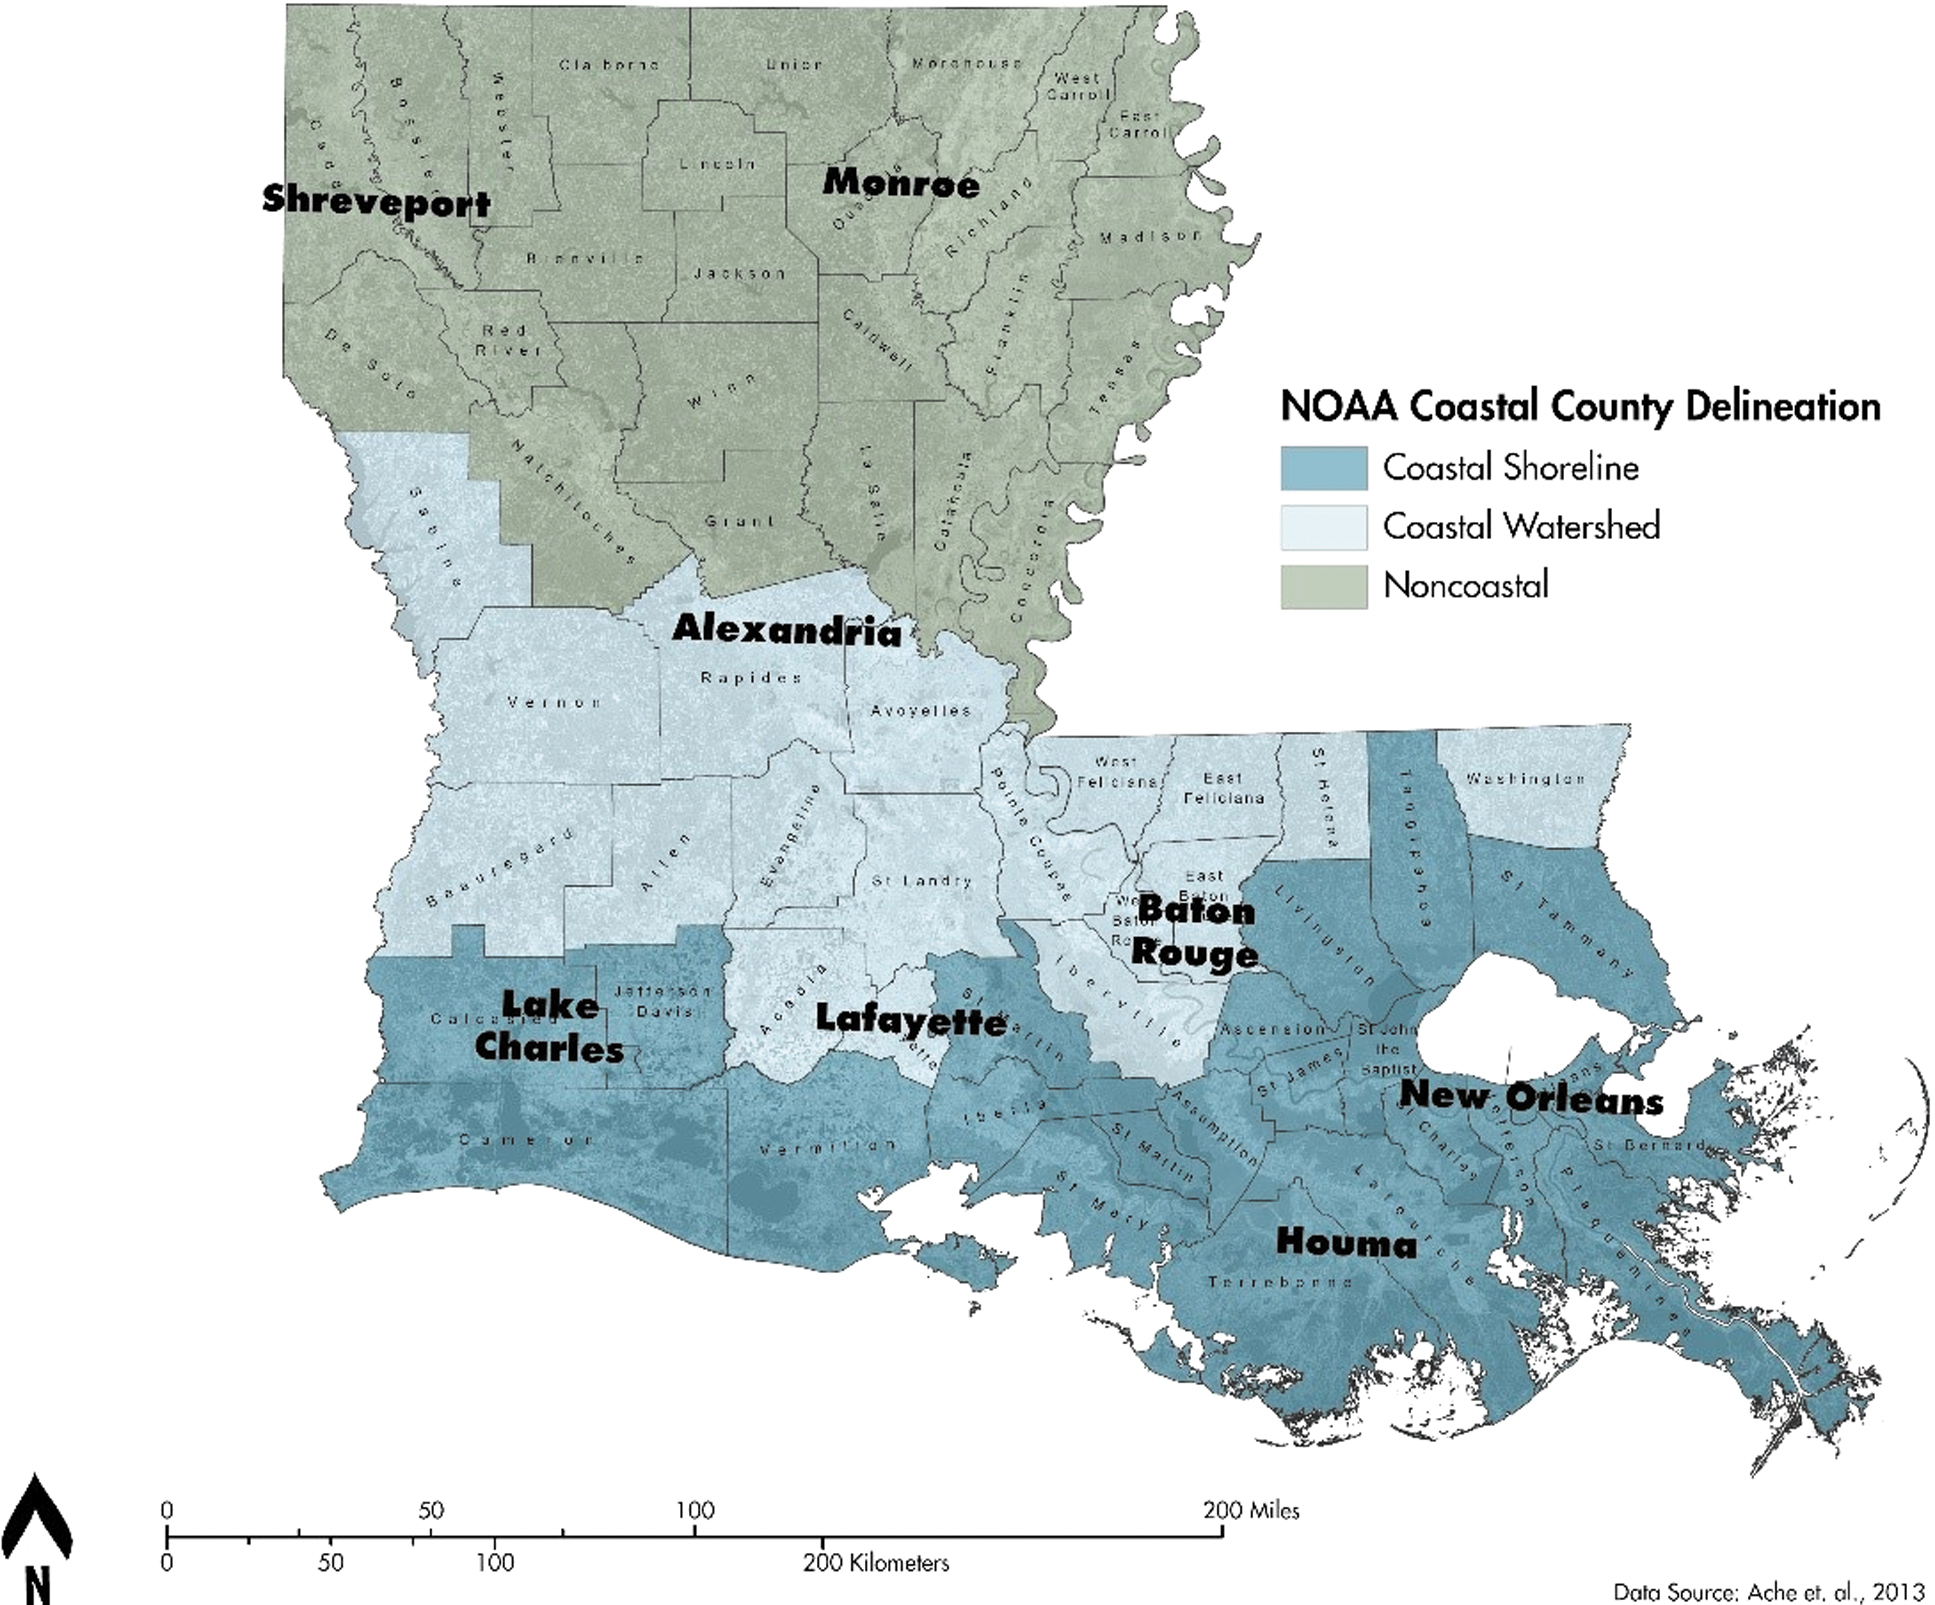
NOAA Coastal County delineation. NOAA, National Oceanic and Atmospheric Administration.
In sum, nearly 80% of Louisiana's population resides in the coastal parishes, an area that includes 10 of the State's largest cities and four of its five largest: New Orleans, Baton Rouge, Lafayette, and Lake Charles. In addition, more than 41% of all Louisiana workers reside in these parishes, a great many of whom are employed in coastal economy sectors. 25 Compared with the State as a whole, Louisiana's coast is more industrialized and urban, with a higher percentage of oil- and gas-related employment, the vast majority of which is tied to offshore production.
Cumulative environmental risk mapping
Cumulative risk assessment is an approach that the USEPA considers for characterizing how risks may disproportionately affect one group relative to another that involves an evaluation of the combined risks from aggregate exposure to multiple agents or stressors. 26 The industrial hazardousness of place model developed for this research was constructed by using a combination of risk and proximity-based methods that account for both toxicity of potential hazardous releases and distance-related impacts that may have negative impacts on overall quality of life, including unsightliness, noise, and odor. 27 Building off of earlier environmental justice assessment methods developed for the BOEM, this research identified the industrial infrastructure associated with the oil and gas production process 28 and then quantified the hazardousness of the different types of oil and gas infrastructure based on potential toxicity and impacts on human health. 29
Detailed infrastructure locations were derived from a number of secondary data sources, including BOEM, USEPA permit records, and the Louisiana Department of Natural Resources (LDNR). Facility construction dates were used to classify infrastructure development into decadal categories that mirror decennial census periods to evaluate temporal change in coastal Louisiana's oil and gas hazardscape. Data from decennial censuses are quite precise at fine spatial resolutions but survey samples in between decennial censuses are much smaller, which hinders analysis of change in demographics between census periods. 30 As a result, historical change in oil and gas development was analyzed on a decadal basis.
Subsequent to the collection and classification of facility-level data, each infrastructure location was assigned an intensity value, influence distance, and a distance decay function that detailed the shape of the influence curve. Hazard intensities were developed by using the USEPA Risk-Screening Environmental Indicators model. 31 This model includes quantitative data on the amount of chemicals released as well as environmental transport, relative toxicity to biota, and potential for human exposure. RMP*Comp, an off-site consequence calculation tool developed by USEPA, was also used to model worst-case scenario chemical releases for facilities located within the study area and calculate the distance at which certain effects might occur to the public because of an accidental release (called the “endpoint” distance). 32 In the case of flammable substances, people at the endpoint distance could be injured by the force of the blast, by flying glass, or by falling objects. In the case of the release of a hazardous substance, people at the endpoint distance would be able to walk away from the exposure without any long-term health consequences, although some short-term consequences such as eye or throat irritation are likely.
The endpoint distance values were used to create a series of buffers around each of the facilities. These buffer distances extend outward from the risk element's feature (where the risk activity is occurring) at a drop-off in intensity defined by a distance decay function. Simply put, the intensity values of a risk element progressively drop off as the maximum influence distance is approached. As such, target populations more distant from a risk element are assumed to experience a lower risk value than those closer to the features center. Assuming the potential threat to nearby communities is greatest in areas immediately adjacent to the facilities, this research utilized a concave decay rate to quantify an initially severe drop-off in intensity values followed by a gradual decline as the toxic end point distance is approached. 33
Finally, a simple arithmetic overlay produced a conceptual model of the potential hazardscape related to the onshore impact of oil-related infrastructure, combining each facility buffered to the toxic endpoint distance into a single composite of intersecting raster grid cells. This allowed us to classify all locations in the study area according to their cumulative hazards value. This was then broken down into deciles, with one indicating the lowest hazard potential and 10 the highest. Those areas with no identified potential hazards were assigned a value of zero and classed separately. To calculate disproportionate exposure, this study examined the count of socially vulnerable population groups residing in exposed, defined as those living in the two most hazardous deciles, versus non-exposed locations. The industrial hazardousness of place model, thus, enabled the combination of infrastructural, spatial, health, and demographic data to assess the potential environmental justice impacts of the entire network of oil- and gas-related infrastructure in the study area.
The process described earlier was replicated to create a series of industrial hazardousness of place models for 1980, 1990, 2000, and 2010. Raster math functions were then used to map change in hazard intensity over time (Figs. 2–4). The resultant model outputs were interpolated to census block geography and joined to the respective decennial census population data for demographic analysis.
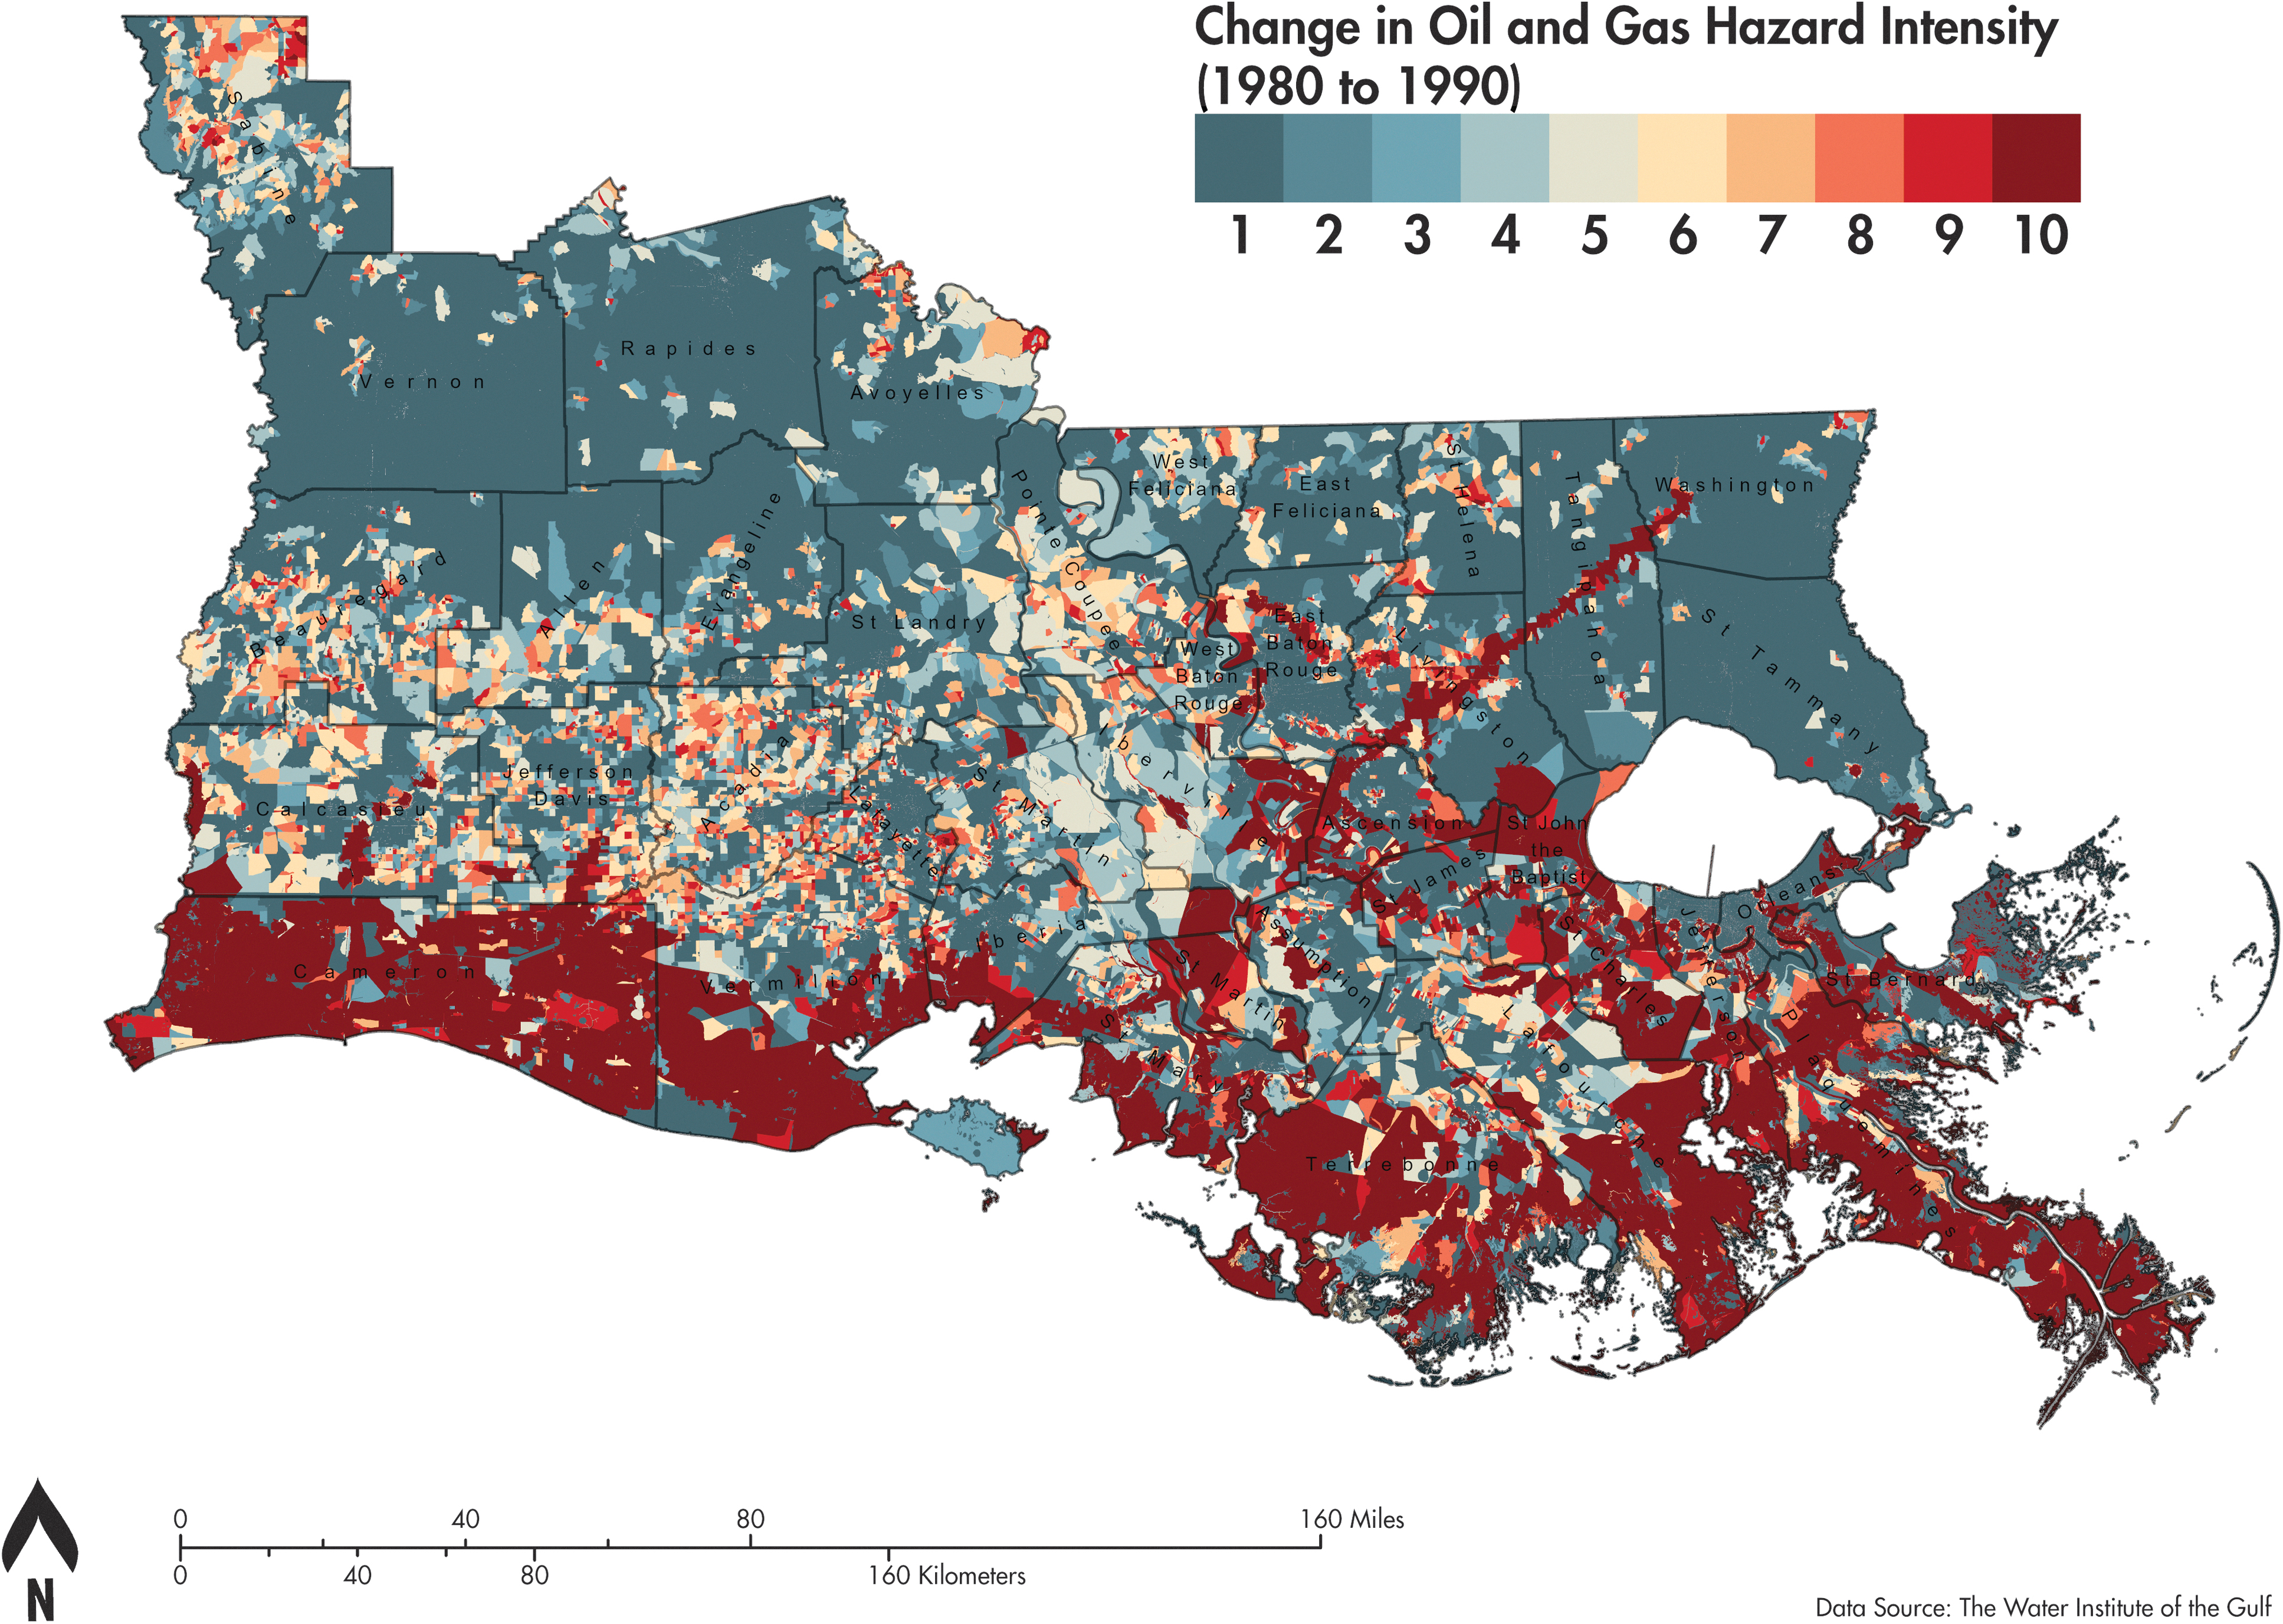
Change in oil and gas infrastructure weighted density from 1980 to 1990.
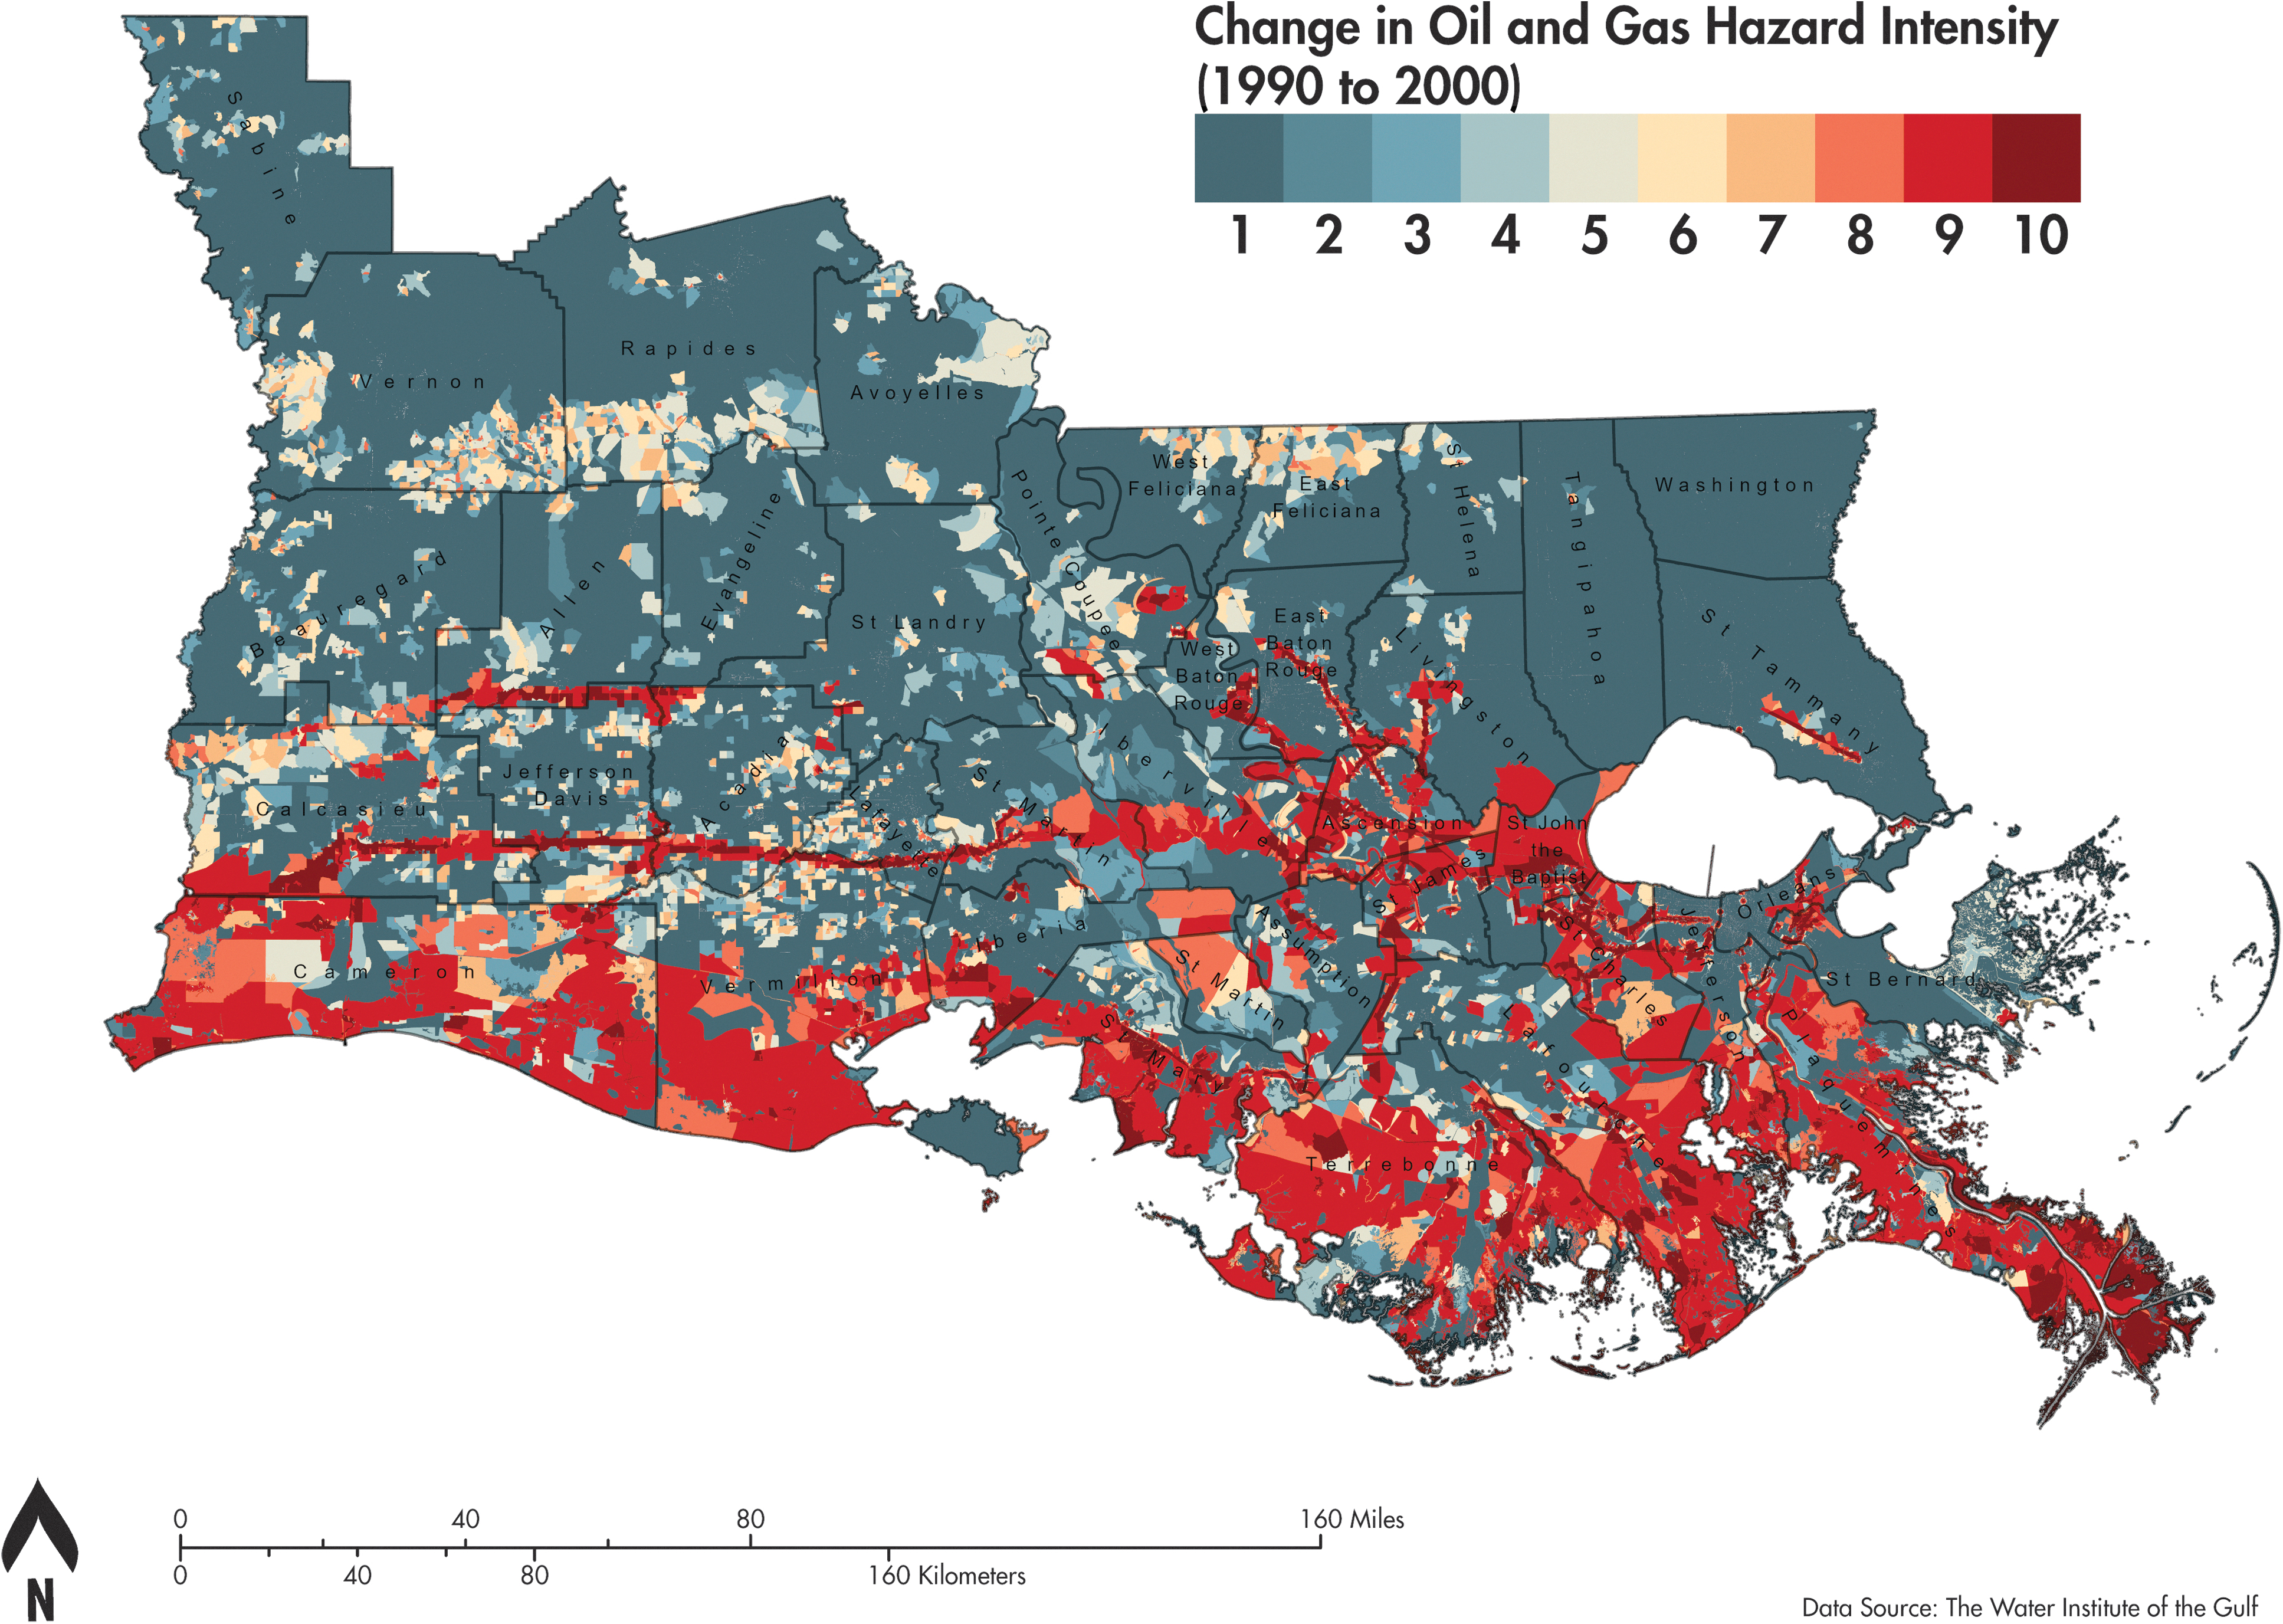
Change in oil and gas infrastructure weighted density from 1990 to 2000.
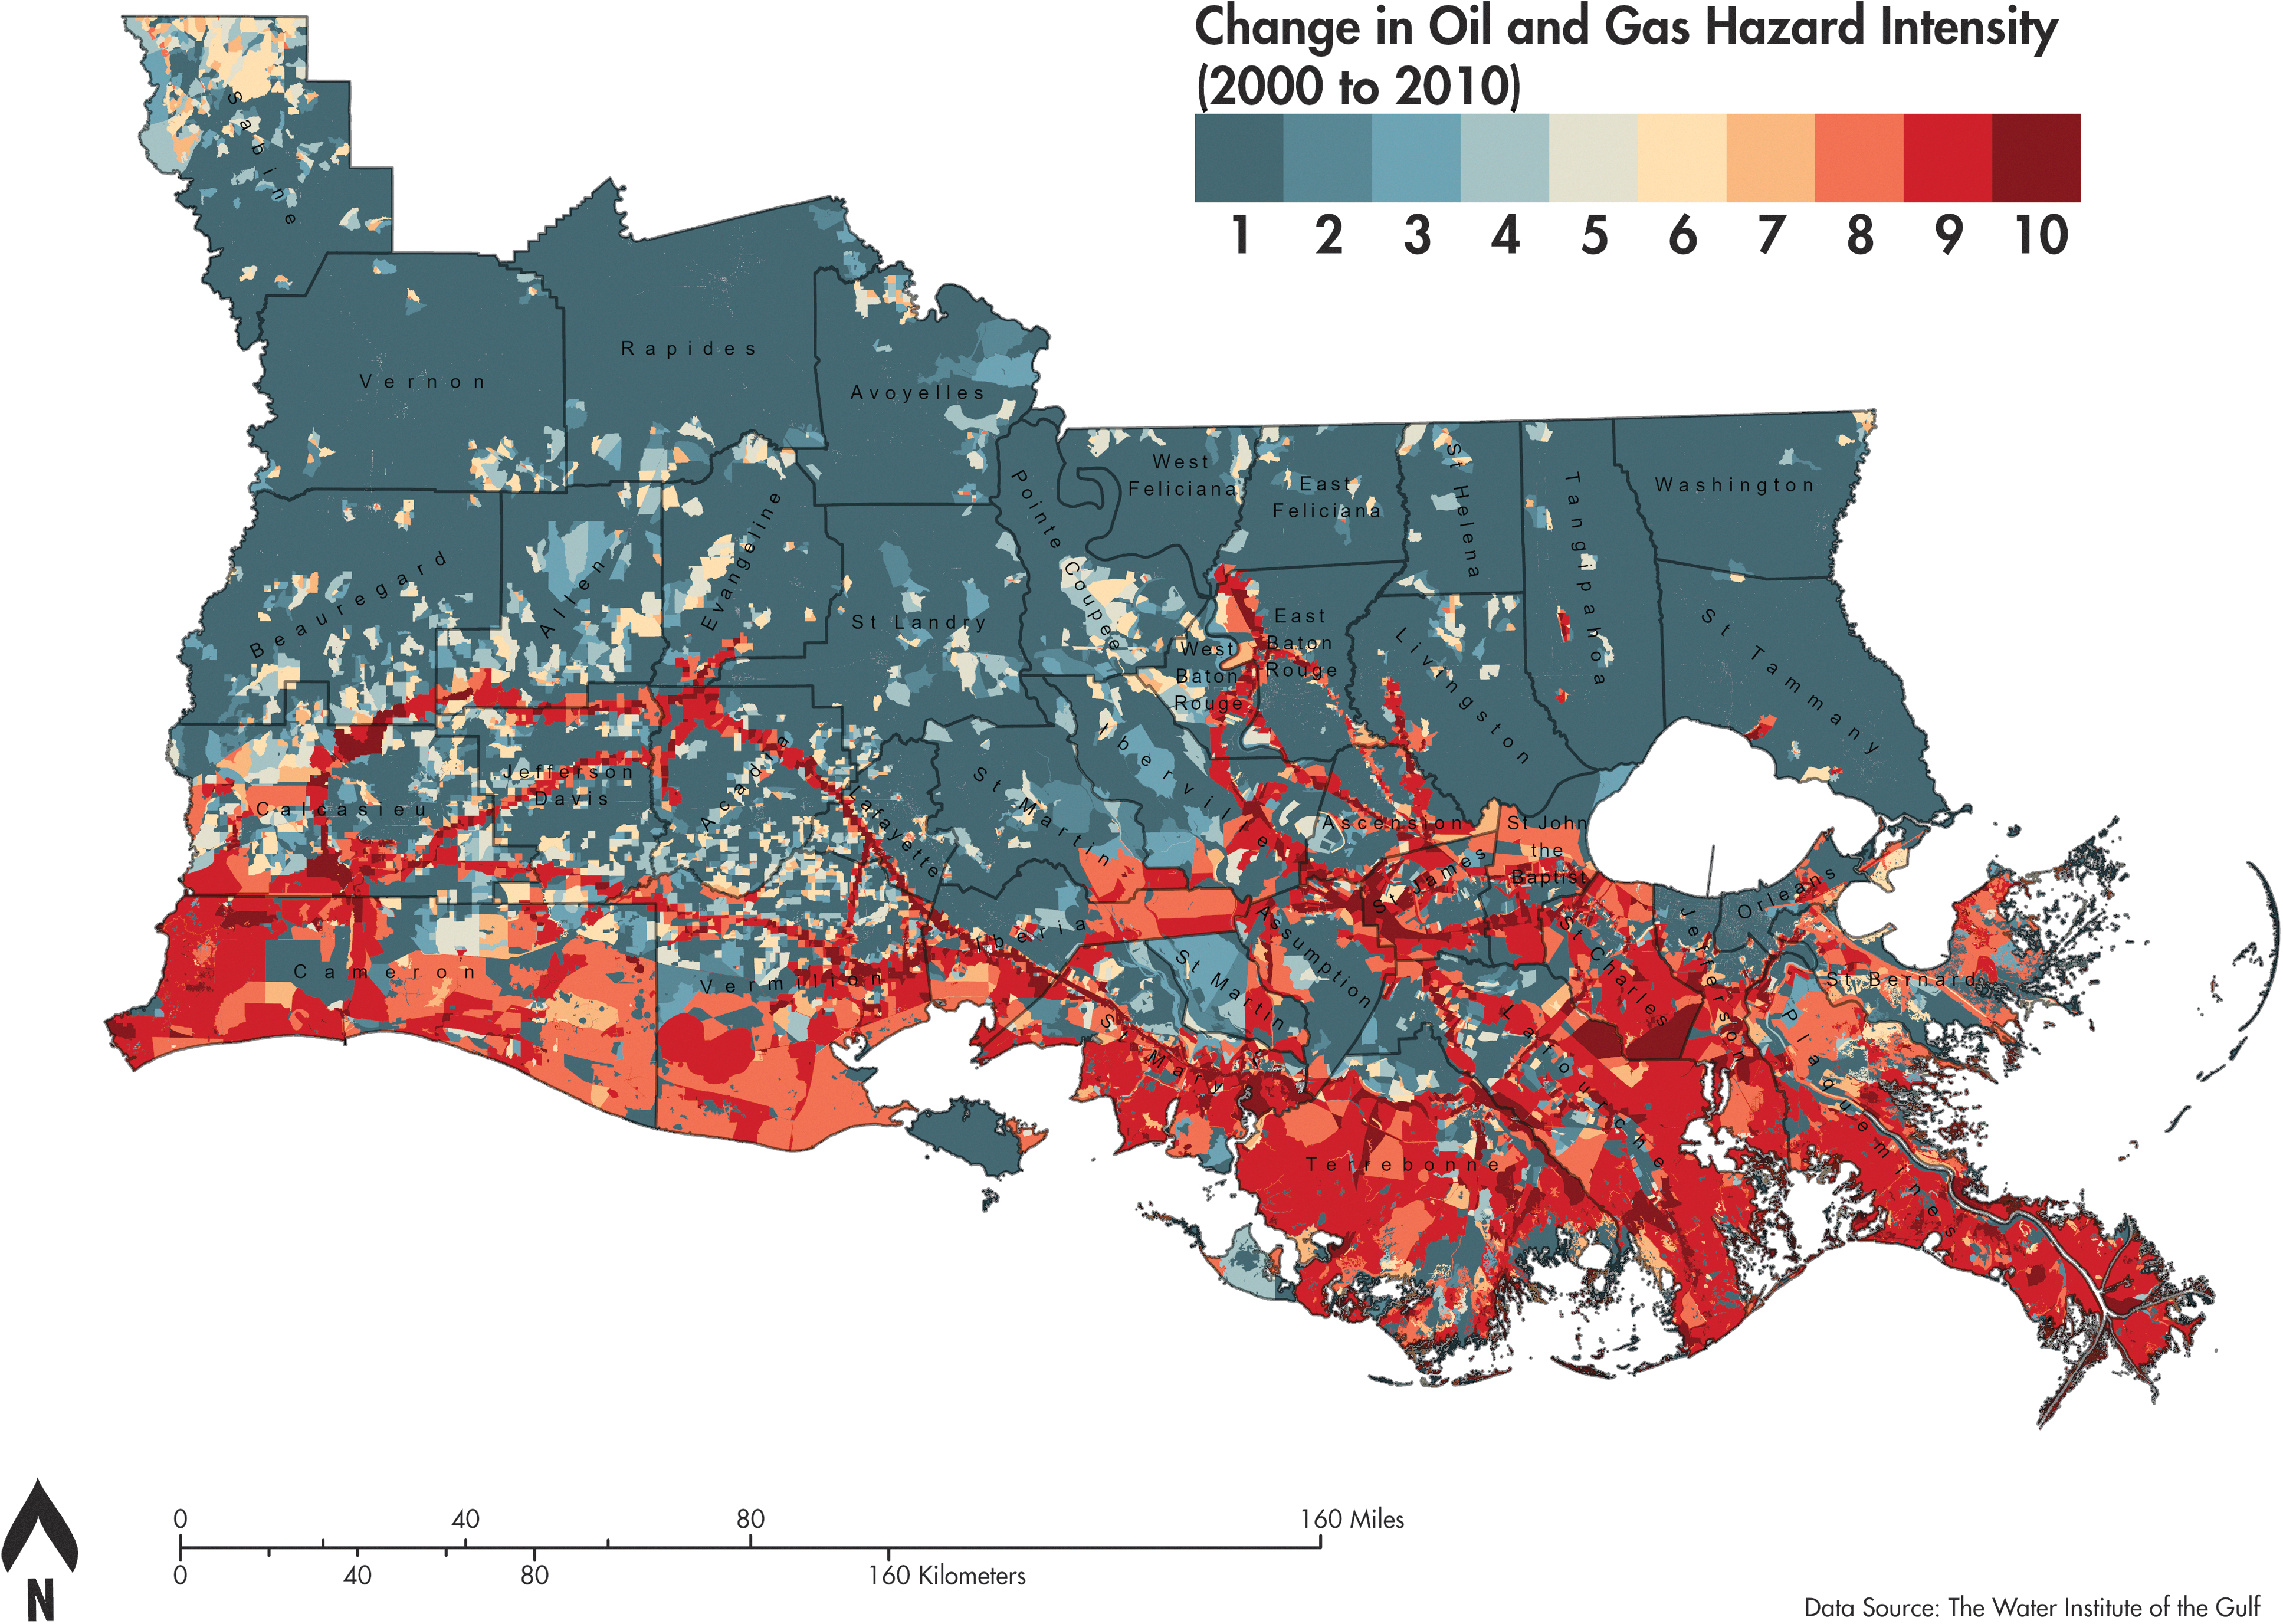
Change in oil and gas infrastructure weighted density from 2000 to 2010.
Coastal demographics
Given that hazards arise from the interaction between social, technological, and natural systems, 34 any examination of environmental justice and disproportionate impact should begin with an analysis of the population of potentially impacted areas. This analysis draws on the U.S. decennial census and relies on census enumeration units for its population analysis. Recognizing that evidence of racial, ethnic, and income inequities becomes stronger when using smaller enumeration units such as census tracts and block groups, 35 this research measures the correlation between oil- and gas-related hazards and demographics at the census block level. This will guard against the ecological fallacy, an analytical problem that arises when conclusions drawn at higher levels of aggregation are applied to finer levels of disaggregation. For this reason, it is desirable to base environmental equity assessments on the smallest aggregation units available. 36
The use of block-level data also provides more spatial accuracy in delineating population location. Because census units are delineated to have similar numbers of people, they are considerably smaller in densely populated urban areas. This becomes problematic in rural locations where enumeration units such as tracts and block groups often have low population densities and often large swaths of unpopulated land.
37
For demographic data to most closely correspond with the spatial scale of the hazards outputs developed, this research utilized block-level population counts and demographic data from the 1990, 2000, and 2010 U.S. Censuses to determine the number and type of residents vulnerable to oil- and gas-related hazards. It is important to note that block-level data, while allowing for a more fine-grained geographical analysis, include a more limited range of data than available at larger levels of aggregation, excluding economic data such as income and property values. Recognizing these limitations, the population and demographic variables analyzed in this research include the following characteristics:
Asian alone Black or African American alone Hispanic or Latino population Native American alone Population younger than 5 years in age Population older than 65 years in age Renter-occupied houses Female-headed households with children
The selected demographic indicators are generally correlated with health status and other susceptibility factors, making them useful screening-level indicators of potential susceptibility at the local level. 38 The impacts of industrial hazards on population groups depend on a combination of exposure and susceptibility. Although this research acknowledges the existence of unique susceptibilities of certain population groups, the focus of this analysis is on the correlations between demographic indicators and exposure to risk.
Statistical analyses
Once all the variables were generated for the hazardousness of place model, the next step in the analysis was to assess the association between these variables and analyze bivariate associations by using Pearson product moment correlations. To determine whether census block-level environmental inequities exist in relation to a number of broad social vulnerability categories, including race and ethnicity (African American, Asian, Hispanic, and Native American populations), age (children and elderly populations), gender (single mother households), and housing tenure (renter occupied housing), a series of statistical analyses used by BOEM in previous environmental justice studies were run on the data. 39
Nonparametric procedures were used to analyze social vulnerability and environmental justice within specified hazardous areas relative to the social vulnerability of the population of the study area outside of these areas. The chi-square test of significance was used to test the hypothesis that the row and column variables in a crosstabulation are independent. In this instance, a low p-value would indicate a significant relationship between a vulnerable population group and proximity to the specified activity.
Although the chi-square test may indicate that a relationship exists, it does not indicate directionality. To assess directionality, this research used odds ratios and relative risk estimates. Odds ratios make inferences about how much higher or lower are the odds of a socially vulnerable individual (relative to an individual who is not a member of that specific vulnerable population) living in proximity to a potentially hazardous facility.40,41 An odds ratio of 1 serves as the baseline of comparison and implies that the two variables being compared (social vulnerability vs. physical vulnerability) are independent. Values of odds ratios that deviate from 1 imply that there is either a positive or negative relationship between the two variables.
The USEPA regulatory guidelines establish the need to evaluate impacts on population groups of concern in relation to another group, typically referred to as a comparison group. 42 It is also important that exposed and nonexposed group members be compared to establish disproportional impact. The odds ratio represents a simple yet powerful statistic that accounts for both populations of concern and the comparison populations. It also compares population groups located near with those far from the hazard source. Odds ratios that are above 1 indicate that the demographic group has a higher level of risk and, therefore, has a higher potential of being disproportionately impacted.
RESULTS
Contingency analysis of the weighted hazards model reveals differences in levels of potential exposure to oil- and gas-related hazards across the different minority groups over time. At the coast-wide level, African American, Asian, Hispanic, and Native American populations were all significantly more likely to reside in the most hazardous census blocks in coastal Louisiana in 1990 (Fig. 5; Table 1). Native Americans were most likely to be found residing in at-risk areas; almost 1.40 times more likely to reside in hazardous areas than outside of these, followed by the Hispanic population, who were 1.22 times more likely to reside in the most hazardous deciles. All these results are significant at the 95% confidence level.
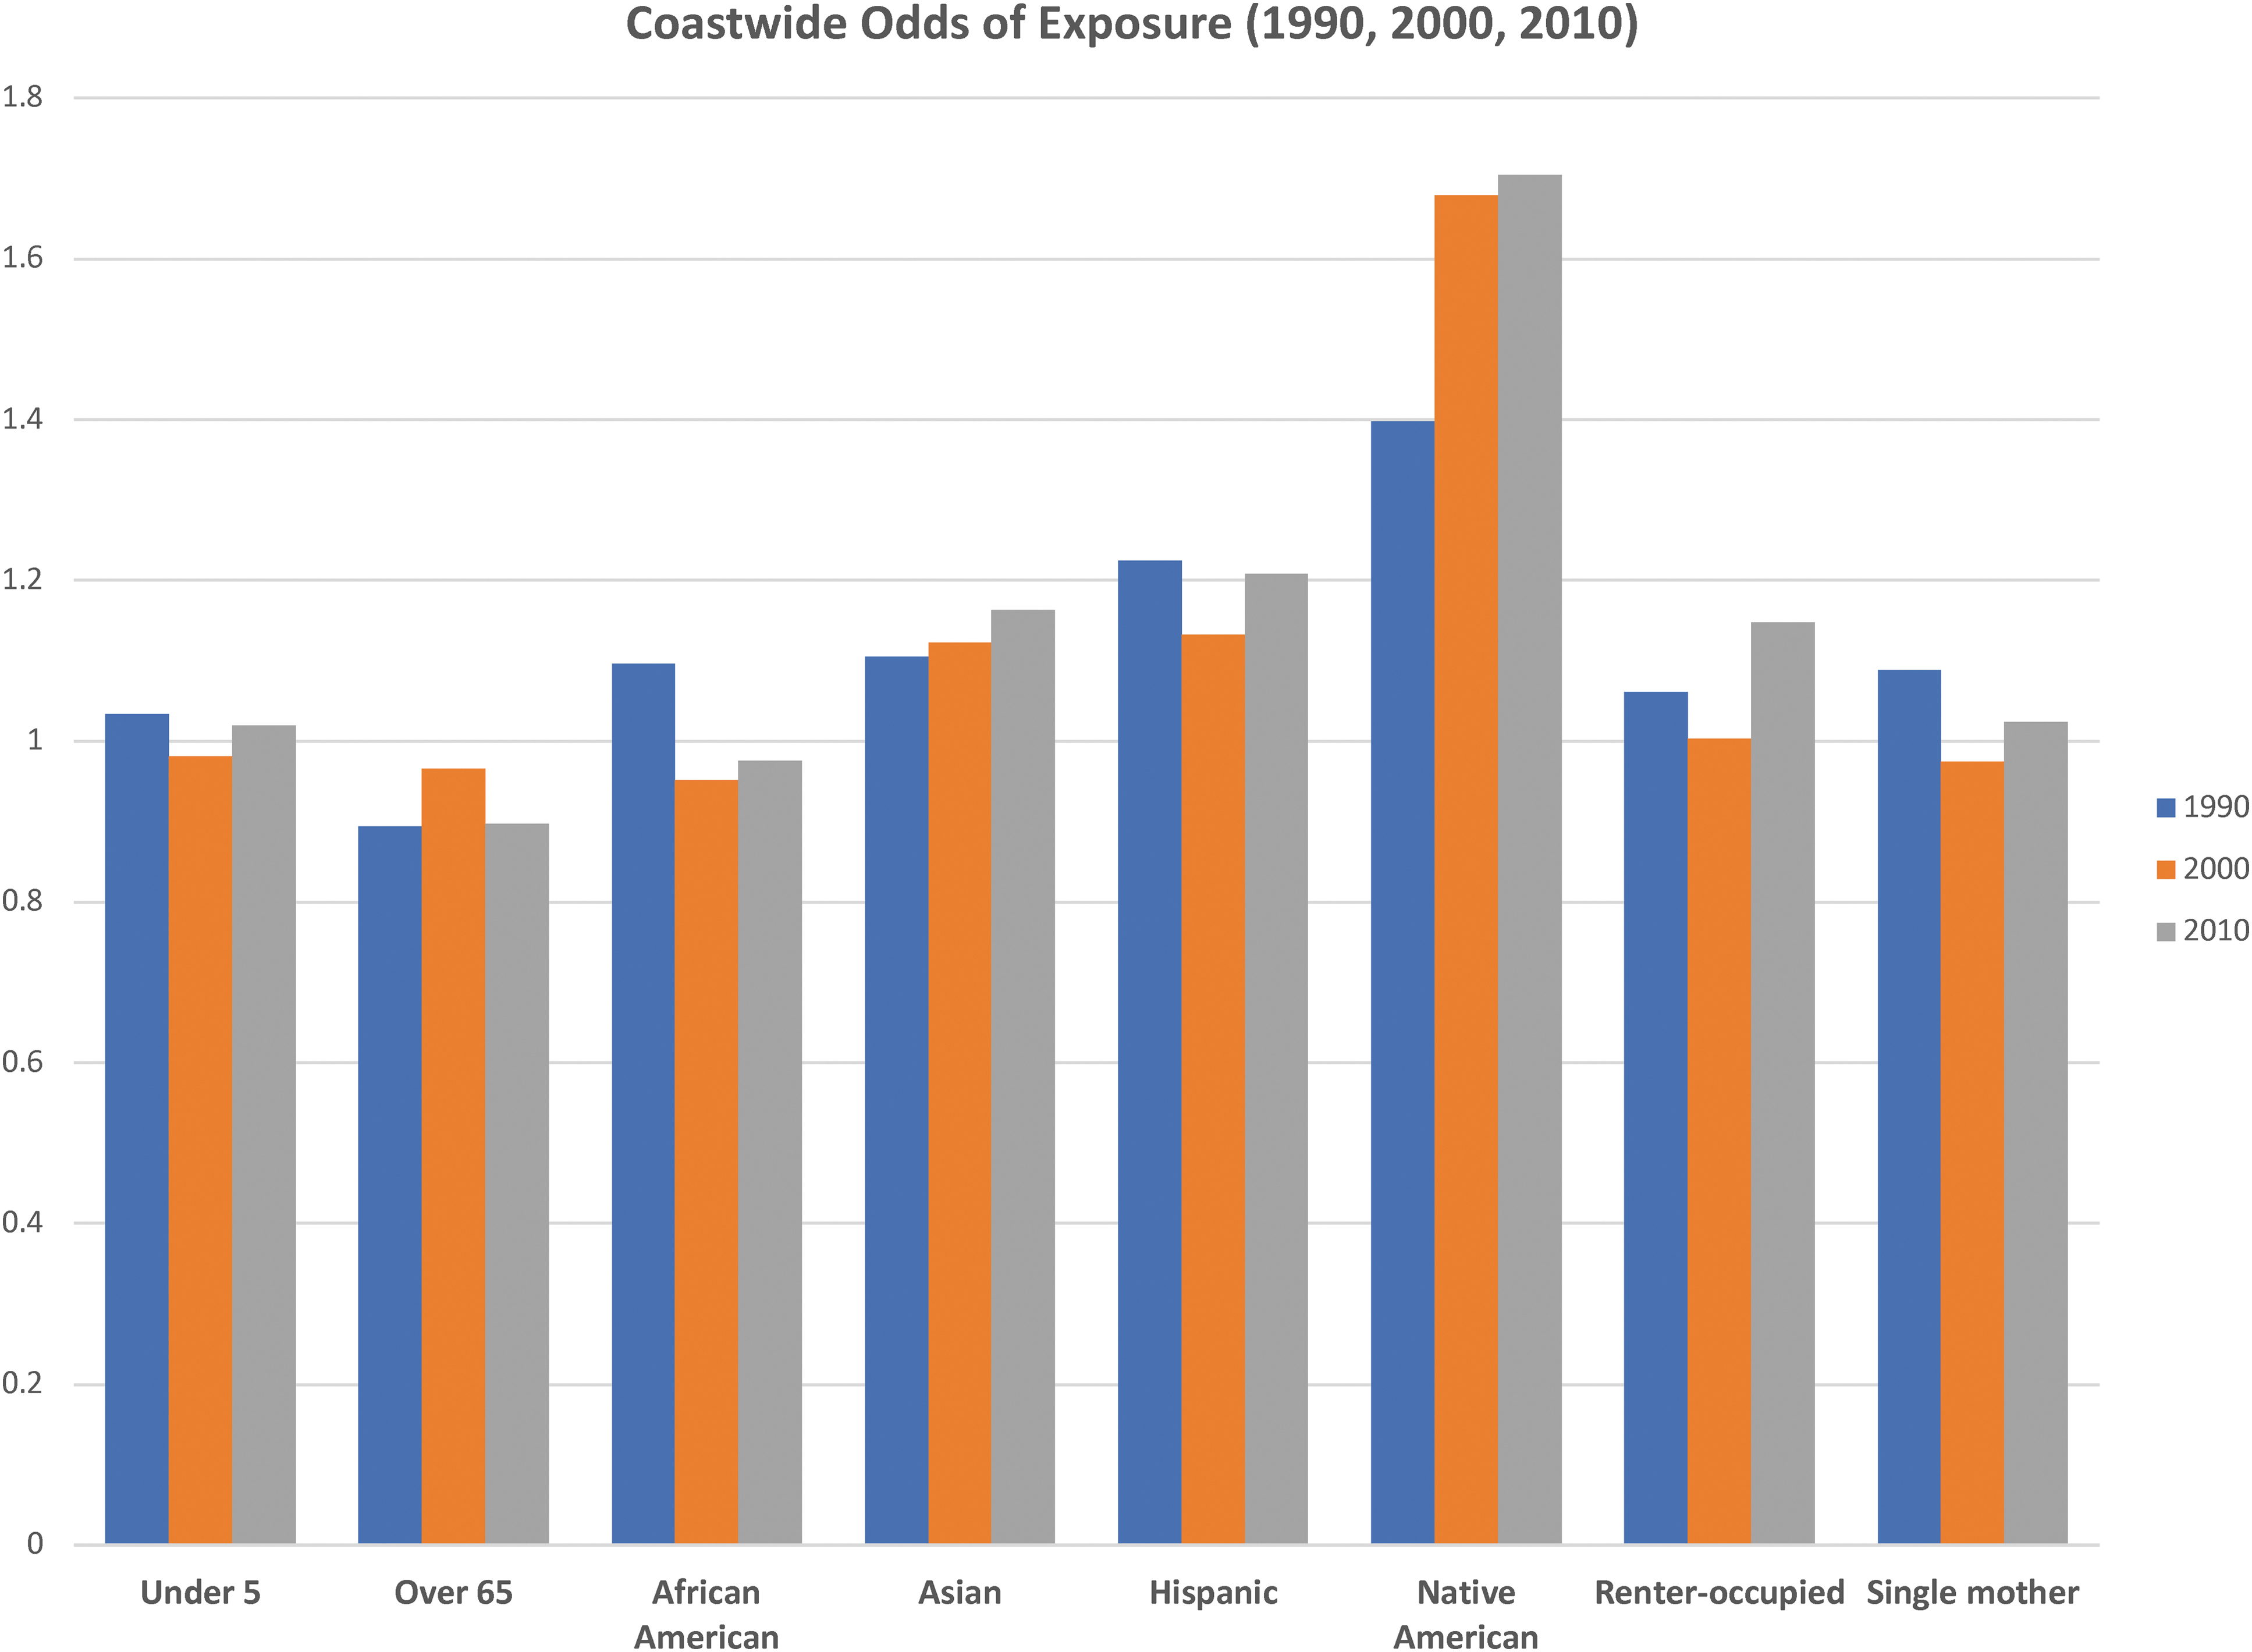
Coastwide odds of exposure (1990, 2000, 2010).
Coast-wide Odds of Exposure and Confidence Intervals (1990, 2000, 2010)
Risk factor indicates that the population was disproportionately exposed. Degree of disproportionate exposure was determined by the confidence interval for the odds ratio.
Total population size for renter occupation and single mother are based on total count of households.
Indicates significance at a 95% confidence interval.
By 2000, after the tremendous expansion of the offshore oil and gas industry in the 1990s, the overall pattern of exposure remained very similar to what was observed in 1990, with the notable exception that the African American was no longer found to be disproportionately impacted. This is very likely because much of the industrial expansion required to support the offshore industry occurred in the coastal shoreline parishes and within the coastal fringe of the state. As in 1990, the Native American population had the greatest risk of exposure, the odds of exposure are significantly higher, climbing from 1.40 to 1.68. The only other minority group that experienced an increase in the odds of exposure during the 1990s was the Asian population, as many Vietnamese and other Asian residents of coastal Louisiana work in fisheries and reside in smaller rural communities in the coastal fringes around Barataria Bay and Breton Sound in southeast Louisiana.
The continued expansion of oil and gas development in the 2000s increased the odds of exposure for all racial and ethnic minority groups examined in this research by 2010. As found in 2000, the only minority group that was less likely to be exposed to offshore oil- and gas-related infrastructure was the African American population, which was only 0.98 times as likely to reside in the most hazardous areas in the study. Note, however, that this represents an increase in risk from 2000, when the odds of exposure were 0.95, where a value of 1.00 represents the point at which the odds of residing in more hazardous or less hazardous areas of coastal Louisiana would be equal. Once again, the Native American population has the greatest odd of exposure, with a value of 1.70, followed by the Hispanic population at 1.21 and the Asian population at 1.16 times more likely to be exposed. While remaining significantly more likely to be exposed than not to oil- and gas-related hazards, the greatest fluctuations in odds of exposure has been with the Hispanic population, many of whom work in coastal Louisiana's shipbuilding and fabrication yards. 43 The odds of exposure for the Hispanic population declined from 1990 to 2000 and then increased between 2000 and 2010. The increased odds of exposure in 2010 is likely due to the influx of Hispanic workers who moved to Louisiana after Hurricane Katrina in 2005.
Other socially vulnerable groups have similar susceptibilities that could potentially impact their ability to respond to hazard events such as a lack of financial resources, special medical needs, and political disempowerment. At the coast-wide level, this research found that all socially vulnerable groups examined except for the elderly were disproportionately exposed at the time of the 1990 Census, though at levels significantly lower than those observed with race and ethnicity. By 2000, this situation had dramatically changed, with none of the socially vulnerable population groups found to be disproportionately impacted. This situation would become reversed again in 2010. After the shift to OCS production during the 2000s, the results from 2010 mirror those seen in 1990, with all socially vulnerable groups except for the elderly disproportionately exposed. In 2010, the most exposed areas in the state contain a preponderance of renter-occupied housing, which is 1.15 times more likely to be exposed to oil- and gas-related hazards.
DISCUSSION
Previous research on the impacts of offshore oil and gas in coastal Louisiana found that geography and competition for limited space is a driving force behind many of the environmental inequities experienced today. 44 This current assessment builds off this earlier research and analyzes the historical development of these environmental inequities. Of all the decades explored in this study, the 1980s were found to have the most dispersed hazards surface. This decade represented a lynchpin in the history of oil and gas in Louisiana, after which deepwater drilling activity in the Gulf of Mexico spiked. This shift in focus to the OCS resulted in a restructuring of the state's industrial geography and a concentration of new growth and hazards in the coastal zone. Before 1990, the dispersed hazards surface exposed a broader swath of the population to those hazards, although at lower overall levels. 45
As offshore oil- and gas-related hazards became concentrated in the coastal zone, racial and ethnic minority groups with historical, cultural, and economic ties to the coast saw a spike in potential exposure. Asian, Hispanic, and Native American populations in coastal Louisiana have been exposed to more potential risk, resulting from oil and gas infrastructure development across all three periods of this study. Further, the Asian and Native American populations have shown a consistent upward trajectory in potential exposure to oil- and gas-related hazards from 1990 to 2010. This is highly indicative of a situation where coastal populations with a history of natural resource dependence are forced to compete with industry for limited land. Other socially vulnerable groups without such historical ties were not found to experience the same levels of exposure. This suggests a level of cohesiveness in resource-dependent and minority communities that is not present in some other socially vulnerable populations. For planners and decision makers tasked with assessing the social impacts of their actions, this represents an important point to acknowledge.
CONCLUSIONS
Minority communities in Louisiana have long been at the forefront of the struggle to achieve environmental justice. Much of this struggle has focused on communities located in the Mississippi River Chemical Corridor where rural African American communities have historically been disproportionately impacted by the growth of the petrochemical industry. However, this research shows that many small coastal communities have been similarly impacted by the development of the offshore oil and gas industry. The majority of the development associated with offshore production has occurred along Louisiana's coastal fringe, from an increase in the number of shipbuilding facilities to the construction of new natural gas processing plants. The development of these industries from 1980 through 2010 has tended to disproportionately impact the state's minority populations who reside in small communities throughout Louisiana's coastal zone. This includes the state's Native American and Asian populations, groups that have historically been dependent on the region's abundant fisheries. These patterns are consistent with other research on coastal risks and hazards, which found a clear distinction between the exposure of urban and rural populations. 46
When examined over time, distinct differences in rural exposure become apparent. Before expansion into the deepwater Gulf of Mexico in the 1990s, onshore and nearshore oil and gas development, though on the decline, were still dominant parts of the coastal hazardscape. As a result, inland residents were more likely to be exposed to the impacts of development. However, as production moved offshore, industrial growth and development similarly shifted closer to the Gulf of Mexico, bringing development into close contact with coastal resource-dependent communities. This research confirms that inland communities were more likely to be exposed to potential hazards in 1990 than they were in both 2000 and 2010. These results do not suggest that there has been a decrease in overall exposure for any groups throughout the study period. Rather, levels of relative exposure have shifted over time and these shifts have disproportionately impacted certain racial and ethnic minority groups more than others. Whether intentional or not, when socially vulnerable populations, racial or otherwise, are disproportionately impacted by environmental policies and decisions, this represents, by definition, an environmental injustice.
Footnotes
AUTHOR DISCLOSURE STATEMENT
No competing financial interests exist.
FUNDING INFORMATION
Funding by the United States Department of the Interior, Bureau of Ocean Energy Management under cooperative agreement number M16AC00022.