
Abstract
Dam operations are known to have significant impacts on reservoir hydrodynamics and solute transport processes. The Gardiner Dam, one of the structures that forms the Lake Diefenbaker reservoir located in the Canadian Prairies, is managed for hydropower generation and agricultural irrigation and is known to have widely altering temperature regimes and nutrient circulations. This study applies the hydrodynamic and nutrient CE-QUAL-W2 model to explore how various withdrawal depths (5, 15, 25, 35, 45, and 55 m) influence the concentrations and distribution of nutrients, temperature, and dissolved oxygen (DO) within the Lake Diefenbaker reservoir. As expected, the highest dissolved nutrient (phosphate,
Introduction
Hydropower dams are typically built to produce electricity, and in some cases, they can serve as flood protection and provide water for irrigation and municipal needs. In addition, reservoirs may provide recreational activity opportunities. Despite these benefits, reservoir operation changes thermal regimes and nutrient transport affecting the biogeochemical cycling and the movement and fitness of biota (McKinley et al., 1998; Fjeldstad et al., 2012; Huang and Wang, 2018).
Some studies have examined the impacts of selective withdrawal on in-reservoir hydrodynamics and thermal structure (Gelda and Steven, 2007; Rheinheimer et al., 2014; Weber et al., 2017; Zheng et al., 2017). Using a three-dimensional hydrodynamic model, Çalişkan and Elçi (2009) simulated the effects of selective water withdrawal on the hydrodynamics of the Tahtali reservoir, Turkey. They found that water withdrawal at the bottom outlet was the most effective choice to reduce anoxia by triggering mixing throughout the water column. Similarly, Casamitjana et al. (2003) analyzed the effects of water withdrawal scenarios on the thermal structure in the Boadella Reservoir, Spain, using a one-dimensional hydrodynamic model. They found that the thermocline location within the thermal structure coincides with the depth of the outlet.
Ma et al. (2008) used a two-dimensional (2D) hydrodynamic model to investigate changes of the thermal structure of underwater withdrawal scenarios in the Kouris Dam reservoir, Cyprus. They found that deep-water withdrawals enhance water column mixing by deepening the epilimnion and that the withdrawal scenarios can be implemented to manage water quality strategies. Although water withdrawal affects reservoir hydrodynamics and thermal structure, very little has been investigated on the effects of in-reservoir dissolved oxygen (DO) and the transport and distribution of nutrients.
In this study, we focus on Lake Diefenbaker, a large multipurpose reservoir located in the Canadian Prairies that has been in operation since 1968 after the Gardiner Dam, one of the structures that forms Lake Diefenbaker, was built. As expected with the building of Gardiner Dam, the upstream reach shifted from fluvial to a combination of lacustrine and fluvial environments and the pattern and rates of sediment deposition, resuspension, bluff erosion, and shoreline retreat were significantly changed in the reservoir (Ashmore and Day, 1988; Sadeghian et al., 2017). The draw-down reach, the section where conditions change from river to reservoir characteristics, generally has a bed elevation ranging between 556.87 meters above sea level (masl) maximum and 545.59 masl minimum water levels and therefore deposition in this reach affects the live storage capacity (Sadeghian et al., 2017). In the reservoir section, the bed elevations are below the minimum operating water level and therefore affect dead storage capacity (Sadeghian et al., 2017).
The reservoir acts as a significant phosphorus (P) sink, retaining 91% of external total phosphorus (TP) and 41% of dissolved reactive phosphorus (North et al., 2015; Morales-Marín et al., 2017). Lake Diefenbaker is thermally stratified, mixing once in the spring and once in the fall with a period of summer stratification (Phillips et al., 2015). When the hypolimnion is isolated from the atmosphere during summer stratification, the bottom waters can become hypoxic resulting in significant Fe-associated P release (Doig et al., 2017) and this internal loading can affect water quality of reservoirs (Nürnberg, 2009). Despite known P release from Diefenbaker sediments year round (North et al., 2015; Doig et al., 2017), it is not considered a significant source of P to the reservoir in stratified regions such as at the dam outflow (North et al., 2015). Although these studies provide insight into impacts because of the creation of the reservoir, little is known about the impacts of current dam operations on the chemical and nutrient characteristics of Lake Diefenbaker.
Separating dam-related impacts from other anthropogenic sources such as urbanization and agriculture and sufficient high-quality data collection to increase statistical power remain as shortcomings of models that seek to predict dam-related ecosystem shifts (Nguyen et al., 2018). Accordingly, models remain a valuable tool for investigating dam impacts on both reservoir and downstream water quality and temperature (Park et al., 2014; Zouabi-Aloui et al., 2015; Saadatpour et al., 2017). In this research study, the 2D hydrodynamic water quality CE-QUAL-W2 (Cole and Wells, 2008) model has been implemented to provide insights on the impacts of various withdrawal elevations on the in-reservoir nutrient and water chemistry characteristics of Lake Diefenbaker. The effects on the downstream water bodies and ecosystems (McKinley et al., 1998; Fjeldstad et al., 2012; Huang and Wang, 2018), because of changes in the temperature, DO, and nutrient concentration of the released water, are analyzed in the Discussion section.
Methods
Study area
Lake Diefenbaker is a large multipurpose reservoir located in the Canadian Prairies (Fig. 1) that went into operation in 1967 to produce hydropower (1,000 GWh annually). The reservoir was formed after the construction of Gardiner and Qu‘Appelle dams located on the left and right arms of the reservoir, respectively. The reservoir is 225 km long and has a surface area of 394 km2, allowing 9.8 km3 of water to be stored. The reservoir is located along the South Saskatchewan River (SSR), with 95% of the reservoir inflows coming from the SSR and 5% from Swift Current Creek and other small tributaries. The reservoir not only regulates the SSR streamflows, but is also a sink for sediment and nutrients exported and transported from the SSR catchment.
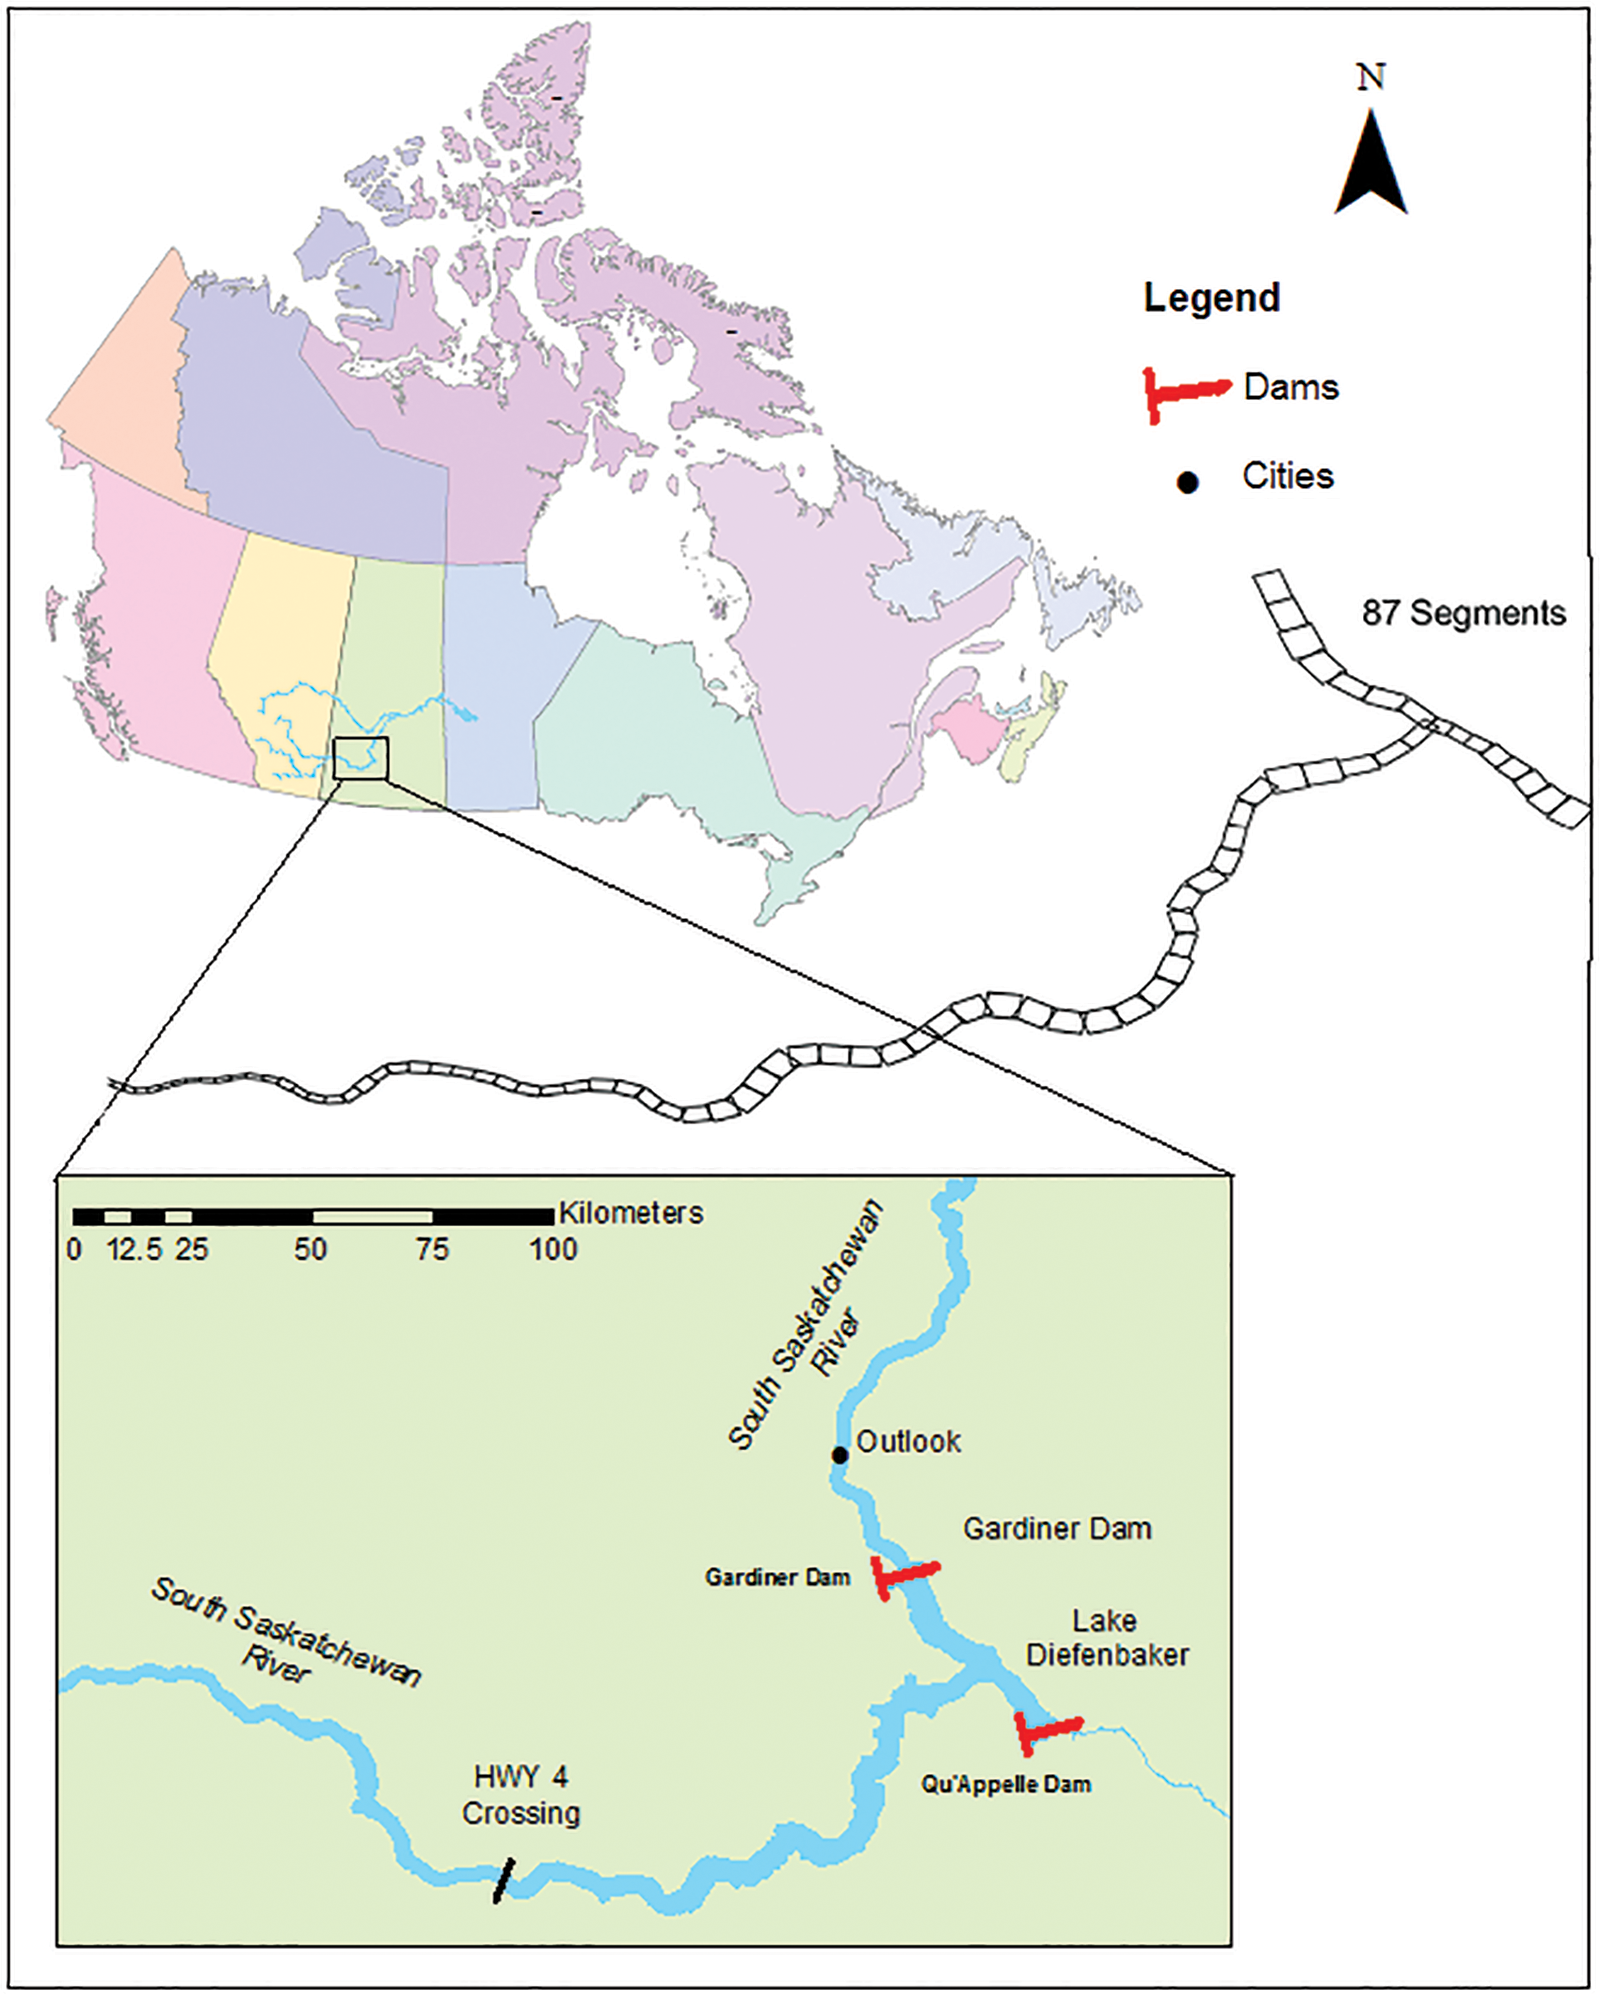
Lake Diefenbaker Reservoir enclosed by the Gardiner and Qu'Appelle Dams. The inflowing South Saskatchewan River and outflowing Lower South Saskatchewan and Qu'Appelle Rivers are included. The CE-QUAL-W2 model boundaries run from the upstream boundary shown in the map down to and including the reach closed by the Qu'Appelle and Gardiner dams.
The reservoir also provides water for agricultural irrigation and domestic and industrial uses, and significant downstream flood protection. Since its construction, the reservoir has also been used for aquaculture and recreational activities, and serves as habitat for many aquatic animals and birds (WSA, 2012). This study focuses on the entire length of Lake Diefenbaker extending from the upstream model boundary conditions downstream to the Gardiner Dam (Fig. 1).
Model description
Based on the complex geometry of the reservoir, duration of the desired study period, and the level of details required for the study, we chose CE-QUAl-W2 (Cole and Hannan, 1990) version 4.0 as a suitable model for this reservoir. The CE-QUAL-W2 model is a laterally averaged water quality model developed by the Environmental Protection Agency for comprehensive 2D water quality studies (Cole and Wells, 2008). The model solves momentum and transport equations in Cartesian coordinates, and supports variable horizontal segmentation and vertical layering. Input data including meteorological data (air temperature, dew point temperature, wind speed and direction, precipitation, solar radiation, and cloud cover), flow (inflow, outflow, and nonpoint source flows), water temperature, algae, nutrient (carbon, nitrogen, and phosphorous component), and water quality variables (DO, pH, and alkalinity) can be imported to the model at any temporal resolution. The model has a long (>40 years) development history with many applications all over the world including Canada (Sadeghian et al., 2015; Saadatpour et al., 2017).
CE-QUAL-W2 setup for this study was taken from an earlier study performed on Lake Diefenbaker (Sadeghian et al., 2015, 2018). The reservoir basin is discretized in 87 horizontal segments starting at Saskatchewan highway 4 at the upstream extending to the downstream Gardiner Dam and the Qu'Appelle Dam, and 1-m vertical layers with a maximum of 60 layers at the deepest point near the Gardiner Dam. Each segment of the reservoir model was also characterized by its horizontal orientation and bottom friction.
Model calibration
A Monte-Carlo analysis with 1,000 simulations was performed to evaluate model sensitivity to different parameters, followed by automatic optimization for model calibration. Calibration of the water temperature model was performed by minimizing the sum of squared error and the root mean square error (RMSE) based on simulated time series and observed profiles taken at 16 locations across the reservoir (Sadeghian et al., 2015). Acceptable model performance was obtained with RMSE <2°C with optimum values of 0.85 and 0.80 for wind sheltering coefficient and solar radiation shading coefficient, respectively.
In contrast to the calibration of the water temperature, for which a Monte-Carlo approach was implemented, the calibration of the water quality model was performed manually because of the extensive computational time. Sadeghian et al. (2018) calibrated the model for particulate organic carbon (POC), particulate organic nitrogen (PON), total nitrogen (TN), TP, total dissolved solids, phosphate (
Because of the small amount of reservoir main inlet and in-reservoir observations, the authors found that much smaller simulation errors are obtained when water samples are collected over more places and with higher frequencies, at least weekly/monthly time intervals, for chemistry analysis. Discrepancies were more pronounced, especially, for variables such as
Modeling scenarios
Six water withdrawal scenarios starting at 5 m from the reservoir's bed with 10-m intervals up to 55 m from the bed (5, 15, 25, 35, 45, and 55 m depths which, respectively, correspond to the 550, 540, 530, 520, 510, and 500 masl [geodetic elevations]) were used. Model simulations were performed from 2011 to 2013, which included an extreme flood event during this period, so that increases in flood surges were investigated with regard to dam operations (Fig. A1 in Supplementary Appendix). These flood events were caused by heavy rainfall and runoff at lower elevations exacerbated by rain-on-snow runoff from high elevations because of late lying snow packs. These floodwaters were also characterized by higher than usual turbidity because of debris flows that resulted in the movement of large amounts of sediment in the headwaters (Pomeroy and Shook, 2012).
Animations of contour plots were used to analyze simulated water temperature, DO, and nutrient concentration changes through 2011 and 2013. Specifically, we analyzed the following model output variables: water temperature, DO, TP, orthophosphate as P (
Results
Summer stratification
During summer there was a period of flooding in 2011 that occurred ∼1 month earlier than in 2013, before the lake was strongly stratified. In 2011, total nutrient concentration peaks occurred in the first half of June when the floodwaters entered the lake, although highest dissolved nutrient and lowest DO concentrations lagged a month behind. The 2013 peak influx of floodwaters entered the lake later than 2011 and an associated large increase in total nutrient aligned with the late June/early July peak of discharge. Similar to 2011, an associated increase in dissolved nutrients and decrease in DO lagged behind total nutrients, occurring end of July when high total nutrient (and likely suspended solids) concentrations were concentrated along the bottom, increasing DO demand when the lake was strongly stratified. The 2013 total nutrient concentrations and DO lows were greater than in 2011. Through June and July 2011, the surface became warmer and higher temperatures (Fig. 2) occurred at deeper layers for low withdrawal elevations in both 2011 and 2013. Despite this, outflow temperatures had ∼10°C difference between 500 and 550 masl outflows in both years. Temperatures were higher and occurred at deeper layers in 2011 than 2013 and greater regions of low bottom temperatures were maintained in 2013.
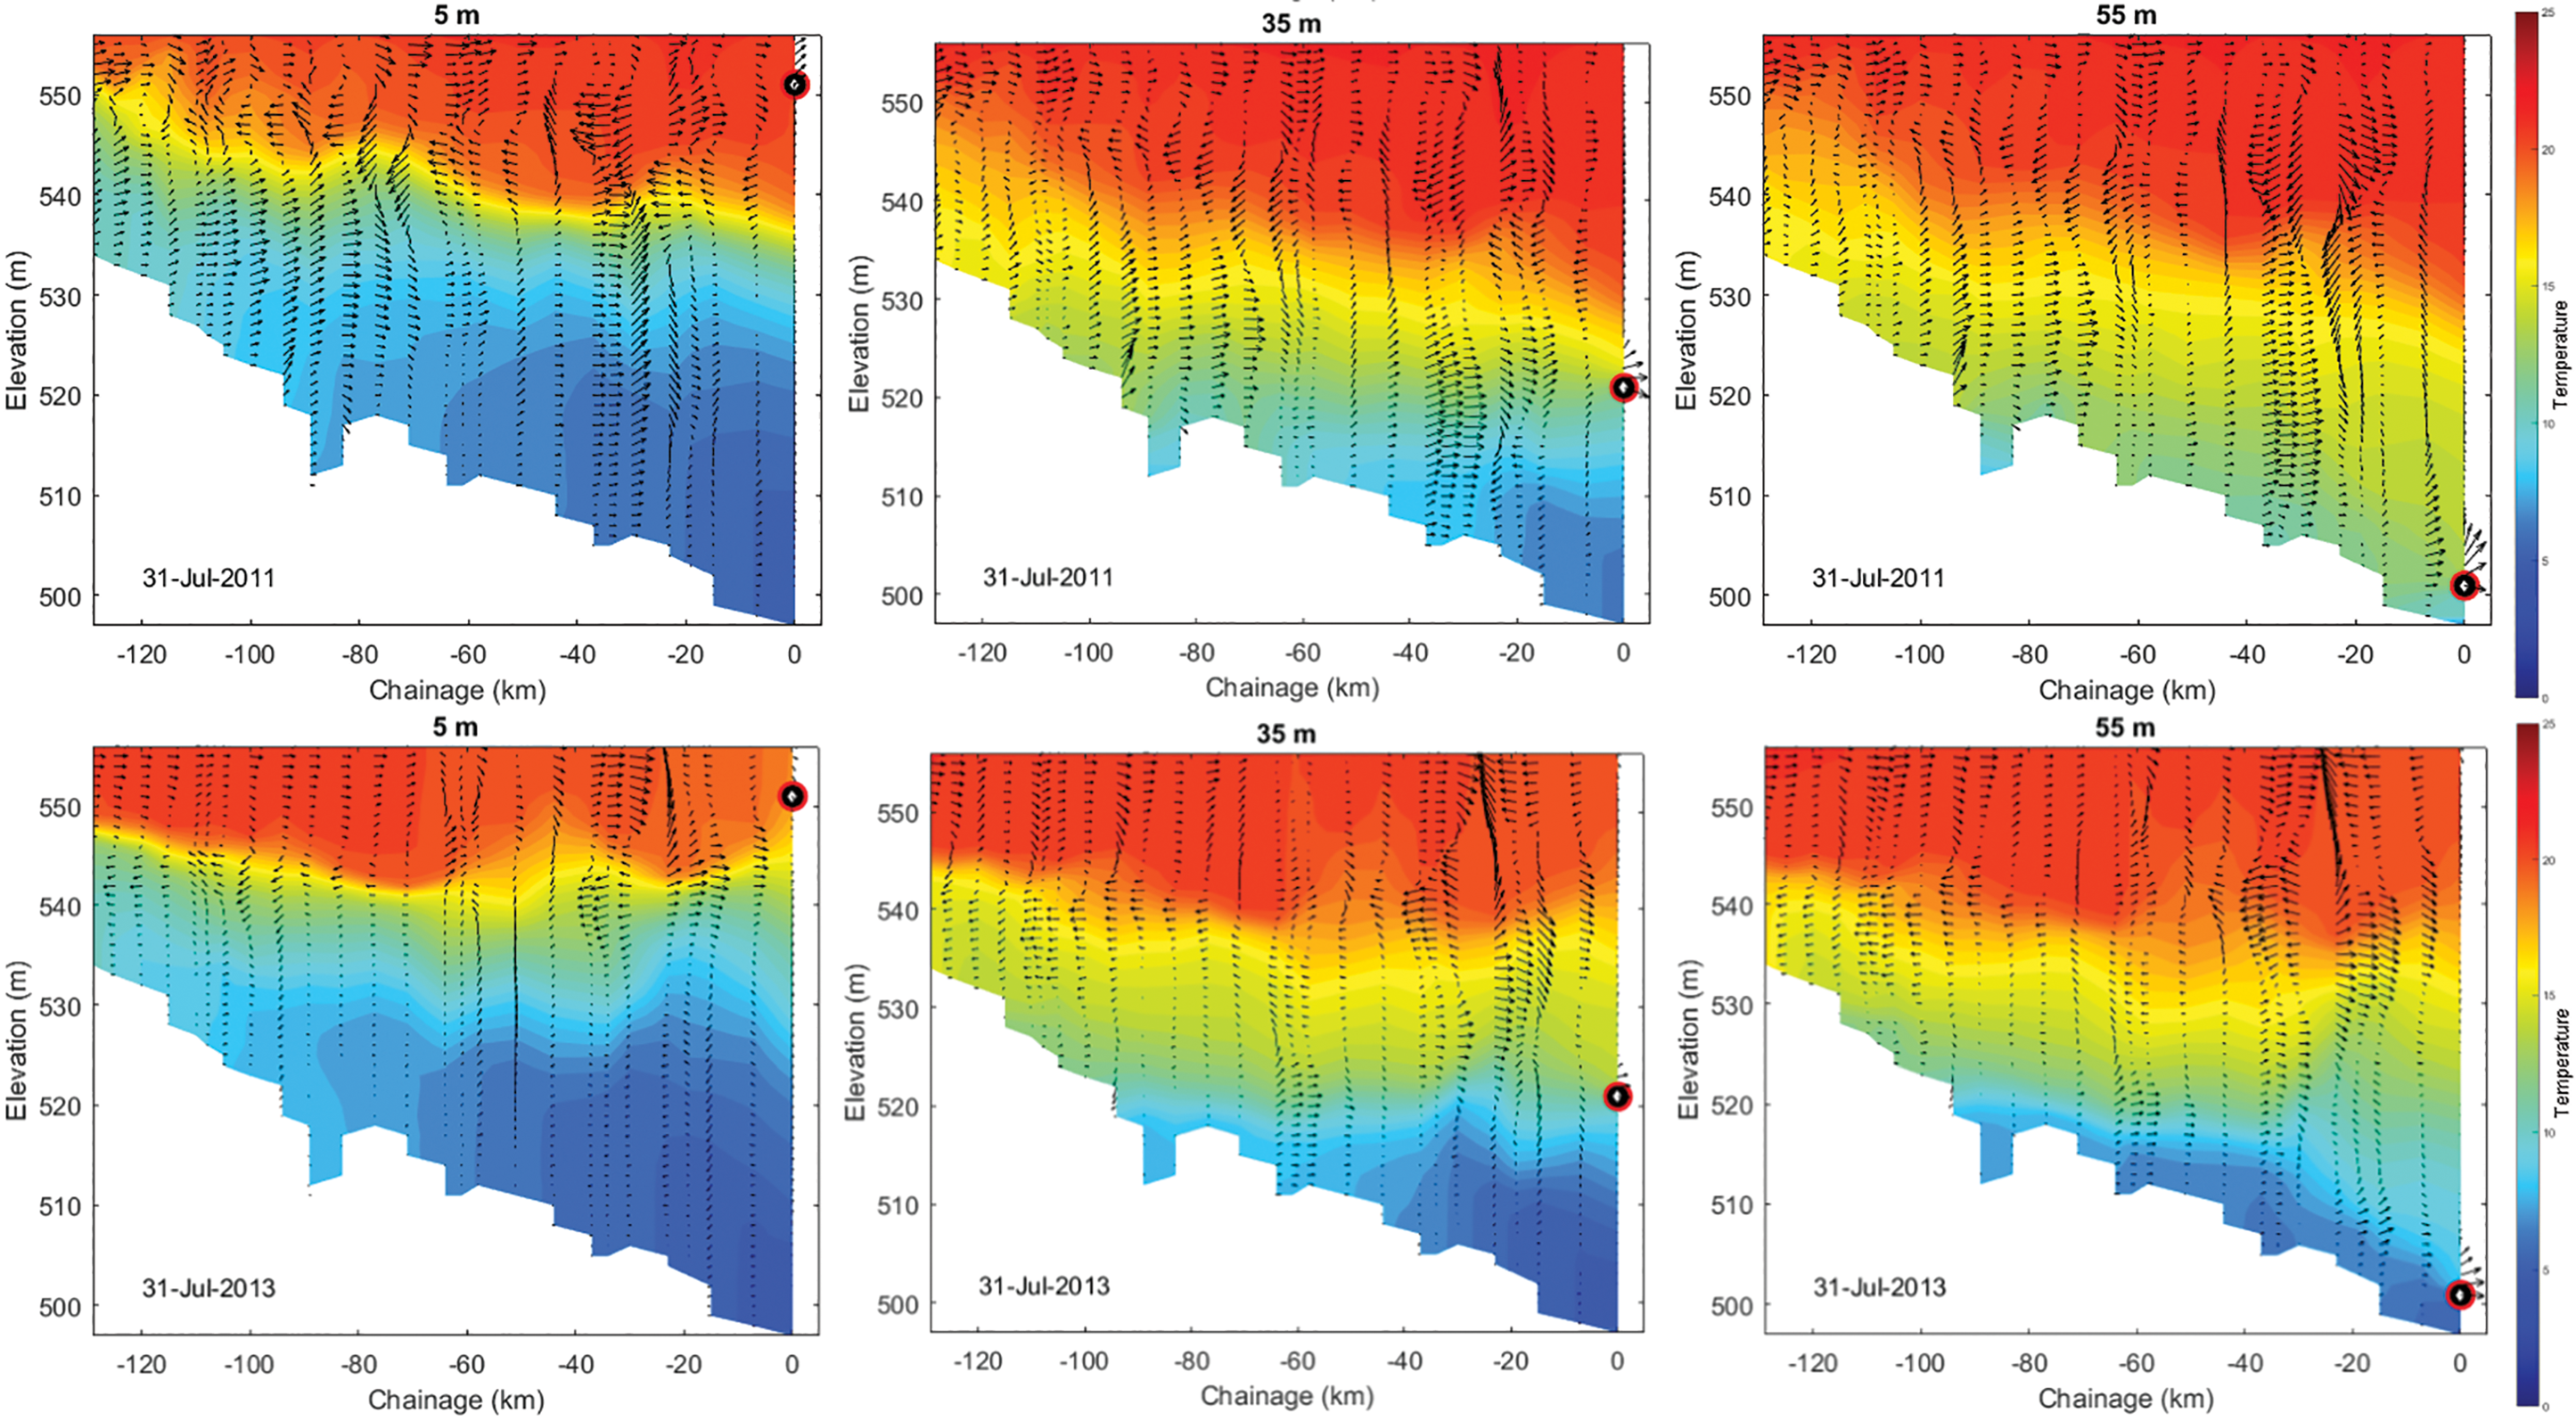
July 31, 2011 and 2013 temperature profiles for 5, 35, and 55 m outflows.
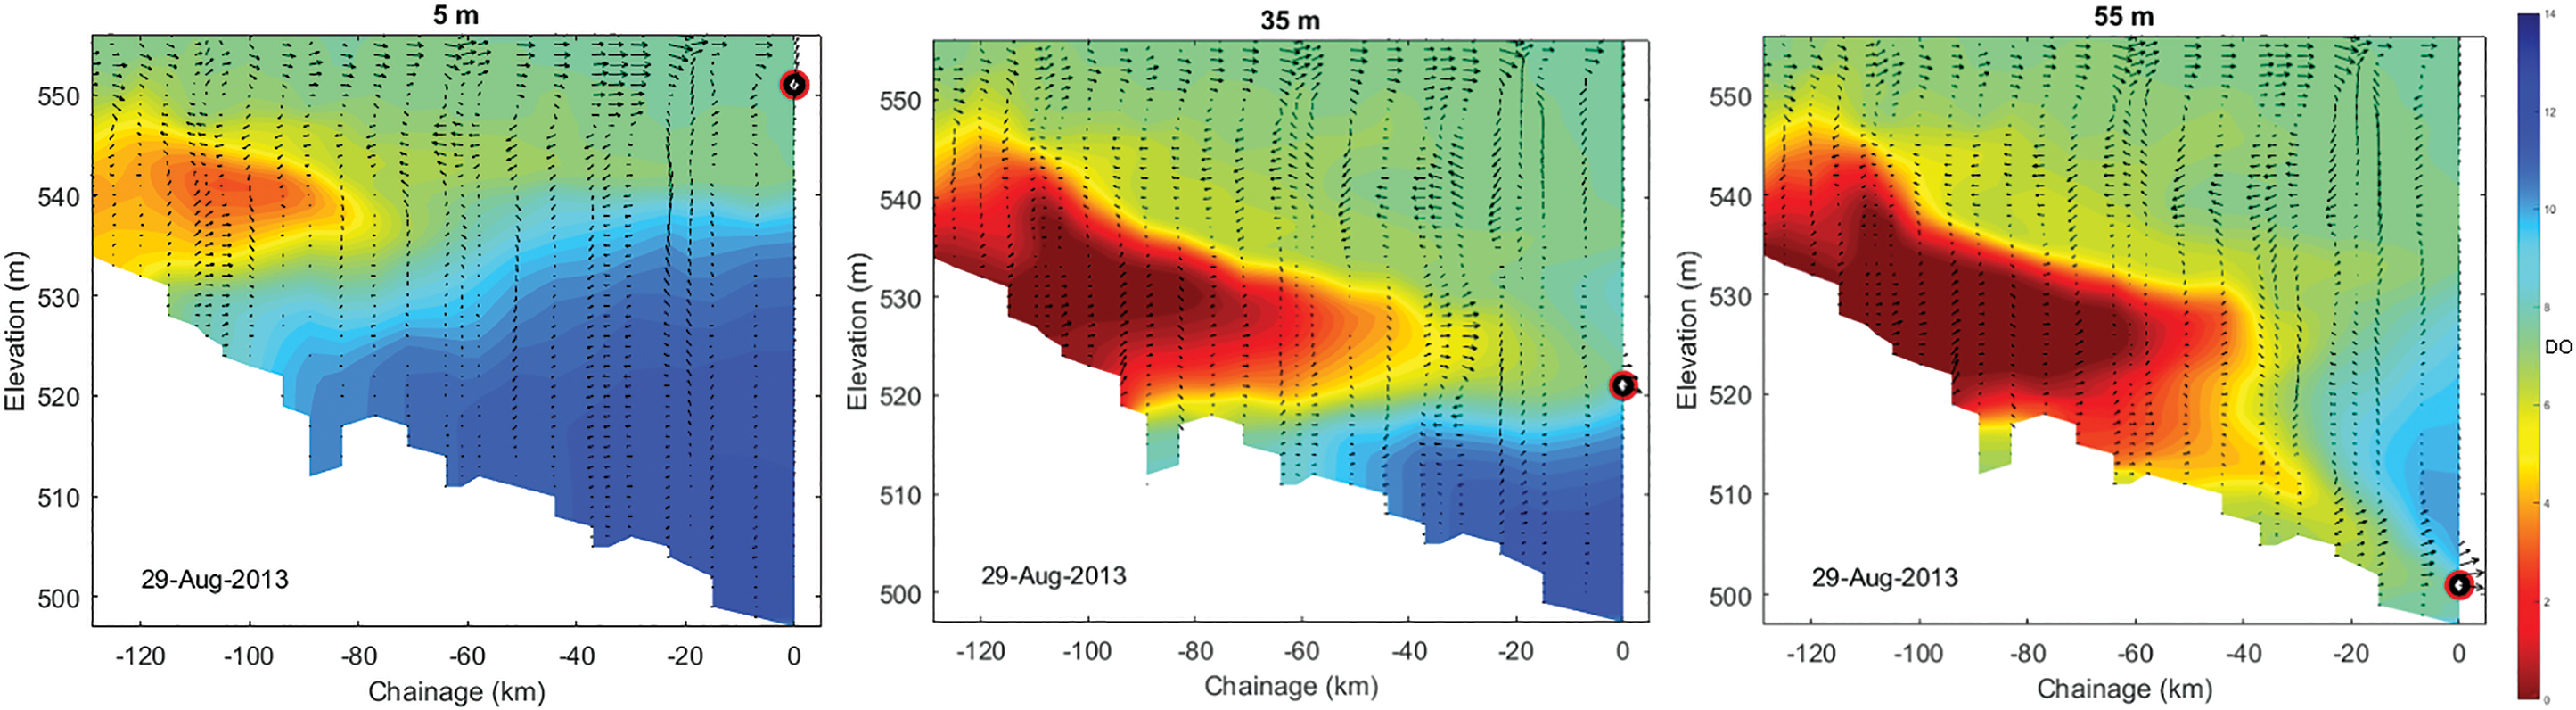
In contrast to water temperature, June and July 2011 DO concentrations (Fig. 3) dropped considerably along the bottom of the reservoir, particularly for lower withdrawal elevations that released water with slightly lower DO concentration (generally ∼1 mg/L lower). In contrast, the July 2013 lower withdrawal elevations typically released flow with higher DO concentrations (generally ∼2 mg/L higher). In both years, lower withdrawal elevations caused greater areas of low DO to spread within the reservoir. Lower outflow elevations were associated with greater decreases in reservoir DO concentrations but higher outflow concentrations (∼2 mg/L higher). In contrast to spring turnover (Fig. A3 in Supplementary Appendix), shallower 540 and 550 masl elevations provided the best balance of reservoir and outflow DO concentrations in both 2011 and 2013 (Fig. 3). Through June 2011, the lowest DO (Fig. A9 in Supplementary Appendix), and most of the highest TP (Fig. A10 in Supplementary Appendix) concentrations, moved across the epilimnion in the region with the highest flows. In both 2011 and 2013, a greater proportion of flow was diverted through the spillway. Through July, surface velocities decreased substantially as spillway diversions decreased and high TP (Fig. 4) and water with low DO concentrations began to move along the bottom of the reservoir rather than be routed along the surface.
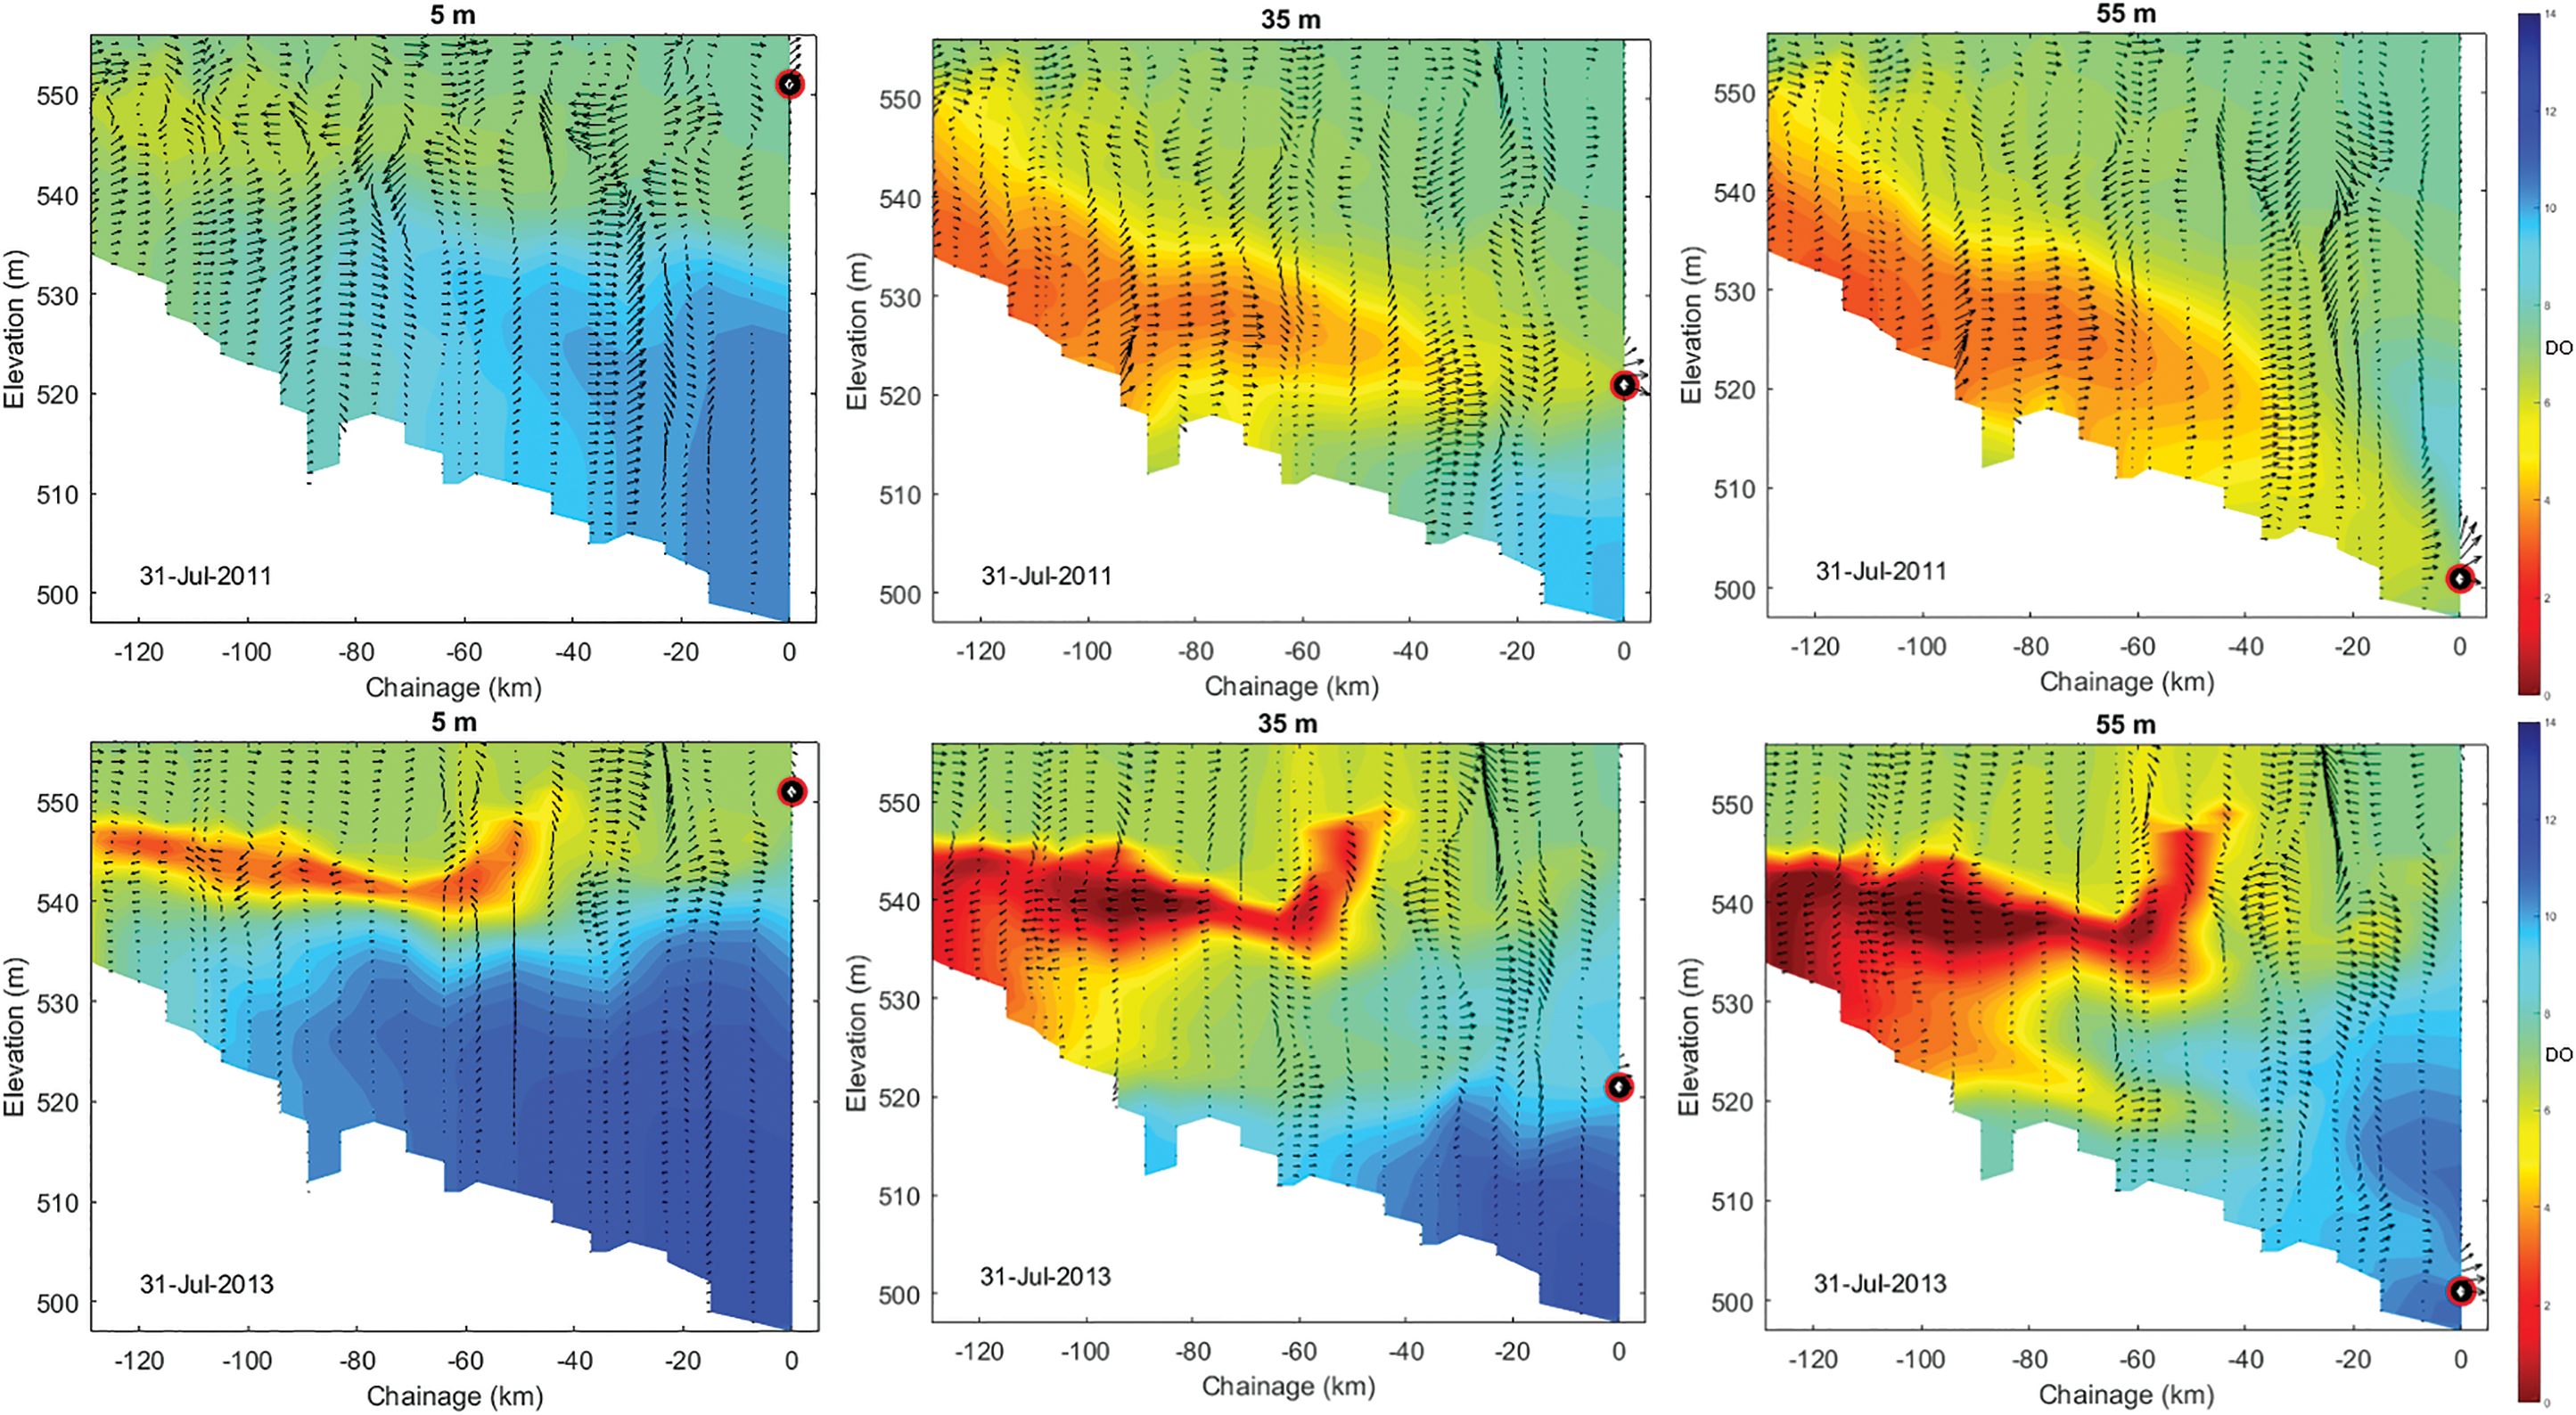
July 31, 2011 and 2013 DO profiles for 5, 35, and 55 m outflows. DO, dissolved oxygen.
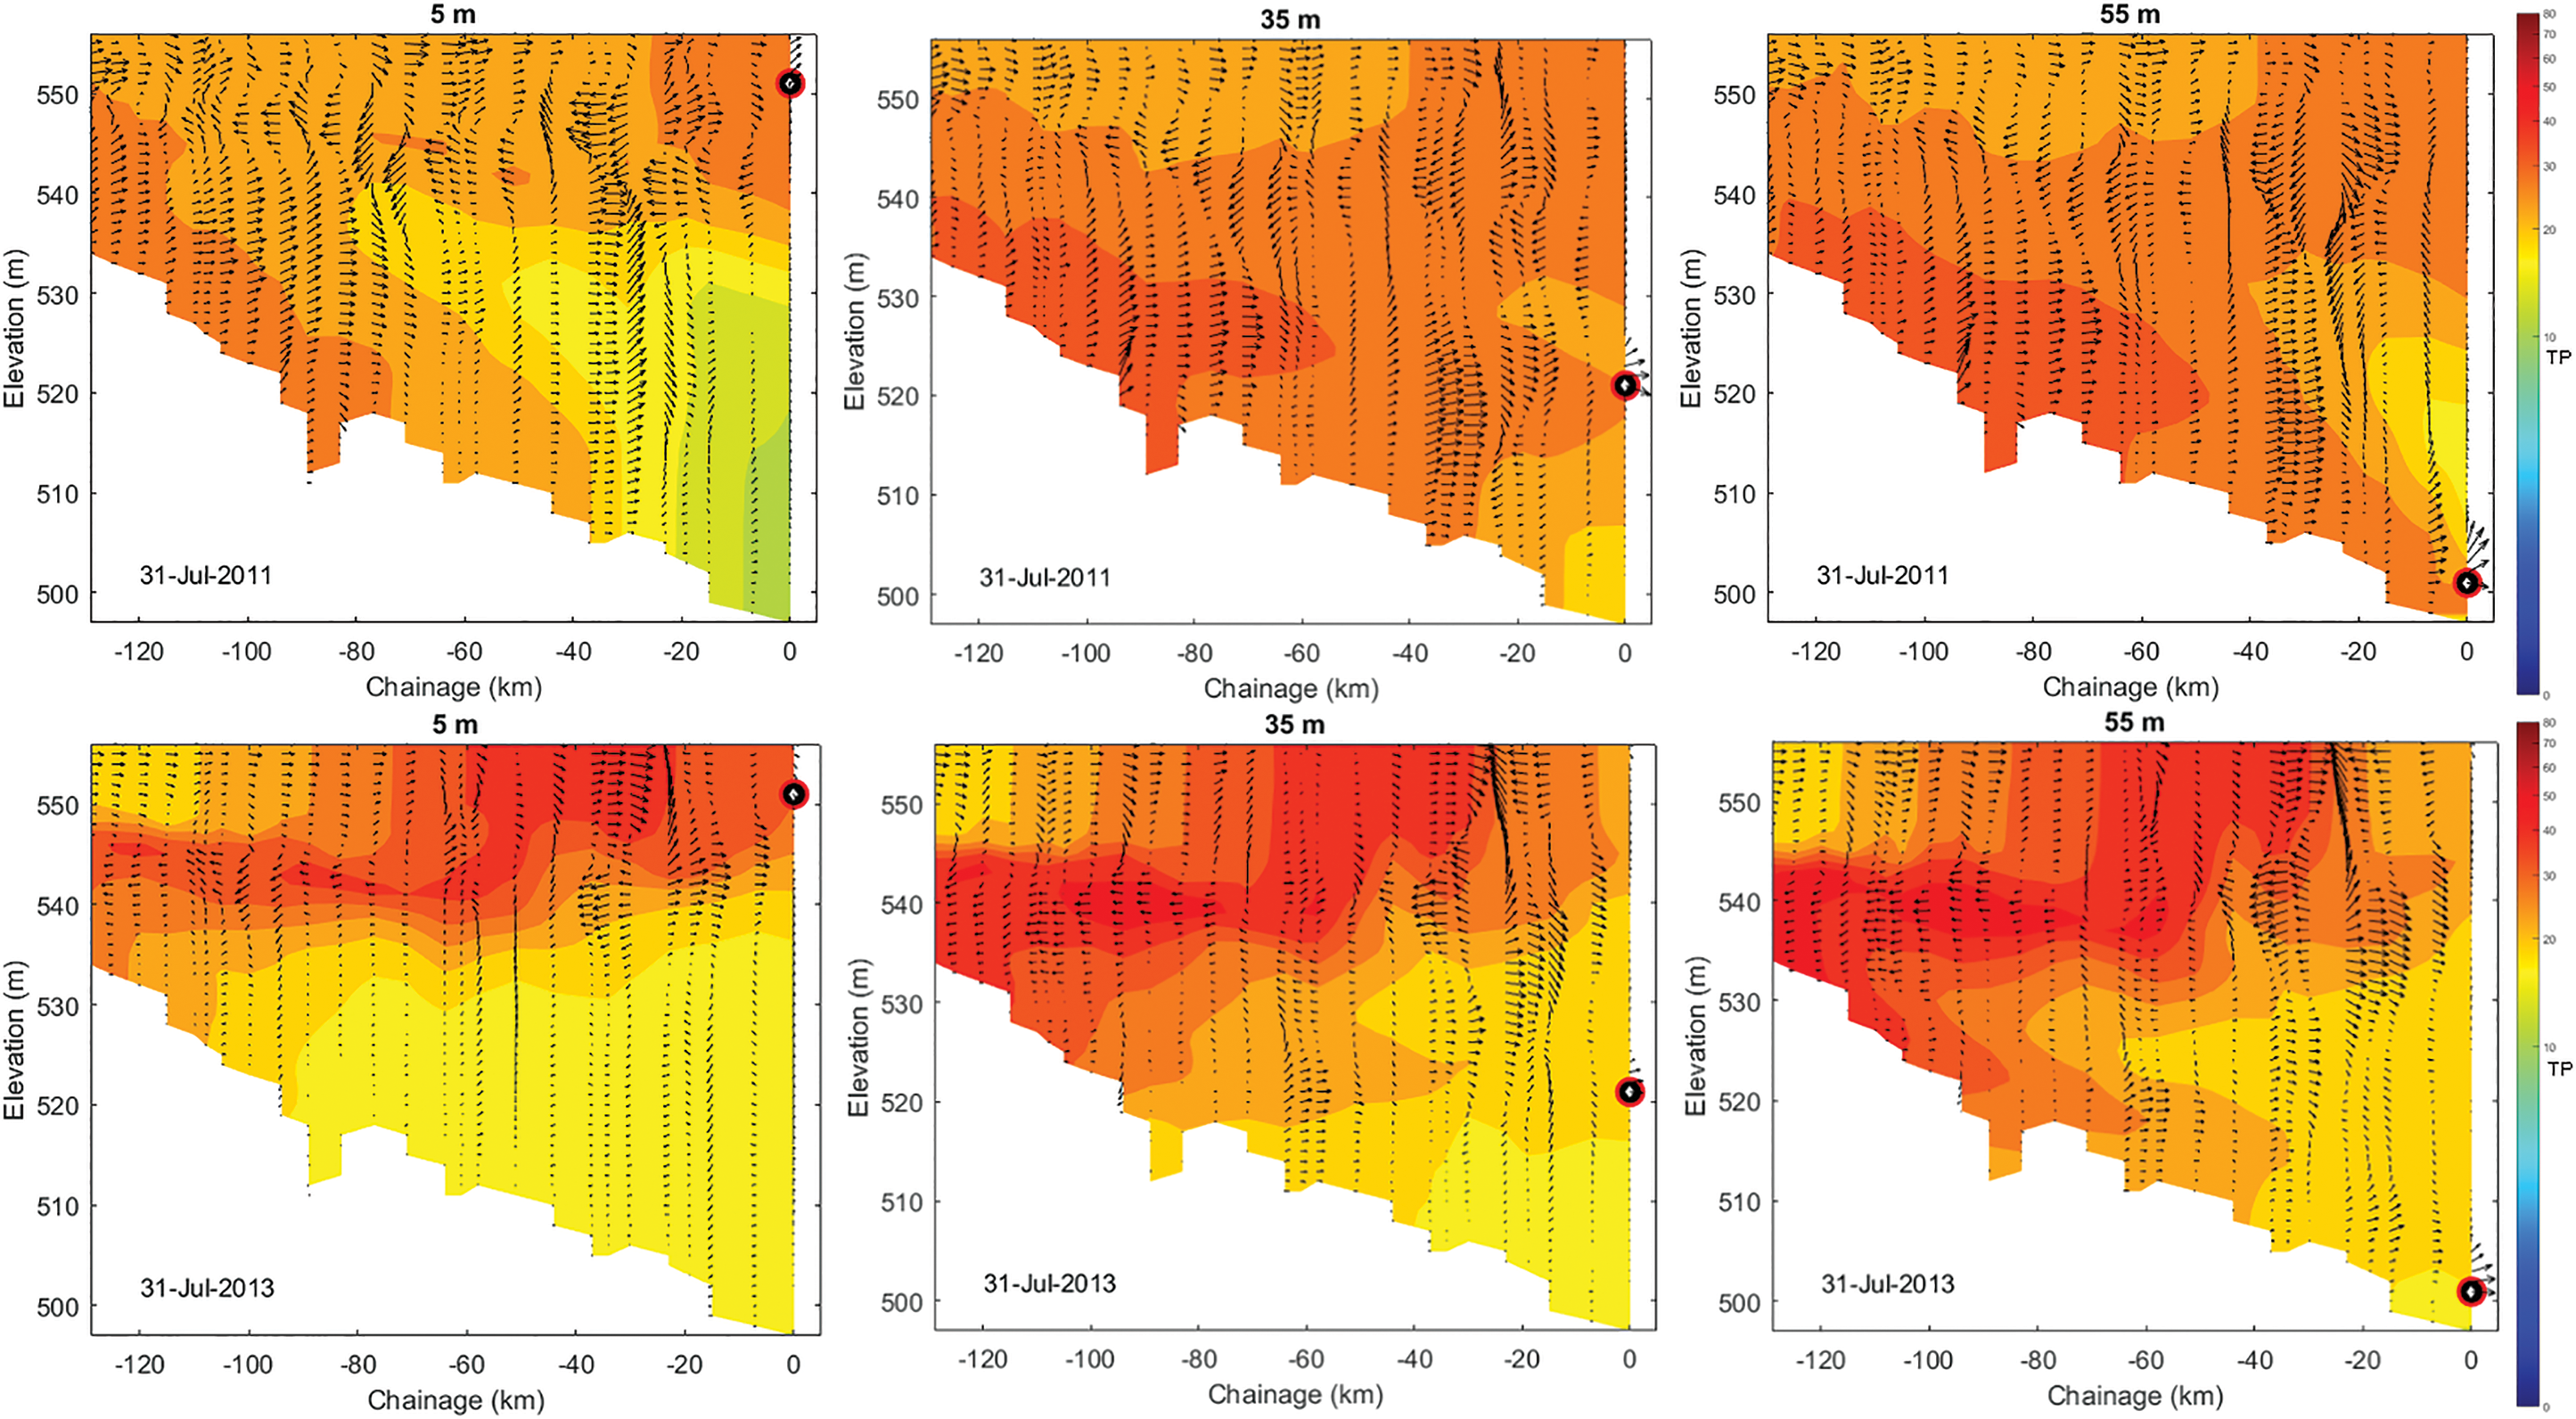
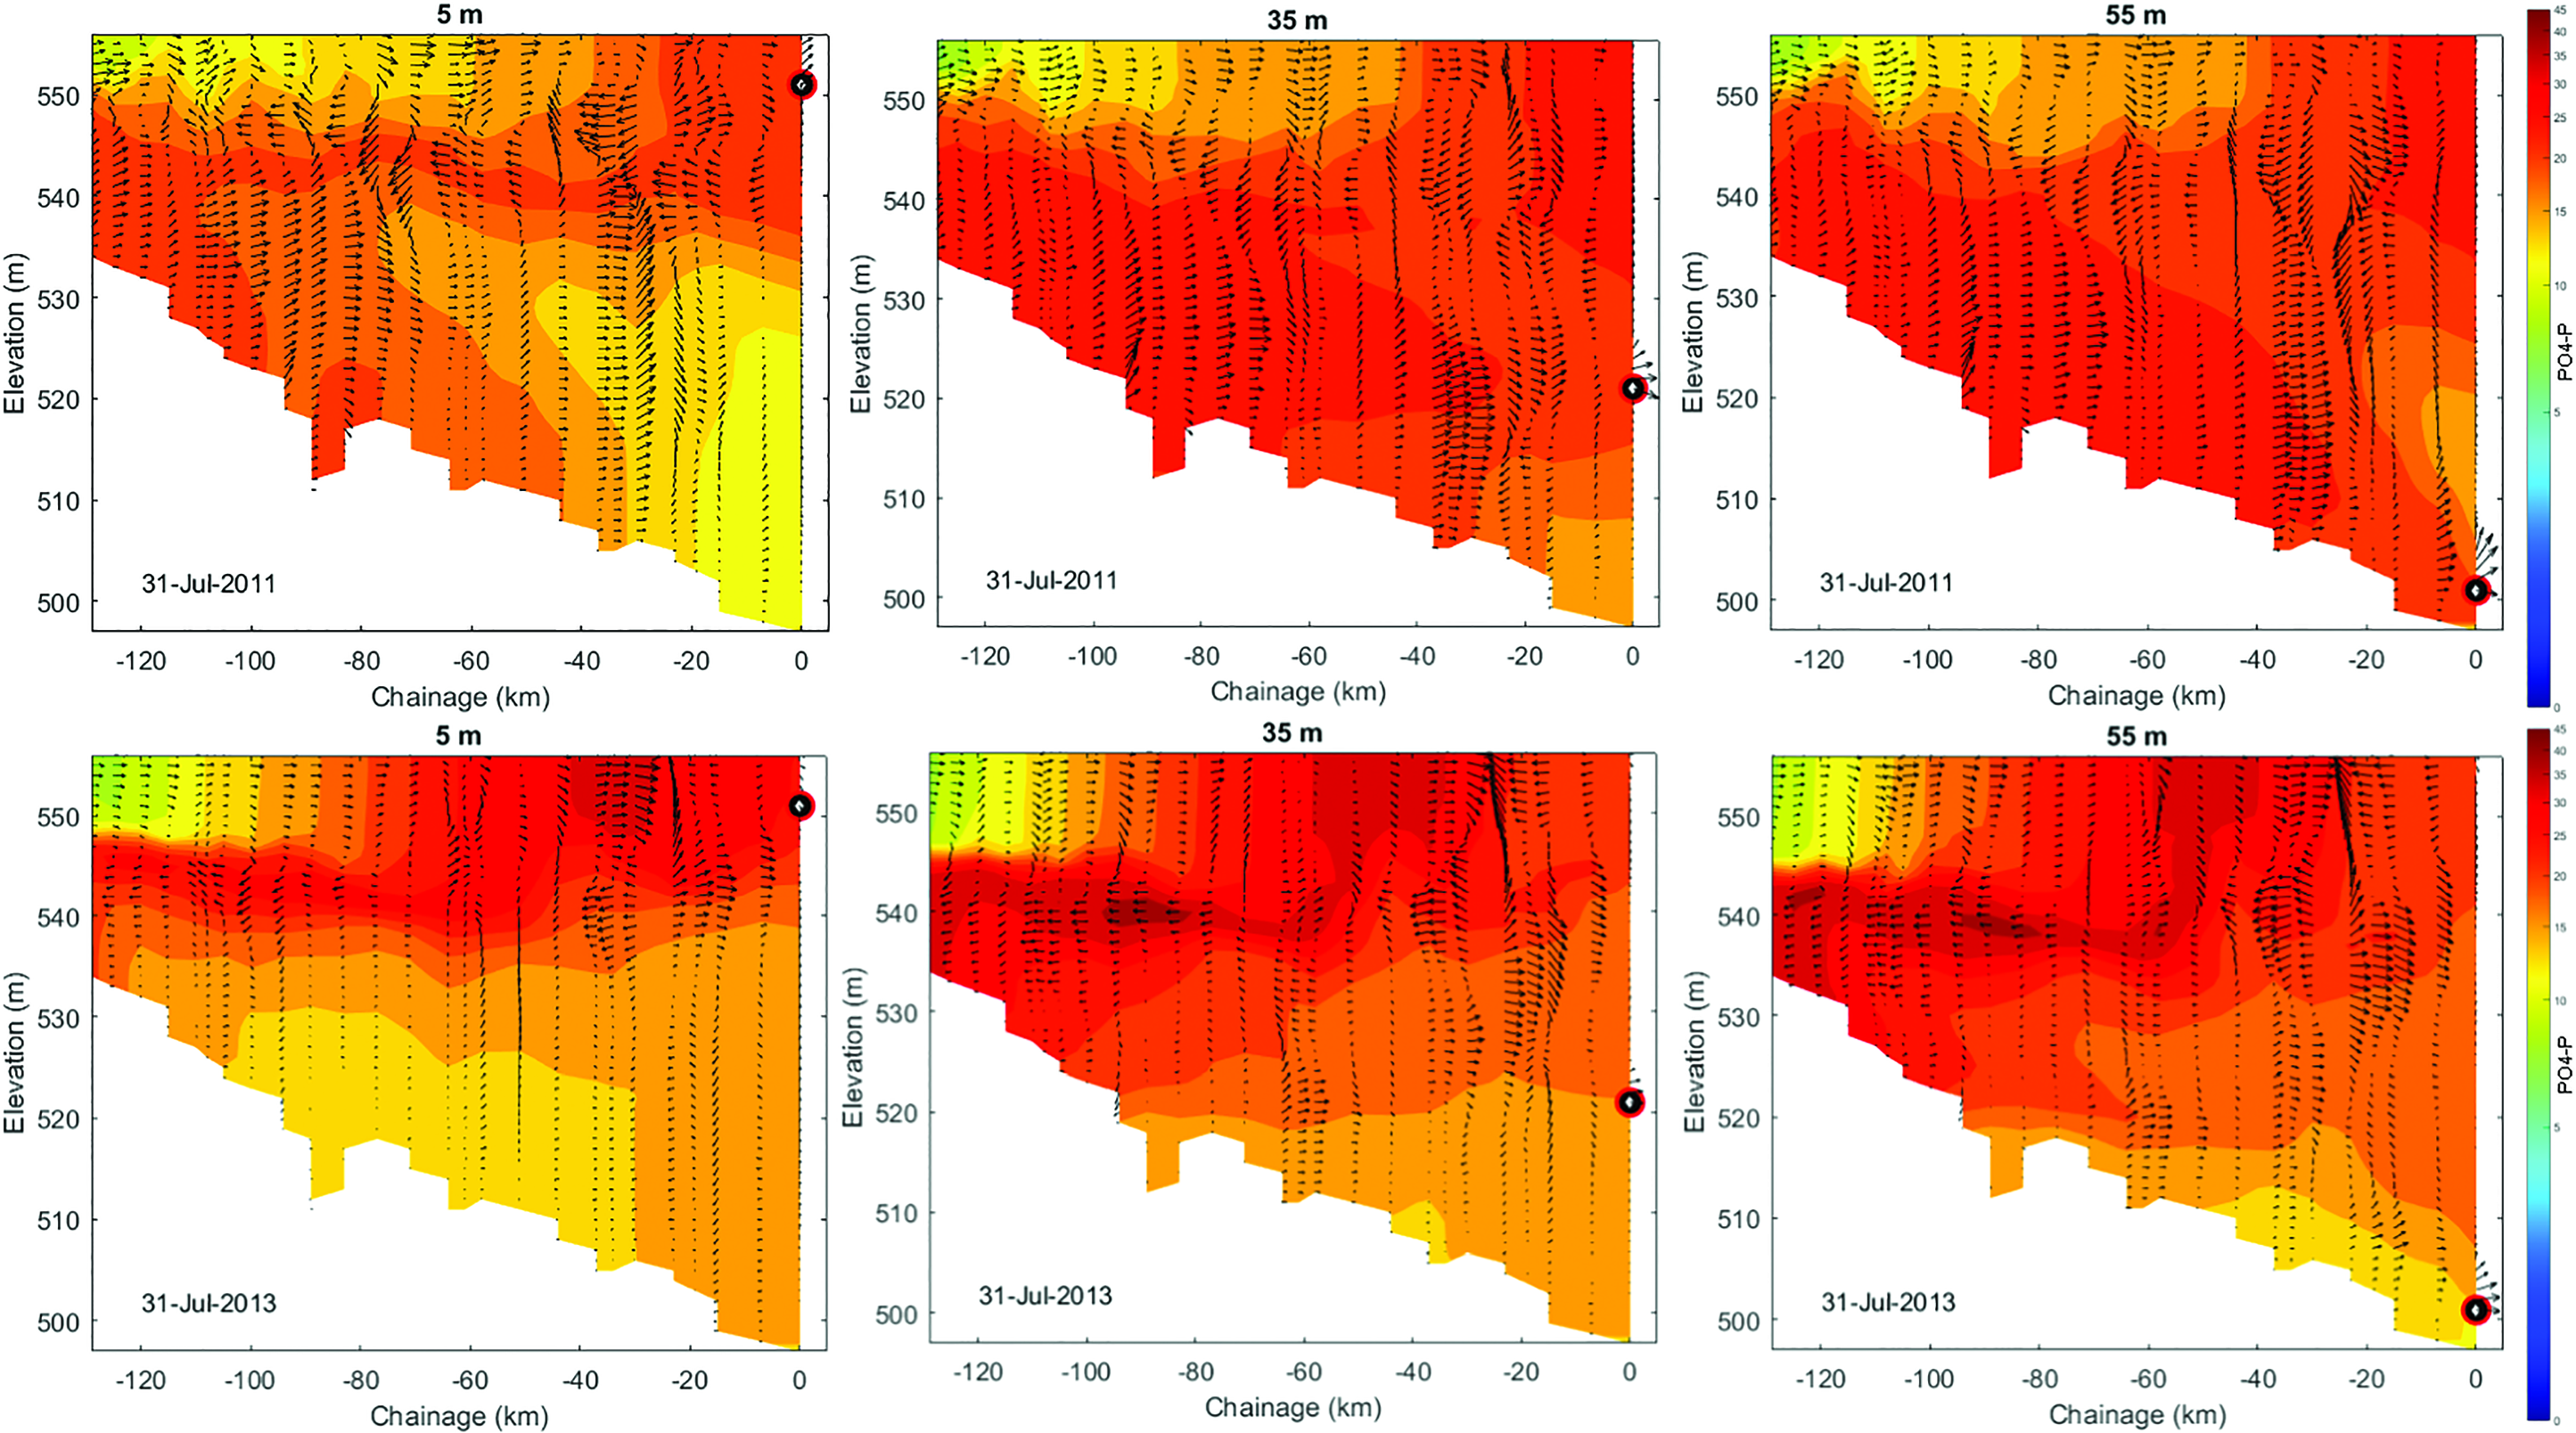
July 31, 2011 and 2013 TP profiles for 5, 35, and 55 m outflows. TP, total phosphorus.
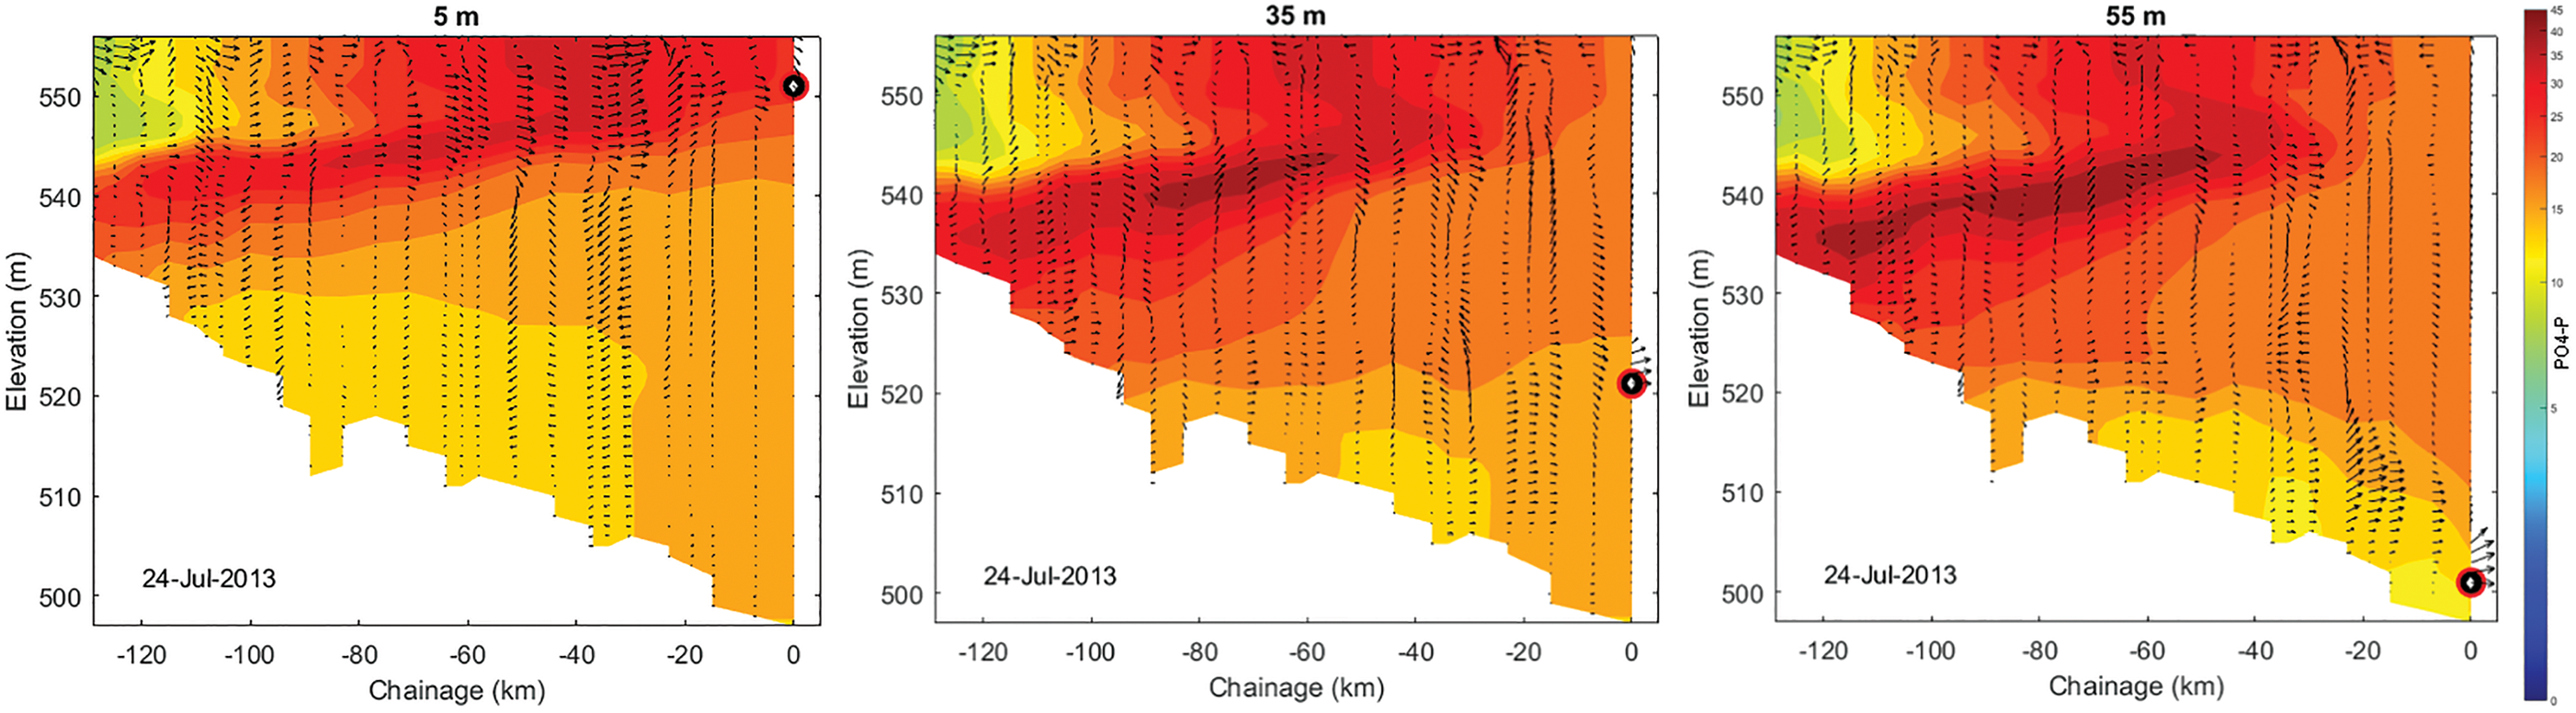
In July 2011, after the high flow peak in June, higher TP (Fig. 4) concentrations were distributed more at lower withdrawal elevations although all outflows remained the same.
The 2013 streamflows had greater concentrations of both TP and
July 31, 2011 and 2013
Similar to TP and
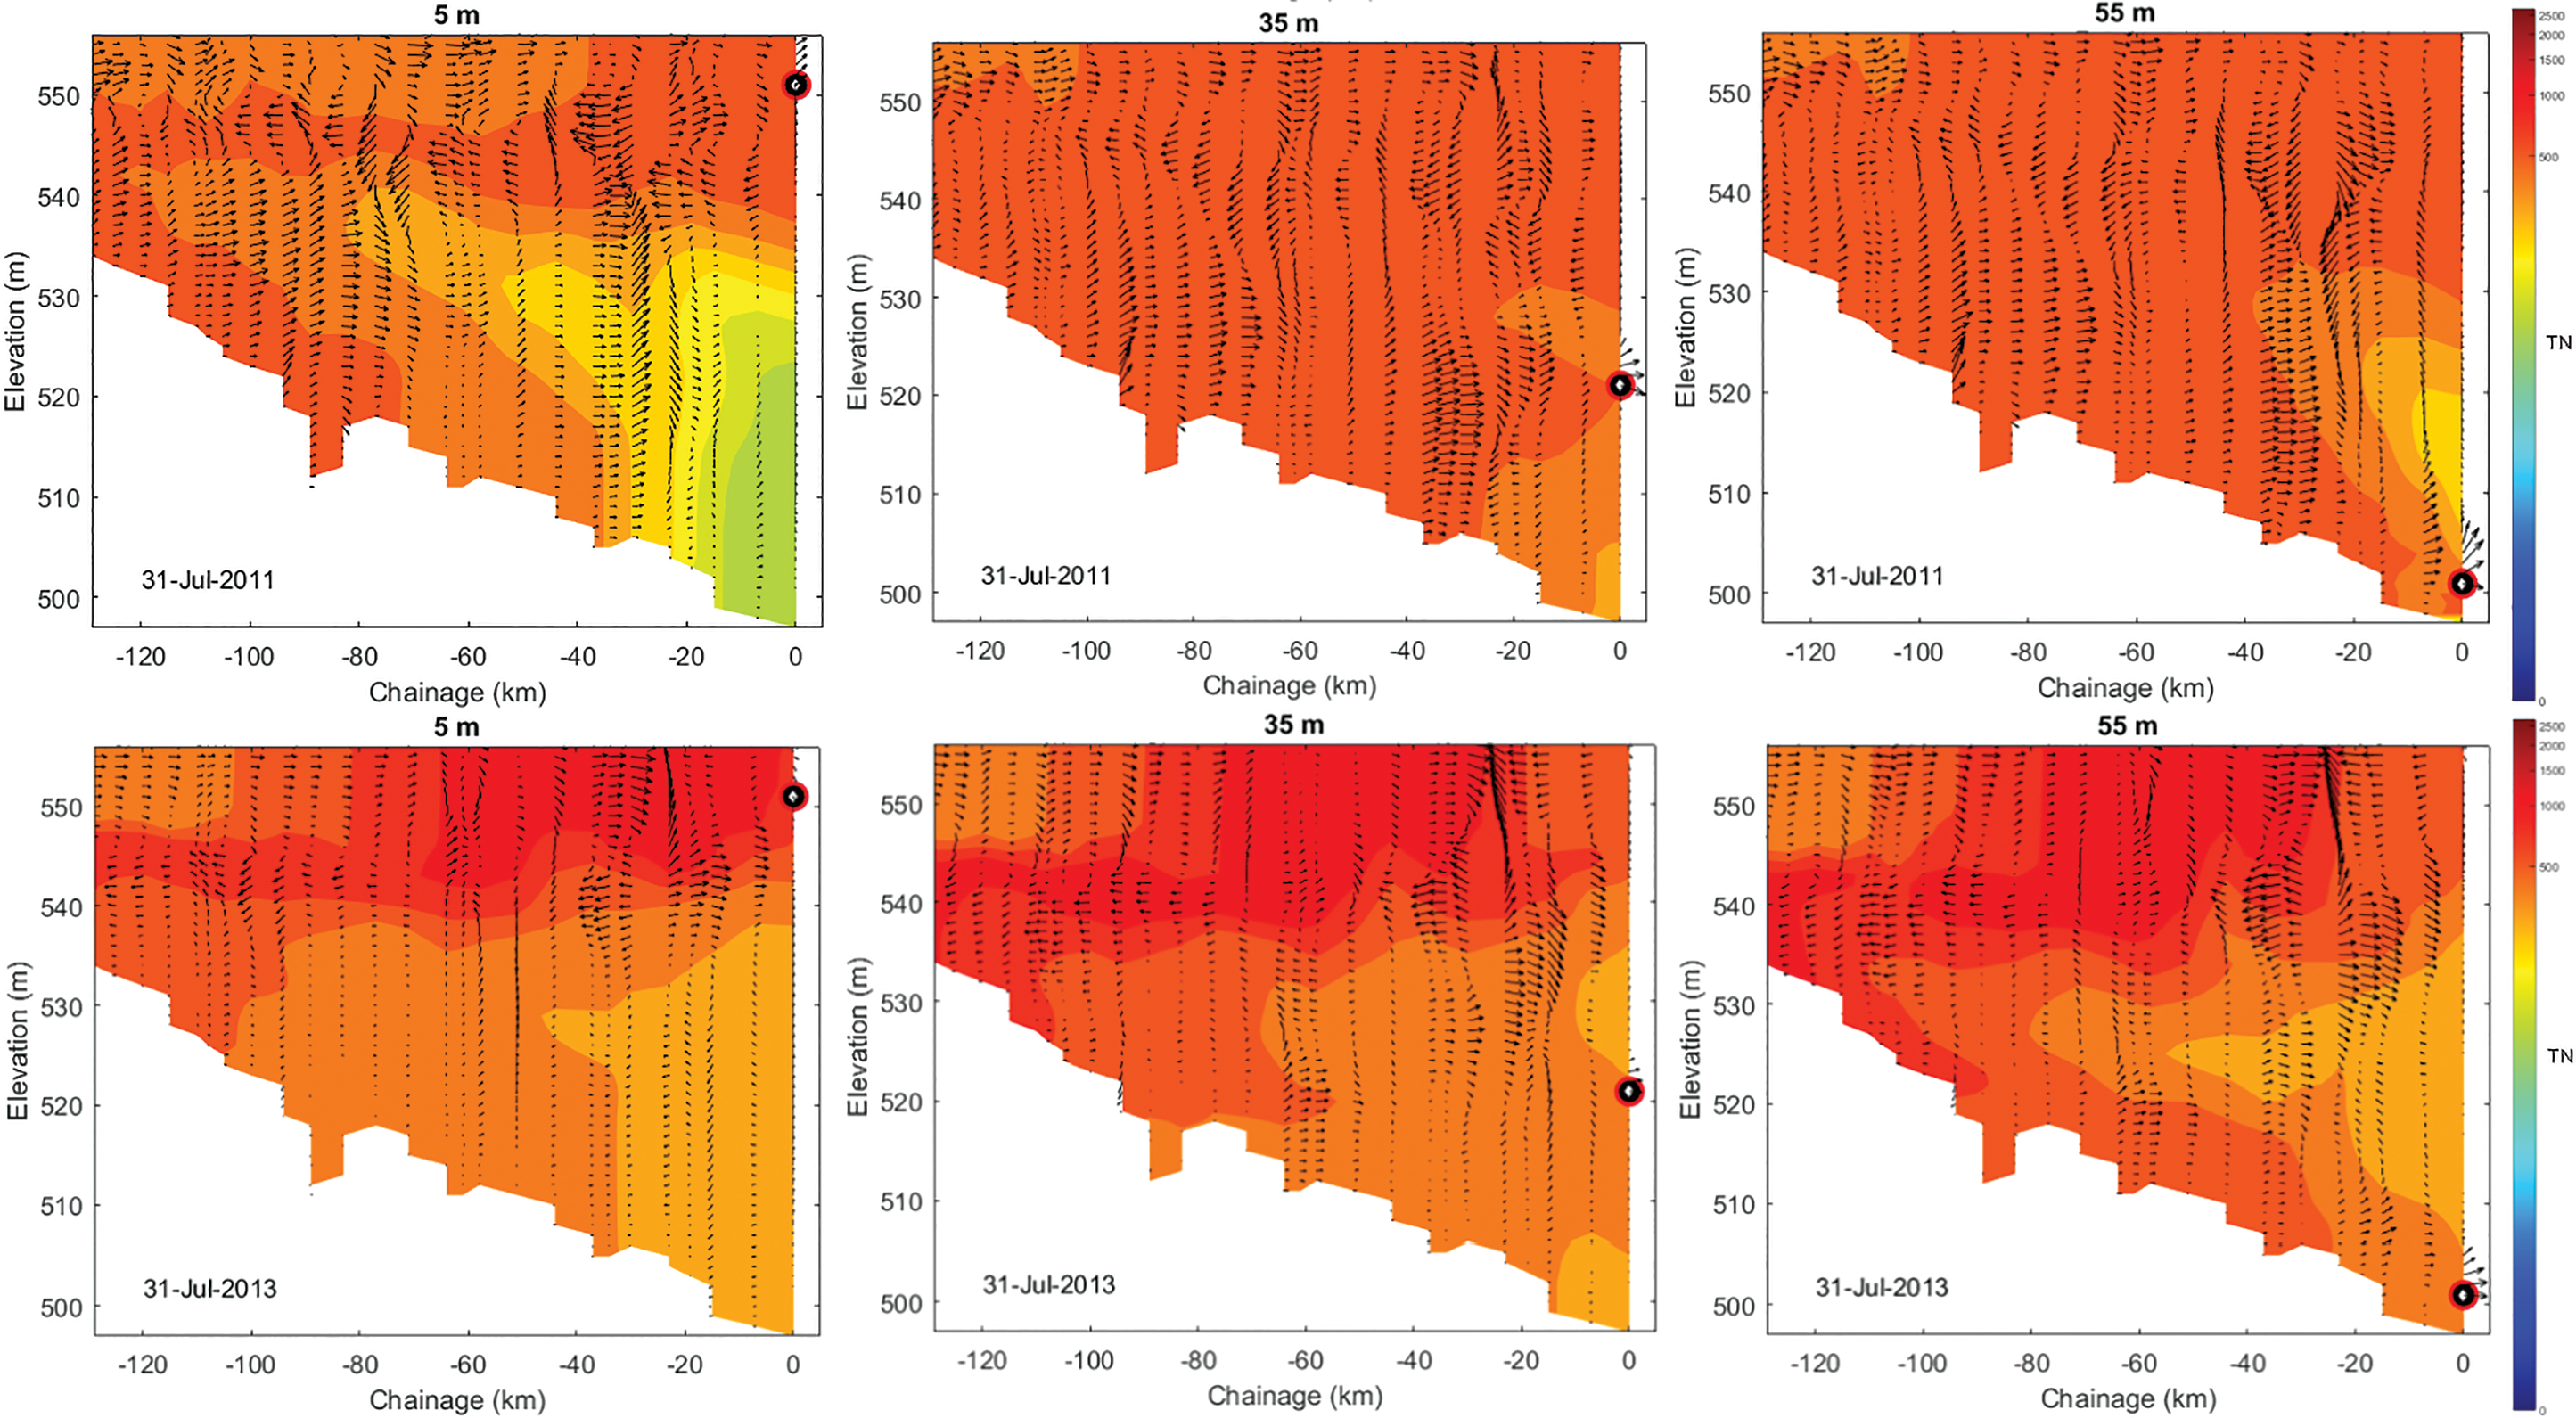
July 31, 2011 and 2013 TN profiles for 5, 35, and 55 m outflows. TN, total nitrogen.
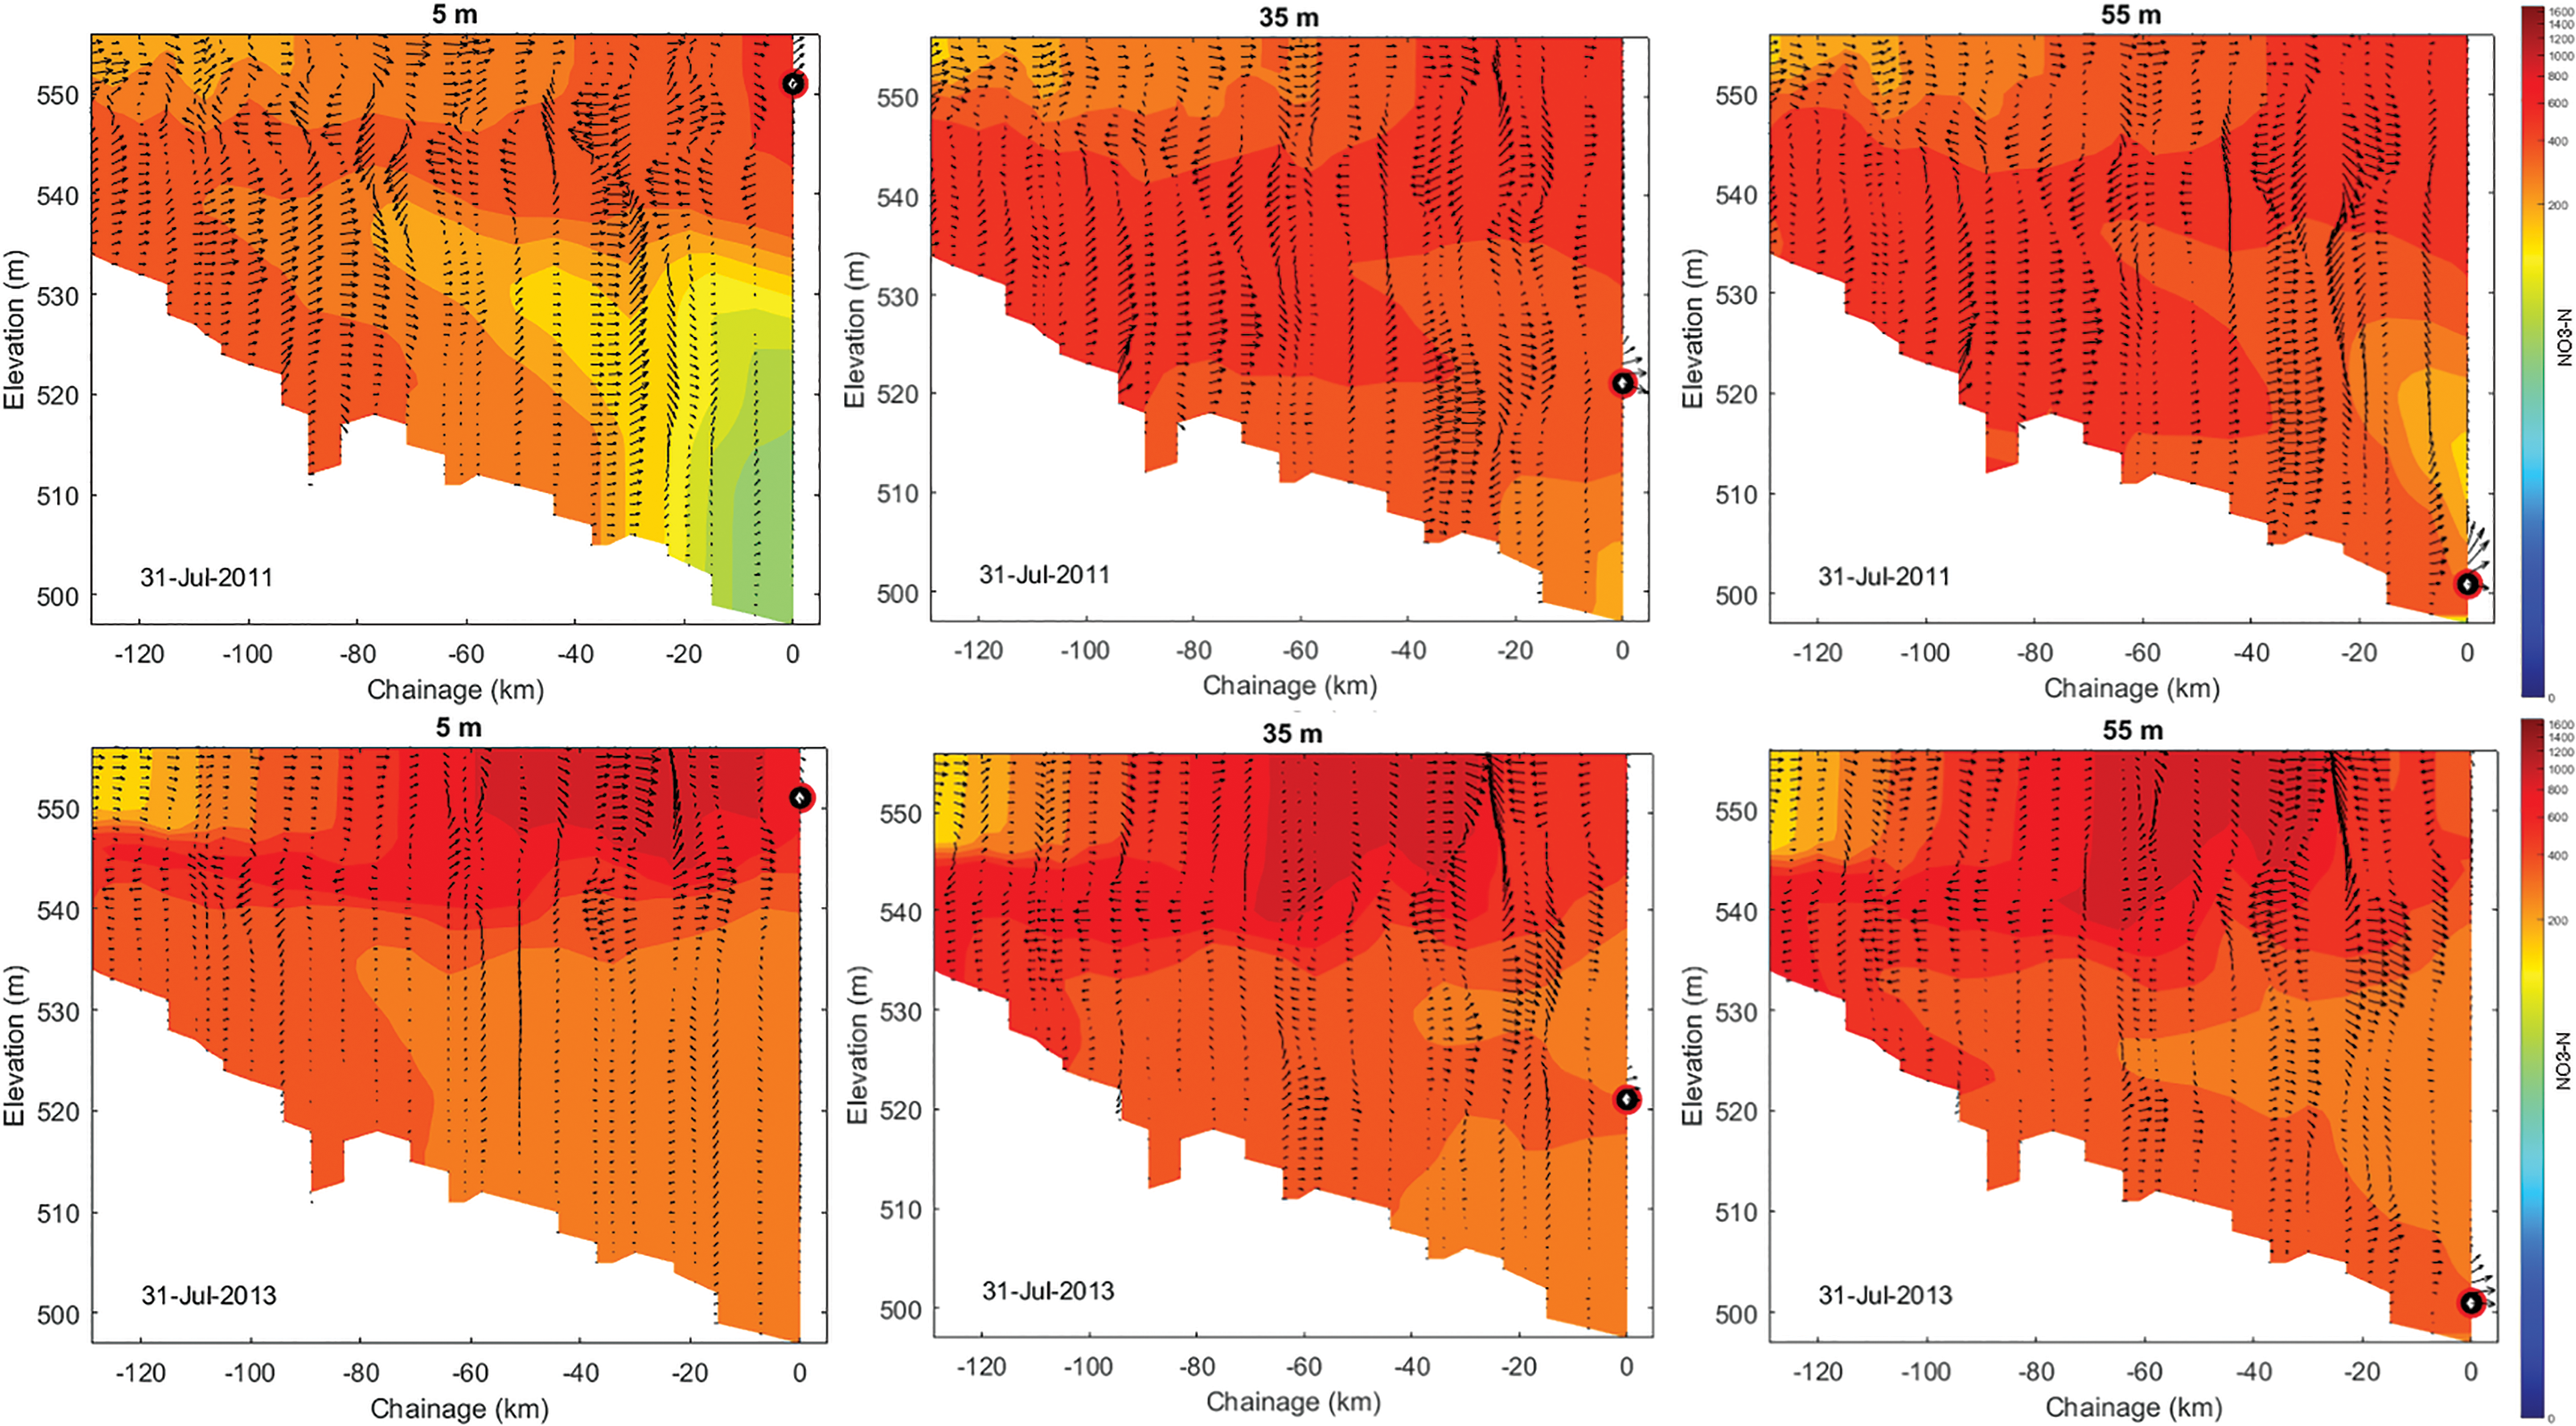
July 31, 2011 and 2013
At the very end of June and into July of both years, a plug of high
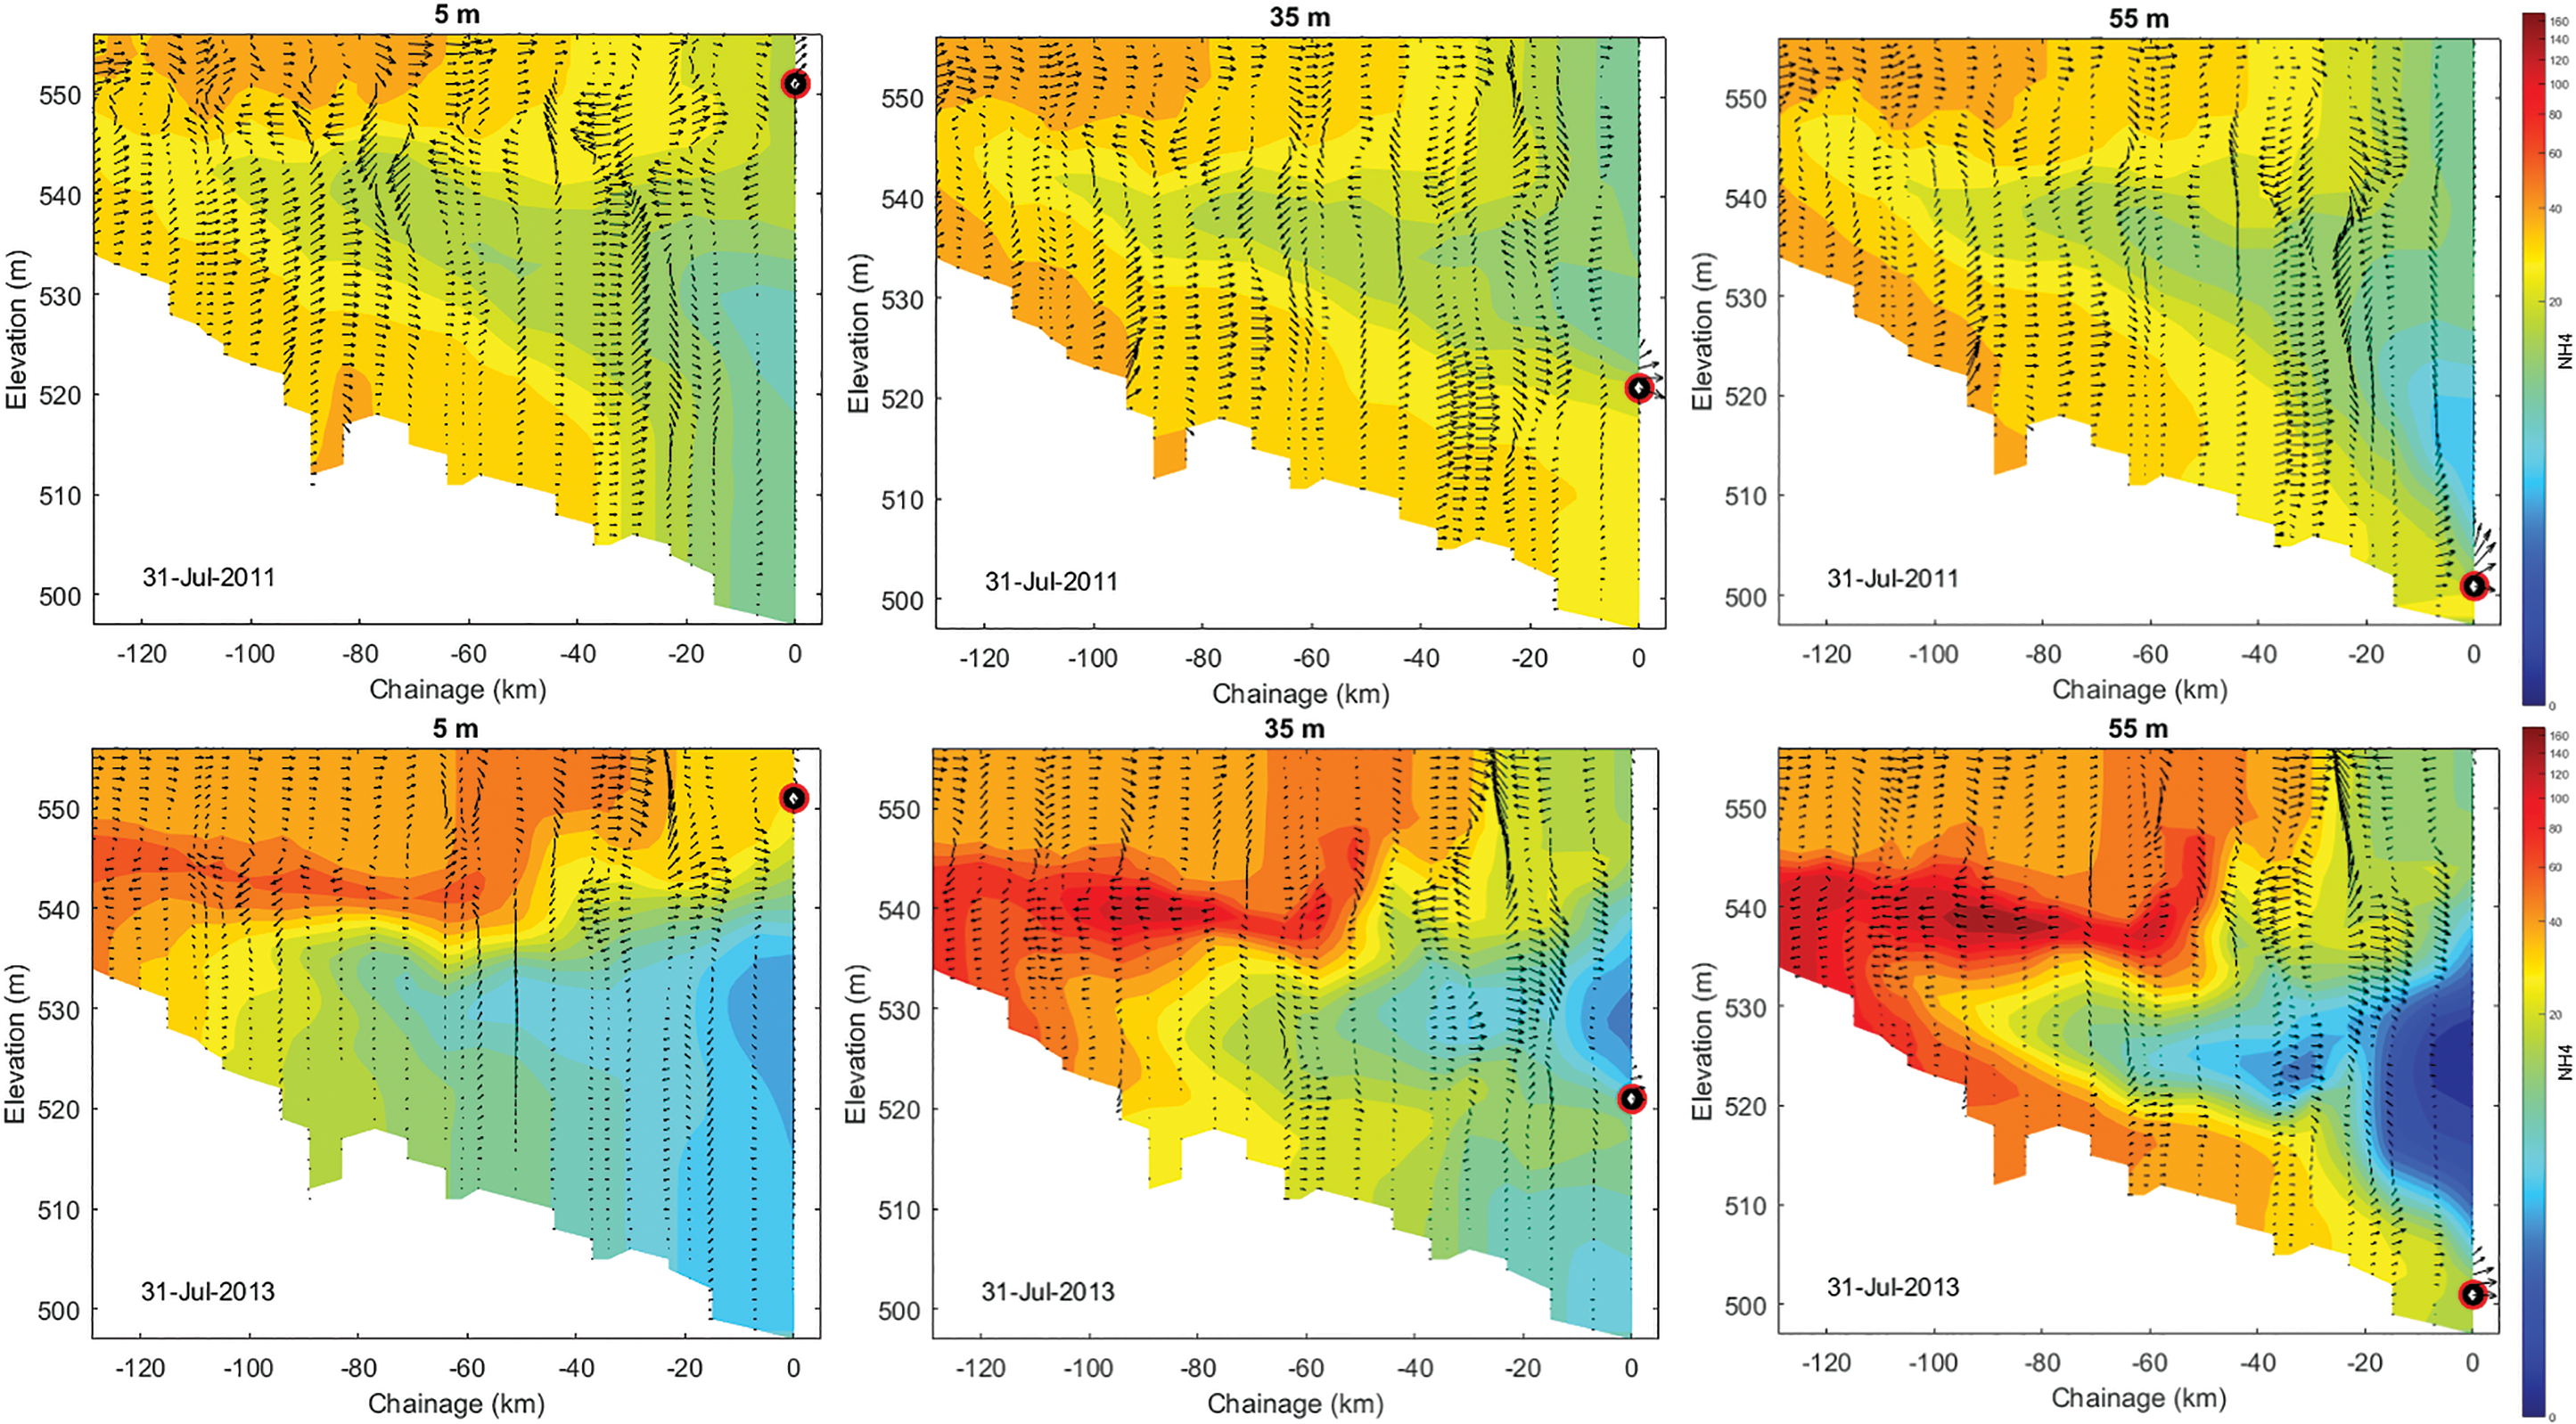
July 31, 2011 and 2013
Hypoxic conditions
In 2011, a hypoxic layer was formed along the bottom in mid-August for lower withdrawal elevations. This layer peaked in size mid-September (Fig. 9) and lasted until beginning of October. In 2011, TN concentrations peaked mid-June near the surface, whereas
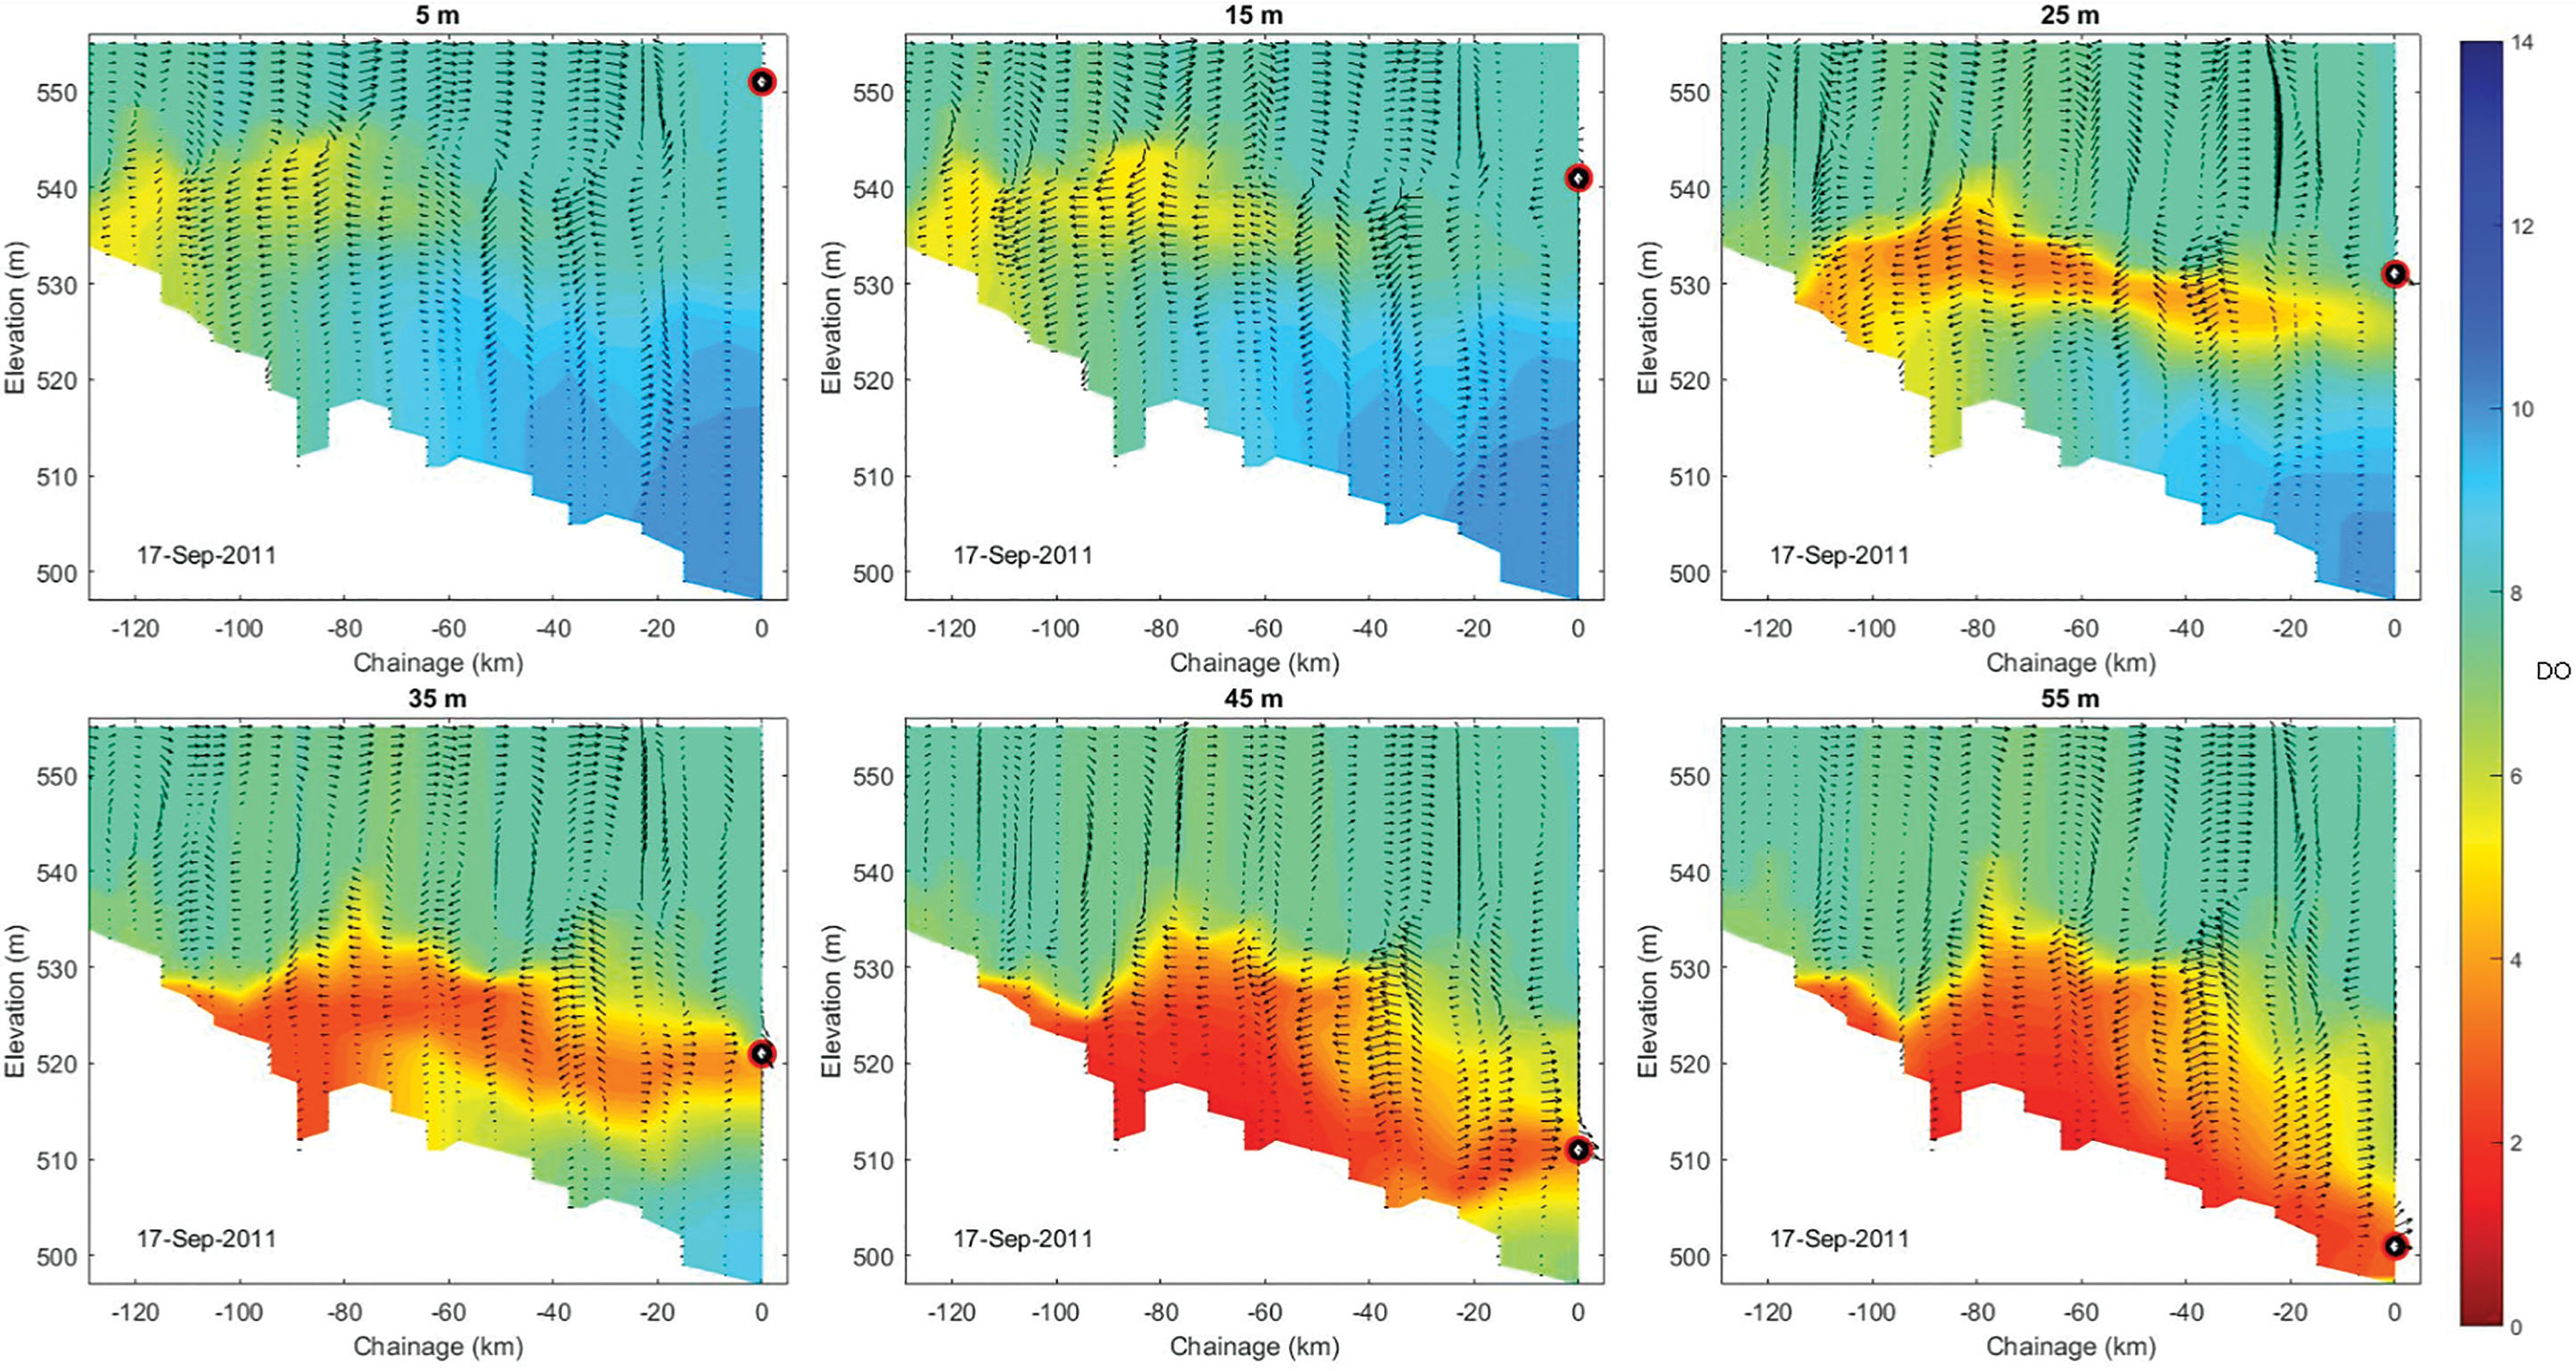
September 17, 2011 DO profiles for 5, 35, and 55 m outflows during peak hypoxic conditions.
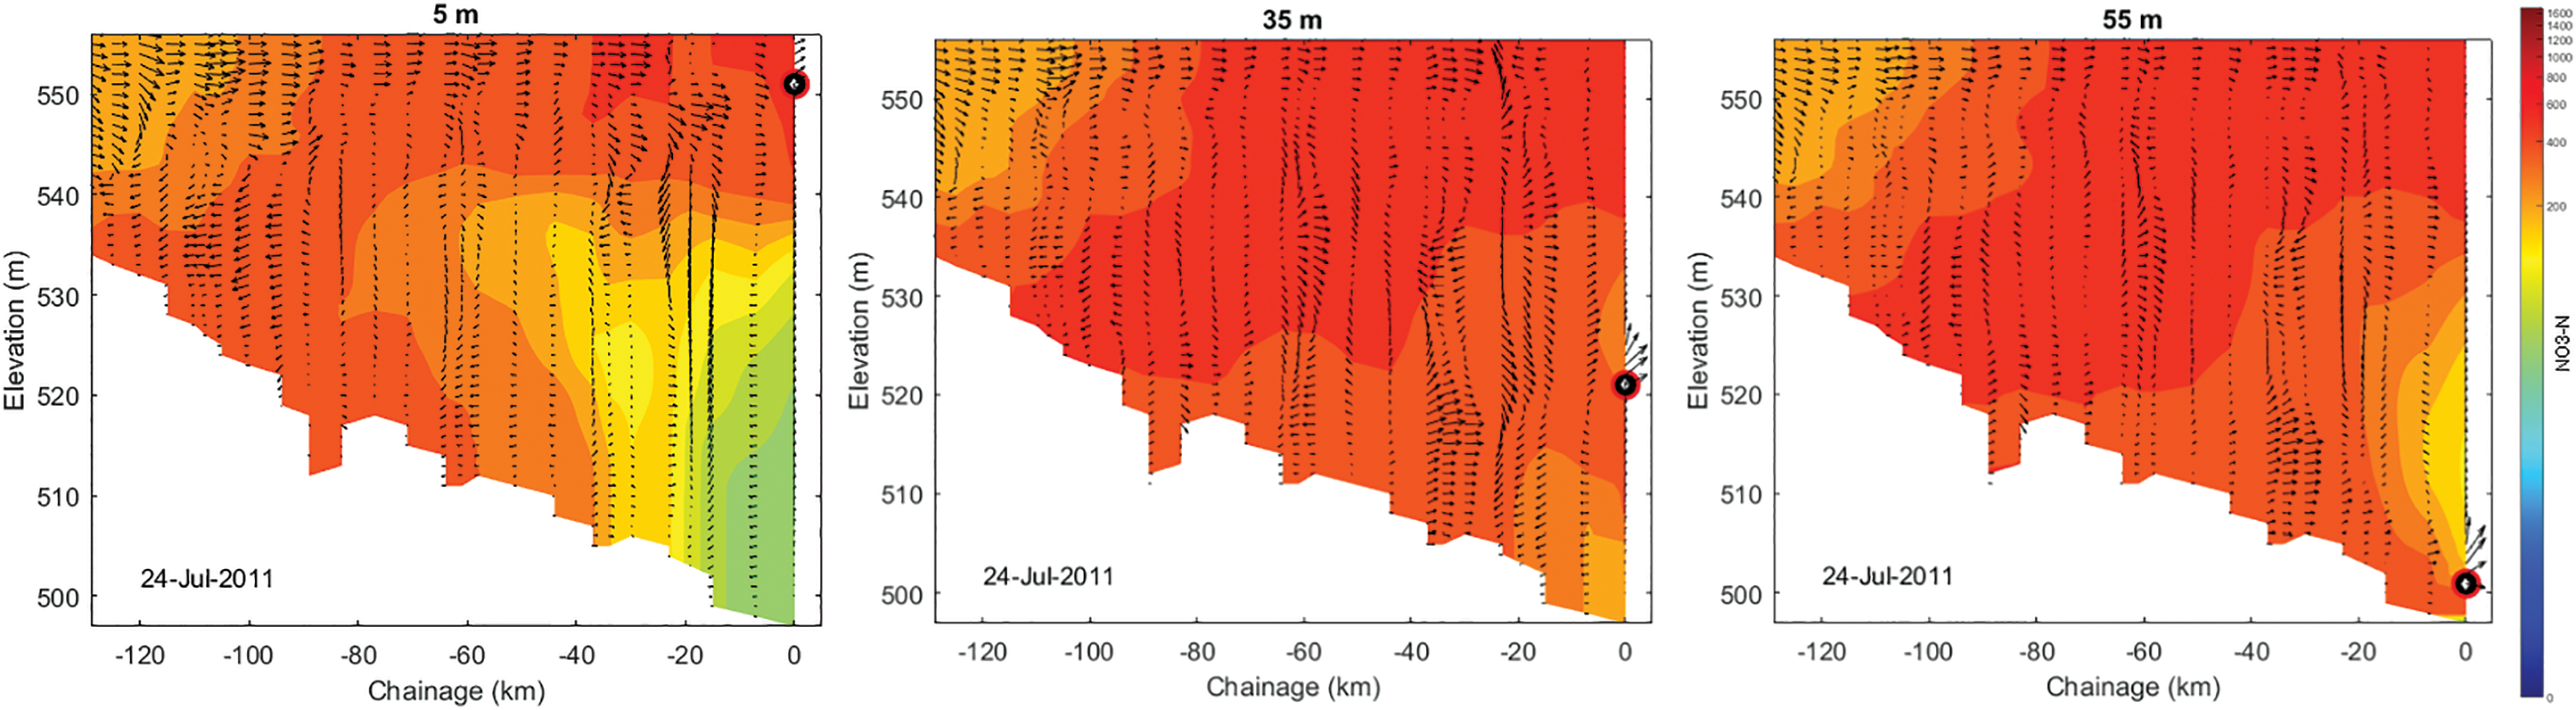
July 24, 2011
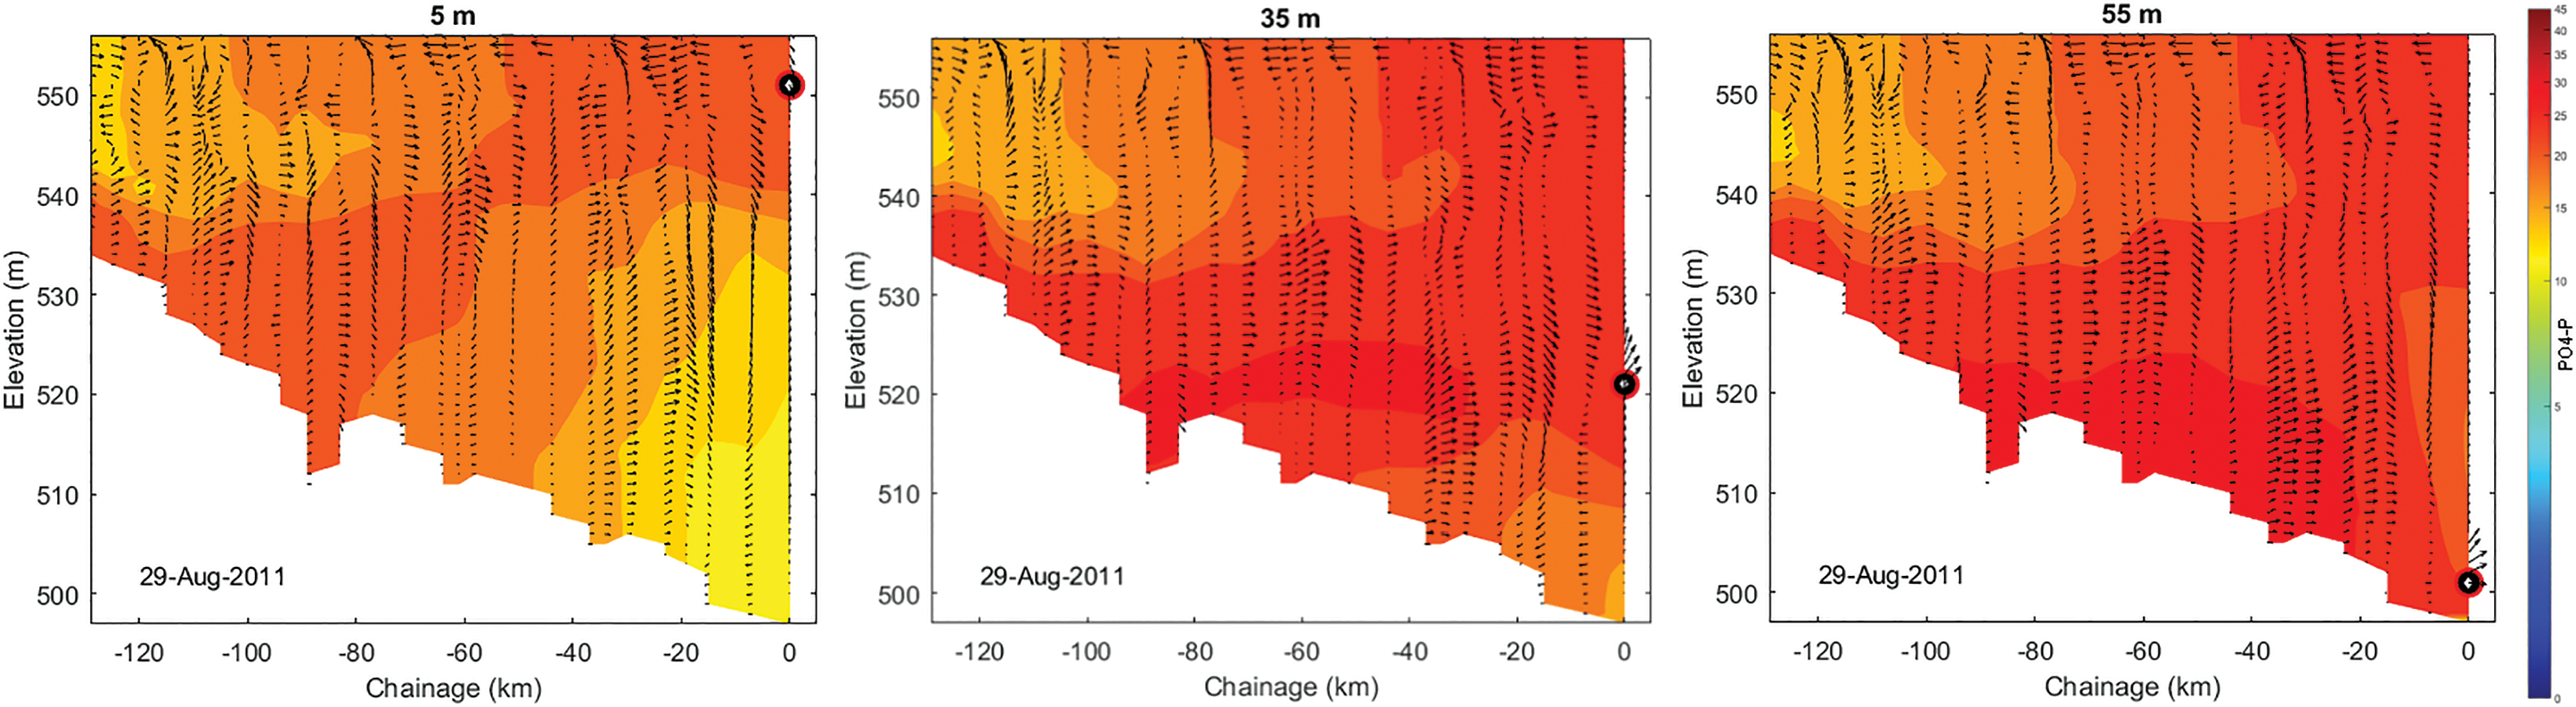
August 29, 2011
In 2013, DO levels decreased more than in 2011 with anoxic regions beginning to form in the upper half of the water column mid-July for the 500–540 masl scenarios. The regions of anoxia increased through July and an anoxic region was also formed for the 550 masl scenario (which declined by July 28) (Fig. 12). Similar to 2011, the largest regions of low DO occurred through the end of August and beginning of September for the 500–520 masl scenarios (Fig. 13). The anoxic region was gone by August 31 for 540 masl, September 27 for 530 masl, October 2 for 520 masl, October 23 for 500 masl, and October 26 for 510 masl. In 2013, TN and
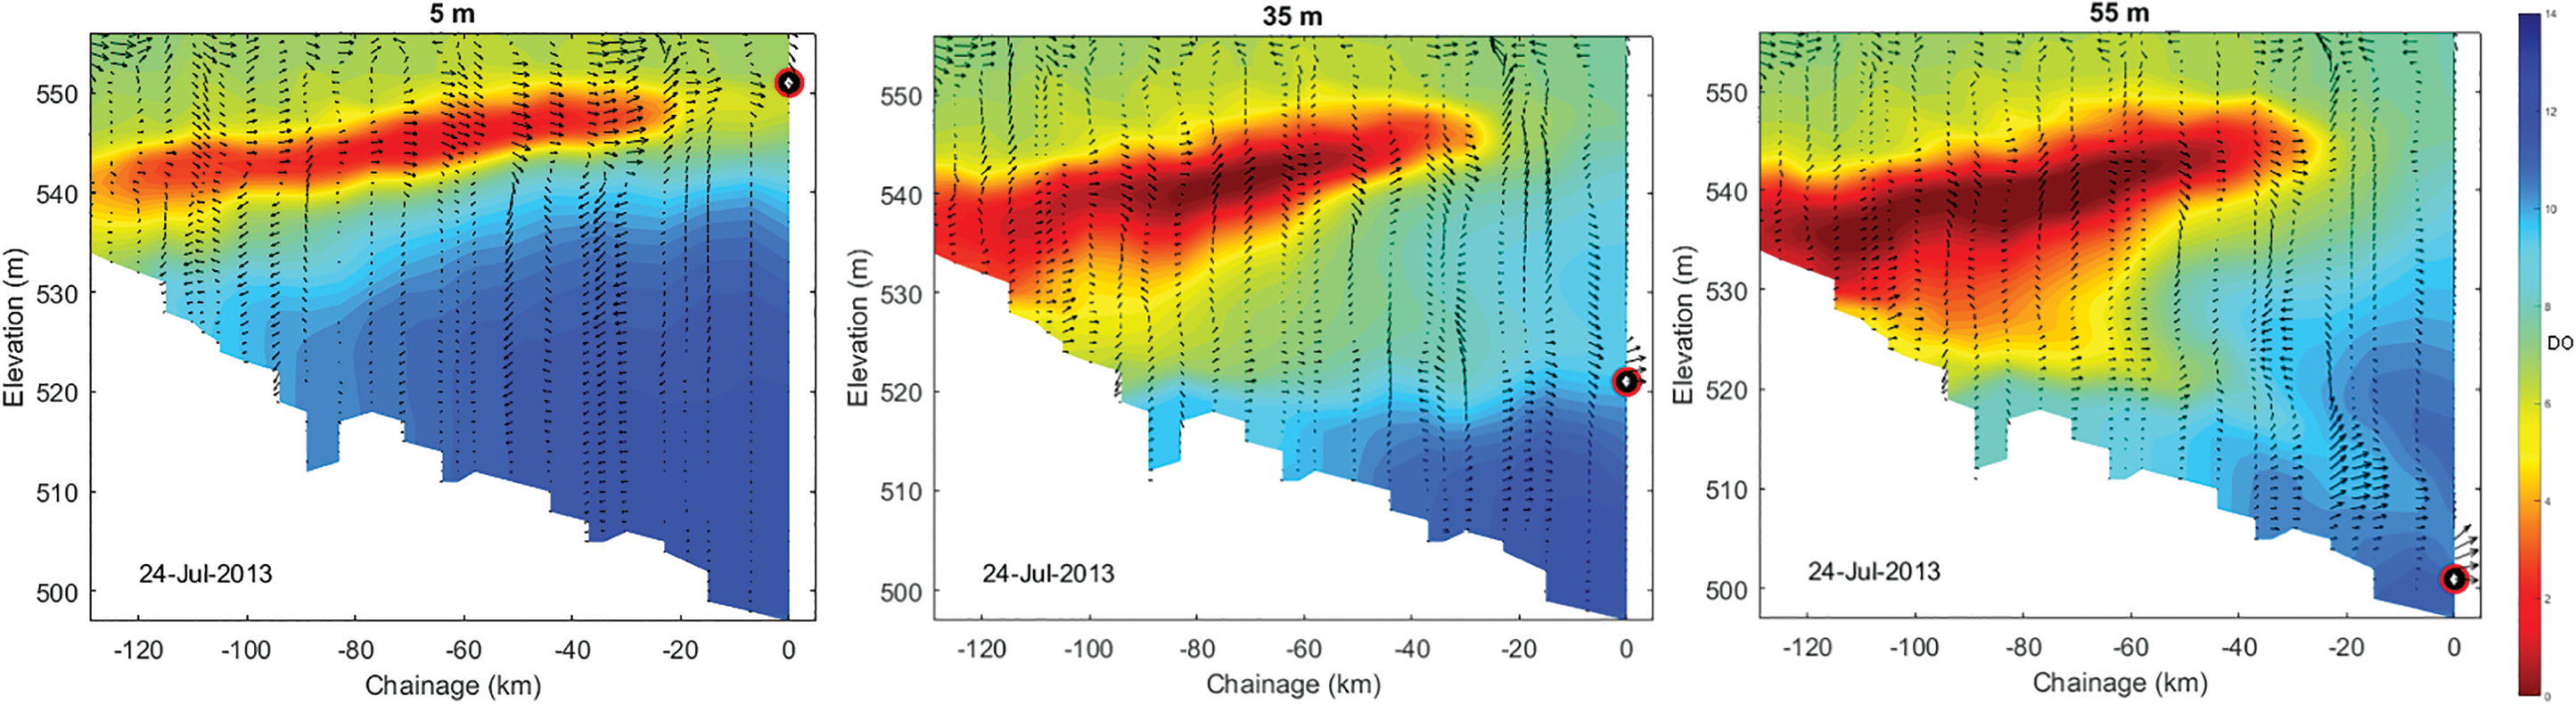
July 24, 2013 DO profiles for 5, 35, and 55 m outflows during hypoxic conditions.
August 29, 2013 DO profiles for 5, 35, and 55 m outflows during hypoxic conditions.
July 24, 2013
Advanced stratification
Through August, variable concentration patterns were similar to July.
Discussion
Implications of water withdrawals in reservoir dynamics
Mid-elevation withdrawals (530 and 540 masl or 25 and 15 m, respectively) are the optimal withdrawal depths to balance reservoir and downstream temperature, DO, and nutrient concentrations. A comparison between years shows that 2011 had the highest outflow discharge proportion diverted to the spillway during spring turnover (Fig. A1 in Supplementary Appendix). In 2013, the year of greatest summer flooding, the surface spillway was only used for a short period in early May. This difference in the type of prevailing outflow may have influenced the distribution of variable concentrations within the reservoir. Power house/turbine-dominated outflows (below surface outflow) likely cause greater mixing in the water column near the dam by having a lower outflow elevation than the spillway. This pattern is apparent with DO, water temperature, and
Through June and July 2011, the surface warms further and water with higher temperatures (Fig. 2) moved deeper for low withdrawal elevations in both 2011 and 2013. Despite this, outflows have ∼10°C difference between 500 and 550 masl outflows in both years. Water temperatures were higher and occurred at deeper layers in 2011 than 2013 and greater regions of low bottom temperatures were maintained in 2013 (likely because of high June surface velocities reducing surface warming). In both 2011 and 2013, a greater proportion of flow was diverted through the spillway (Fig. A1 in Supplementary Appendix) that likely contributed to the increased flow velocities through the epilimnion in the latter half of June.
The 2013 total nutrient and DO concentration lows were greater than in 2011, likely because of the greater load of turbid water and associated labile fine sediment in that year (Pomeroy and Shook, 2012; Hudson and Vandergucht, 2015; Sadeghian et al., 2017). Studies have shown that monthly allochthonous dissolved organic carbon (DOC) load is the main driver shaping reservoir hypolimnetic oxygen content and changes in oxygen may not follow temporal trends in TP or TN in the inflow (Marcé et al., 2008). Although riverine and transition zones of Lake Diefenbaker can experience short periods of hypoxia, this typically happens once this region begins to stratify (Hudson and Vandergucht, 2015). This does not occur until late July in both years, well after the initial influx of turbid flows. Particularly large allochthonous organic inputs combined with short periods of stratification likely led to rapid DO depletion in 2013 (Hudson and Vandergucht, 2015).
The lag in decreased DO and increase in dissolved nutrients likely occurs because of nutrient desorption and DOC metabolism rates. Abstraction from the hypolimnion exasperates the low DO concentrations in the hypolimnion because the already warmer epilimnion causes the fine sediments to flow into layers of heavier density in the hypolimnion where the high DO demand is not replenished by reaeration. A study in a Polish reservoir (Dunalska et al., 2007) found hypolimnetic withdrawal resulted in down welling of warm surface water, increasing hypolimnion temperature by 1.3°C that decreased strength of thermal stratification and increased phytoplankton primary production and biomass in the metalimnion. Conversely, they found that deep withdrawals reduced phytoplankton biomass in the hypolimnion (Dunalska et al., 2014).
Here, in both years lower withdrawal elevations caused greater areas of low DO (Fig. 3) to spread within the reservoir. This was of particular concern in 2013 when an anoxic region formed mid-water column in the upstream half of the reservoir and lower elevations caused it to spread and cover a greater region of the reservoir. Transition zones of reservoirs often experience low DO during prolonged periods of stratification and reduced velocity results in deposition of finer materials and associated nutrients (Cole and Hannan, 1990; Kalff, 2002) (note the high concentrations of TP,
Through July, surface velocities decreased substantially as spillway diversions decreased and high TP (Fig. 4) and water with low DO concentrations begin to move along the bottom of the reservoir rather than be routed along the surface. This is likely because of sediment beginning to settle along the bottom as decreased flow velocities decrease transport capacity. Through July 2011, higher TP and
Under flood conditions, shallower withdrawal elevations would be advantageous for removing more limiting P from the water column and reducing epilimnion temperatures (particularly during peak flow periods) to reduce risks of harmful algal blooms. Temperatures above 25°C favor the growth of cyanobacteria (Paerl and Huisman, 2009) and shallow withdrawals during high flow events reduce temperatures and may also facilitate washout of harmful algal species that proliferate during the warmest periods (Roelke et al., 2010). Similar to TP and
In 2013 (Figs. 12 and 13), DO levels decrease more than in 2011 (Fig. 9) with anoxic regions beginning to form in the upper half of the water column mid-July for the 500–540 masl scenarios. The regions of anoxia increase through July (Fig. 10) and an anoxic region was also formed for the 550 masl scenario (which declines by July 28). The anoxic regions remain in the upper riverine half of the reservoir. This agrees with previous studies that identified short periods of hypoxia in the riverine and transition zones of Lake Diefenbaker (Hudson and Vandergucht, 2015). In 2011, overall greater reservoir
Through August, variable concentration patterns are similar to those in July, with 540 masl generally resulting in the best balance in reservoir and outflow temperatures and variable concentrations. Shallower withdrawal elevations seem to result in the most favorable reservoir and outflow variable concentrations during the summer stratification period. As mentioned previously, the portion of spillway outflow may contribute to this behavior by routing inflowing high concentration water across the surface and downstream more rapidly. The 540 and 530 masl elevations tend to be the optimal scenarios for balancing reservoir and outflow concentrations in summer.
There is little difference in both water temperature (Fig. A11 in Supplementary Appendix) and DO concentrations (Fig. A12 in Supplementary Appendix) between 2011 and 2013 and in both years shallower outflow scenarios tend to have more desirable concentrations/temperatures at both outflow and within the reservoir. The 530–540 masl outflows generally provide optimal concentrations for both DO and temperature. Lower elevation outflows maintain higher TP and
There may be scenarios where there are tradeoffs between influencing phosphorus or nitrogen concentrations within the reservoir and at outflows, making identification of the optimal withdrawal elevation a challenge as outcomes can vary between years and from week to week in a given year. During spring turnover there is a slight tradeoff situation occurring. Optimal outflows to reduce
In addition to changes in variable concentrations and distribution, withdrawal elevation seems to influence volume of the epilimnion and hypolimnion and sediment distribution. Similarly, Zouabi-Aloui et al. (2015) also found that withdrawal depths had an influence on metalimnion thickness that influences strength of stratification, vertical transfer of heat, and DO. The abstractions from the lower elevations in Lake Diefenbaker are not only lowering the metalimnion but also contracting the volume of the hypolimnion. For every 10 m drop in the metalimnion, the hypolimnion volume is reduced by approximately half, 550 m = (5,400 × 106 m3), 540 m = (2,700 × 106 m3), 530 m = (1,200 × 106 m3), 520 m = (500 × 106 m3). Wind-induced flows along the surface are countered by reverse flows in the hypolimnion that are now concentrated with higher flows because of the smaller flow cross-section of the hypolimnion. Geomorphology also plays a role, in which flow velocities are increased even more where the lake bottom is narrower and more incised. In addition to the layering into deeper waters, the higher flows in the hypolimnion can draw more of the inflowing fine sediment along the lake bottom instead of transporting and diluting the sediment throughout the epilimnion when the abstraction is from the top layers. This is transferring the DO demand to the hypolimnion exacerbated by the lack of oxygen replenishment from reaeration and phytoplankton growth.
The model can now be used to explore other scenarios, particularly if there are shifts in reservoir management and operation strategies. Such shifts may include maintaining temperature coherence between the outflow river reach and the inflowing river to potentially improve diversity and habitat for animal species in the downstream river [e.g., macroinvertebrates—see Carr et al. (2019)]. In addition, the model can also be used to determine optimum abstraction levels to fulfill nutrient concentration thresholds in the downstream river reach for downstream water uses (e.g., water treatment plant at Saskatoon).
A limitation in this study is the lack of landscape interactions under climate change in the model. This may be particularly important in the future as we enter a time of increased climate uncertainty and can be addressed using the approaches implemented by Nielsen et al. (2014) and Bucak et al. (2018). Optimum water quality levels in the reservoir can be reached by improving water releases management.
Model uncertainties
As with all models and studies of natural systems, there are different sources of uncertainty in this study. Data sparsity, both in terms of available measured variables and small spatial and temporal coverage, limited the ability to sufficiently calibrate all variables and include some important processes in simulations. For example, the model had very little data for phosphorous calibration and there are very few equations for the phosphorous mass balance. Therefore, using
There are also general uncertainties in the model structure preventing some processes from being included in the simulations. There were not enough data (in situ P release rates, Fe:P ratios, sulfate concentrations, ammonia release rates, etc.) to determine sediment nutrient remobilization; therefore, general assumptions about mobilization were made based on DO concentration. This was deemed appropriate as internal P loading is not considered a significant source of P to the reservoir in stratified regions such as at the dam outflow despite known P release from Lake Diefenbaker sediments year round (North et al., 2015; Doig et al., 2017).
Settling rates of suspended solids and algae were kept constant throughout the reservoir, although this is not representative. The reservoir is very large with complex geometry and bathymetry and a longitudinal shift from fluvial to lacustrine characteristics (variable velocities, depths, sedimentation, and erosion) (Sadeghian et al., 2015). The upstream fluvial region is expected to have greater sedimentation rates than downstream because the majority of suspended particles in the lacustrine zone would be fine with low settling rates. An average settling rate was used throughout the lake as spatial and temporal changes in partitioning of particle size were not known. A Pareto optimum approach was applied to calibrate a general settling rate and the rate and critical stress for sediment resuspension. This is an optimization approach where two or more objective functions end up being slightly inaccurate to get a reasonable value overall, essentially identifying an acceptable compromise.
Conclusions
A 2D hydrodynamic CE-QUAL-W2 model has been implemented to simulate water withdrawal scenarios in a large multipurpose reservoir. The model is an effective tool for improving understanding of withdrawal elevation impacts on physical, chemical, and nutrient dynamics within Lake Diefenbaker. The main conclusions of this research are as follows:
Deep abstractions draw down the metalimnion to increase the volume of the epilimnion and decrease the volume of the hypolimnion. Thermocline depth has been found to generally coincide with outlet depth. This increases the heat flux to the lake making the entire water body generally warmer and increasing density gradients. The metalimnion becomes thicker, with decreased temperature difference between the epilimnion and hypolimnion, but with a greater density gradient accentuating its behavior as a barrier between the epilimnion and hypolimnion. Deep abstractions also store more heat longer into the autumn season delaying turnover and winter inverse stratification. In the spring, deeper withdrawals generally increase downwelling of warmer surface waters leading to weaker summer stratification. With deep abstractions, the resulting smaller, more confined hypolimnion exhibits faster flow velocities along the lake bottom that draws in more of the inflowing sediment and associated nutrients into the hypolimnion, which was particularly apparent during summer stratification. The concentration of sediment along the bottom of the lake represents a strong DO deficit when the sediment material is decomposed. In general, deep abstractions draw more oxygen-rich surface water from the epilimnion into deeper layers. Although this usually results in shortened periods of anaerobic conditions near the bottom and diminished spatial extent of oxygen deficiency, it can have little effect on aerobic conditions. In general, during high flows when the spillway is in operation, water with high nutrient concentrations and low DO are routed along the surface in the region of highest flow velocities and water column mixing is delayed. This effect is only observed during summer stratification and not during turnover periods. P (TP and
Data Availability
All relevant data presented in this article are available in the online Federated Research Data Repository at https://www.frdr.ca/repo/handle/doi:10.20383/101.0134. Videos for the summer stratification period for the following years and time intervals: February 2011—0:20–0:50, 2012—2:22–2:52, 2013—4:23–4:54 can be seen at https://dx.doi.org/10.20383/101.0134.
Footnotes
References
Supplementary Material
Please find the following supplemental material available below.
For Open Access articles published under a Creative Commons License, all supplemental material carries the same license as the article it is associated with.
For non-Open Access articles published, all supplemental material carries a non-exclusive license, and permission requests for re-use of supplemental material or any part of supplemental material shall be sent directly to the copyright owner as specified in the copyright notice associated with the article.