
Abstract
Background:
Type 2 diabetes mellitus (T2DM) is a major global health concern, with insulin resistance (IR) playing a critical role in its development, along with cardiovascular diseases and metabolic syndrome. The triglyceride-glucose (TyG) index has emerged as a reliable and cost-effective alternative to traditional IR assessment methods, such as homeostatic model assessment for IR (HOMA-IR). In addition, visceral adiposity is strongly associated with IR and metabolic dysfunction, yet the relationship between the TyG index and visceral adiposity markers remains underexplored. This study aimed to evaluate the association between the TyG index, visceral adiposity index (VAI), and IR in a young population.
Methods:
A total of 209 young individuals (18–25 years old) from the Guadalajara Metropolitan Area, Mexico, were recruited. Participants underwent anthropometric, physiological, and biochemical assessments, including body mass index (BMI), waist circumference, blood pressure, lipid profile, glucose, insulin, and calculation of HOMA-IR, TyG index, VAI, and dysfunctional adiposity index (DAI). Statistical analyses included Pearson’s correlation, Student’s t-test, and Chi-square test to assess associations between variables.
Results:
Individuals with an elevated TyG index (≥8.8) had significantly higher BMI, waist circumference, systolic blood pressure, glucose, triglycerides, cholesterol, insulin, HOMA-IR, VAI, and DAI (P < 0.05). A strong correlation was observed between the TyG index and VAI (R2 = 0.704, P < 0.001) as well as DAI (R2 = 0.734, P < 0.001). The TyG index was significantly associated with IR (odds ratio [OR] = 3.35, P = 0.0078), VAI (OR = 104.38, P < 0.0001), and DAI (OR = 86.07, P = 0.0032).
Conclusions:
The TyG index is strongly associated with visceral adiposity and IR in young individuals.
Introduction
Type 2 diabetes mellitus (T2DM) is one of the major health challenges of the 21st century, accounting for approximately 90%–95% of all diabetes cases. 1 Insulin resistance (IR) is a key factor not only in the development of T2DM but also in cardiovascular diseases (CVDs). 2 This condition, characterized by a reduced ability of peripheral tissues to respond adequately to insulin, plays a crucial role in the onset of metabolic syndrome, T2DM, and other related conditions, including hypertension, dyslipidemia, and CVD. 3 Early detection of IR is essential to enable timely intervention and management. 1
Although the hyperinsulinemic-euglycemic clamp technique remains the gold standard for diagnosing IR, it is both costly and time-consuming. 4 The homeostatic model assessment for IR (HOMA-IR) has been widely used in clinical practice since its introduction in 1985. 5 However, a key limitation of HOMA-IR is that insulin measurement, a crucial parameter for its calculation, is expensive. 6
In this context, various alternative markers, such as the triglyceride-glucose (TyG) index, have been developed to assess IR more easily. 7 The TyG index was first proposed by Simental-Mendía et al. in 2008 and is calculated using the formula: Ln[fasting triglycerides (mg/dL) × fasting glucose (mg/dL)/2]. 8 Recognized as a simple and cost-effective biomarker of IR and overall metabolic health, the TyG index has gained increasing attention in recent years. 9 Its superiority in identifying IR has also been reported in multiple studies. 10
In addition, from an economic point of view, the TyG index is more cost-effective for evaluating IR than other methods, as triglycerides (TG) and glucose are basic parameters of health check-ups in many countries, which means the TyG index is more accessible in developing nations than the HOMA-IR.6,11
On the contrary, a strong association has been found between central obesity, also known as visceral obesity, and insulin sensitivity. 12 Recently, the visceral adiposity index (VAI), a mathematical model related to IR, has been introduced. This index is based on anthropometric parameters such as body mass index (BMI) and waist circumference (WC), as well as metabolic markers including TG and high-density lipoprotein cholesterol (HDL-C).12–14 However, the relationship between VAI and the TyG index as a metabolic risk factor has not yet been fully characterized. 15
The objective of this study was to evaluate the association between the TyG index, visceral adiposity, and IR in young populations.
Materials and Methods
A total of 209 young individuals from the Guadalajara Metropolitan Area (ZMG), Mexico, aged between 18 and 25 years, were recruited. Participants were invited through an open call and were included if they met the age criteria (18–25 years) and did not have any conditions that could interfere with insulin metabolism, such as previous diagnosis of polycystic ovary syndrome. The study was conducted in accordance with the guidelines established by the Regulations of the General Health Law on Research in Mexico, as well as the ethical principles outlined in the Helsinki Declaration (2008).
Clinical assessments
The selected participants completed a medical history questionnaire and underwent anthropometric and physiological measurements, including height, weight, WC, and blood pressure, as well as blood sample collection for biochemical determinations.
Body weight and height were measured using a TANITA 30A scale, which automatically calculates BMI.
Biochemical analysis
Blood samples were separated into two aliquots for biochemical determinations.
The first aliquot was used to determine glucose, total cholesterol, TG, and HDL-C. These biochemical parameters were analyzed using a wet chemistry technique on A15 Biosystems equipment.
The TyG index was calculated using the following formula:
A TyG index ≥8.8 was considered indicative of high IR risk. 11
The second aliquot was used for insulin quantification using an ELISA technique. IR was determined using the HOMA-IR formula, with a cut-off point >2.5 used to classify individuals as insulin-resistant. 18
Statistical analysis
Descriptive statistics were performed, reporting frequencies, means, and standard deviations (mean ± SD). The Student’s t-test was used for comparisons between groups. To assess the association between variables, a Chi-square test was performed to calculate the odds ratio (OR). All statistical analyses were conducted using Statgraphics Centurion 19.
Results
A total of 209 young individuals were included in the study, of whom 23 (11.0%) had an elevated TyG index (≥8.8), while 186 (89.0%) were classified as having a normal TyG index.
The participants were categorized in normal and elevated TyG index groups using a cutoff point of ≥8.8 and the comparison between them is shown in Table 1. Participants with an elevated TyG index had significantly higher values of BMI (P = 0.0037), systolic blood pressure (P = 0.0027), WC (P = 0.0005), glucose (P = 0.0002), cholesterol (P < 0.0001), TG (P < 0.0001), insulin (P = 0.0155), HOMA-IR (P = 0.0067), VAI (P < 0.0001), and DAI (P < 0.0001) compared with the normal TyG index group. In contrast, HDL-C levels were significantly lower in the elevated TyG index group (P = 0.0034). No statistically significant differences were observed in diastolic blood pressure (P = 0.0919).
Anthropometric and Metabolic Differences Between Normal and Elevated Triglyceride-Glucose Index Groups
Mean ± standard deviation. Student’s t-test, a P value of <0.05 was considered significant. aStatistical differences.
SBP, systolic blood pressure; DBP, diastolic blood pressure; WC, waist circumference; HDL, high-density lipoprotein; HOMA, homeostatic model assessment.
The prevalence of adiposity markers and IR was analyzed based on the TyG index. Participants were categorized into two groups: those with a normal TyG index and those with an elevated TyG index. Four key variables were assessed: IR, abdominal obesity, impaired VAI, and general obesity (defined as BMI > 30). The relative frequencies of these conditions were compared between the two groups to determine the association of the TyG index with adiposity and metabolic dysfunction; results are shown in Figure 1.

Prevalence of markers of adiposity and insulin resistance between normal and elevated TyG. A higher prevalence of IR, abdominal obesity, impaired VAI, and general obesity is observed in the group with an elevated TyG index compared with the normal TyG group. IR, insulin resistance; TyG, triglyceride-glucose index; VAI, visceral adiposity index.
A Pearson correlation analysis was performed to assess the relationship between the VAI and the dysfunctional adiposity index (DAI) with the TyG index. The results, presented in Figure 2, demonstrate a strong positive correlation between the TyG index and both adiposity indices, suggesting that higher TyG values are associated with greater visceral and dysfunctional adiposity.
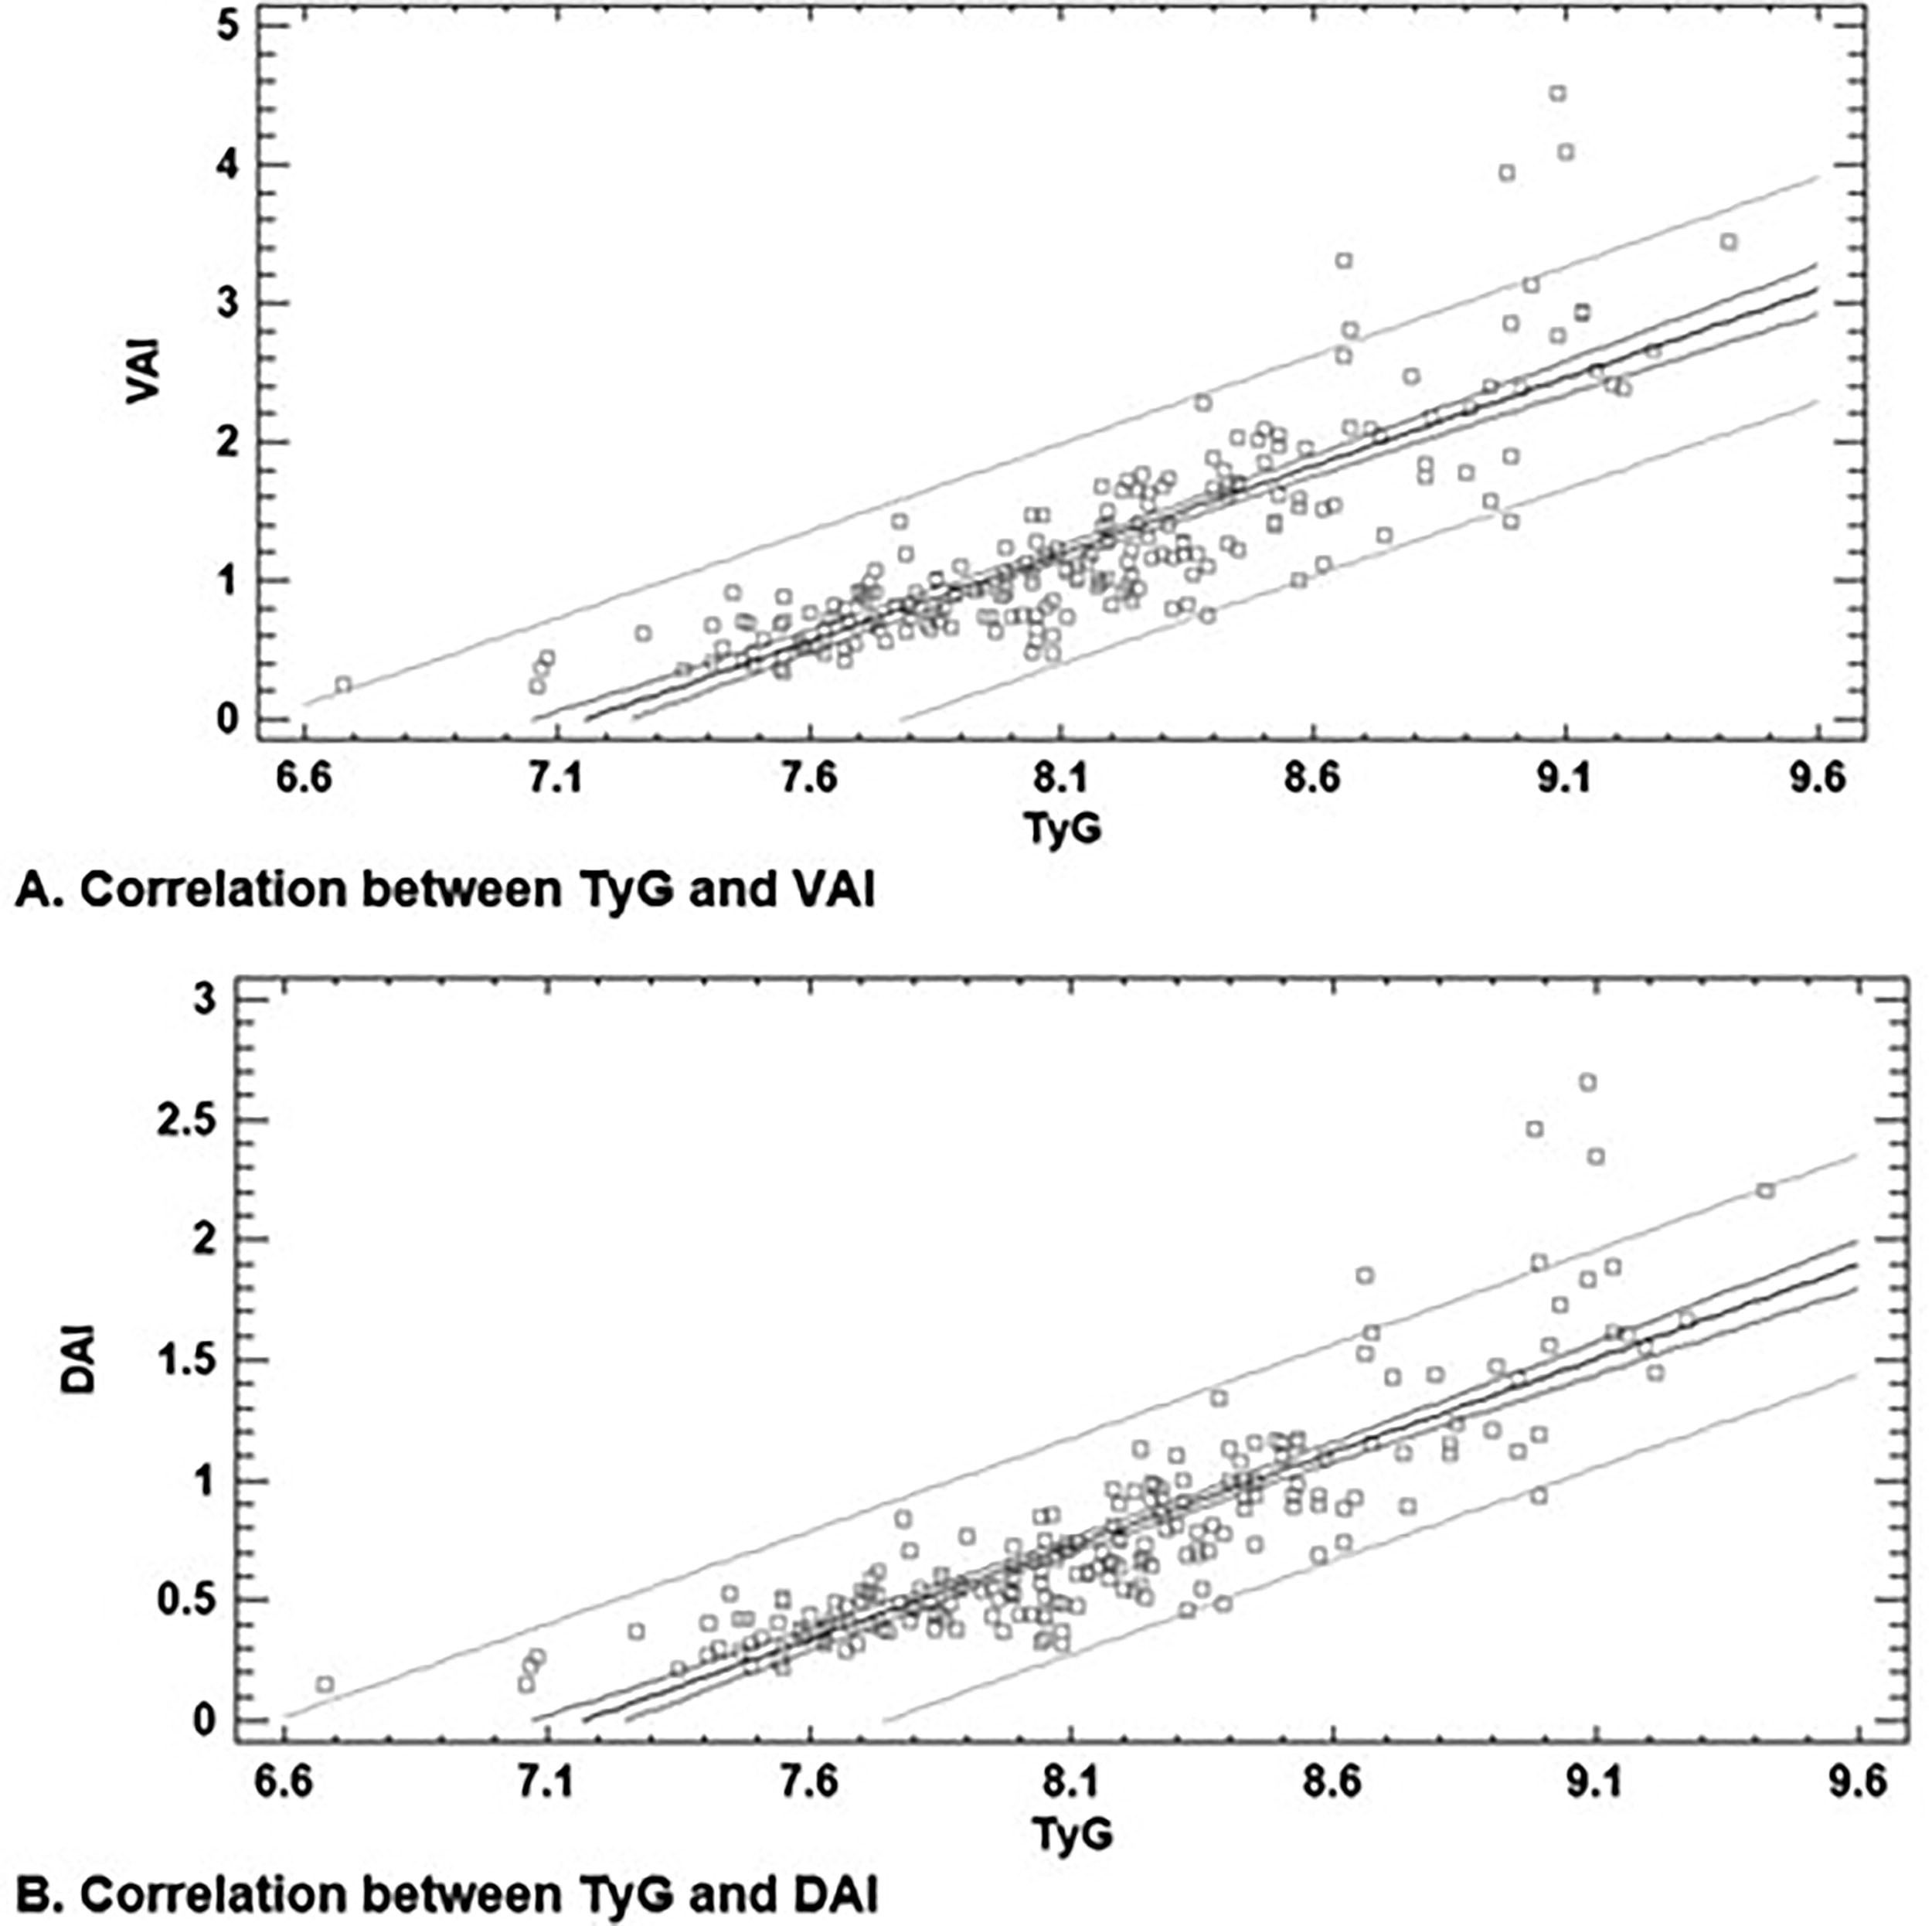
Correlation between adiposity indices and the TyG index.
The association between the TyG index and key cardiometabolic risk factors in our population was analyzed. The results, presented in Table 2, indicate a significant association between an elevated TyG index and IR (OR = 3.3458, P = 0.0078, 95% CI: 1.3743–8.1458). In addition, a strong association was observed between the TyG index and VAI (VAI: OR = 104.38, P < 0.0001, 95% CI: 22.51–483.87), as well as dysfunctional adiposity (DAI: OR = 86.07, P = 0.0032, 95% CI: 4.46–1659.11).
Association of the TyG Index with IR, VAI, and DAI
Chi-square test. P < 0.05 was considered significant.
Discussion
Our study explores the relationship between the TyG index, visceral adiposity, and IR. The findings support the growing body of evidence highlighting the TyG index as a reliable marker of IR and metabolic dysfunction.
Participants with an elevated TyG index exhibited significantly higher BMI, WC, systolic blood pressure, fasting glucose, cholesterol, TG, insulin levels, HOMA-IR, VAI, and DAI, while HDL-C levels were lower compared with those with a normal TyG index. These results align with previous studies identifying the TyG index as a surrogate marker for early metabolic impairment and cardiovascular risk, as reported by Kim et al., who observed significant differences in BMI and a strong relationship between TyG and IR.10,14
When comparing the prevalence of adiposity markers and IR between individuals with a normal and an elevated TyG index, the results indicate that an elevated TyG index is associated with a higher prevalence of IR and adiposity markers. In particular, the proportion of individuals with impaired VAI is significantly higher in the elevated TyG group, suggesting a strong relationship between visceral fat accumulation and metabolic impairment.
One of the most notable findings was the strong association between the TyG index and visceral adiposity, as reflected by the significantly higher VAI and DAI values in individuals with an elevated TyG index. This is particularly relevant, given that visceral fat accumulation is closely linked to IR and increased cardiometabolic risk. 19 The strong correlations observed in Figure 1 underscore the close association between the TyG index and adiposity markers, particularly VAI and DAI. These findings reinforce the role of the TyG index as a surrogate marker for visceral fat accumulation and metabolic dysfunction, in agreement with prior studies linking IR, dyslipidemia, and central adiposity.12,20
The R2 values of 0.704 and 0.734 indicate that a substantial proportion of the variance in VAI and DAI can be explained by the TyG index, supporting its utility as an indirect estimator of adiposity-related metabolic risk. Moreover, the highly significant P values (P < 0.001) confirm the robustness of these associations. The adjustment models suggest a linear relationship, where increases in TyG predict higher VAI and DAI values, further emphasizing its potential application in clinical and epidemiological settings for early metabolic risk assessment.
These findings are particularly relevant given the limitations of traditional methods for assessing visceral adiposity, such as imaging techniques, which are costly and not widely accessible. The TyG index, in combination with VAI and DAI, may provide a practical, cost-effective alternative for identifying individuals at higher risk of metabolic disorders.
The correlation analysis between TyG index and VAI further reinforces this relationship, suggesting that the TyG index could serve as a valuable and accessible marker for assessing visceral adiposity and its metabolic consequences.
In addition, the OR analysis demonstrated a significant association between an elevated TyG index and IR (OR = 3.3458, p = 0.0078), confirming previous reports suggesting that TyG is a useful alternative to HOMA-IR for detecting IR (Vega-Ponce, 2023). IR is a fundamental pathophysiological alteration implicated in the development of a wide range of metabolic, cardiovascular, and endocrine disorders. 3
The exceptionally high ORs observed for VAI (OR = 104.38, p < 0.0001) and DAI (OR = 86.07, p = 0.0032) suggest that adipose tissue dysfunction and visceral fat accumulation play a crucial role in metabolic disturbances, reinforcing the need for early identification and intervention in at-risk populations.
Despite these significant findings, this study has some limitations. Its cross-sectional design prevents the establishment of causality, and although the sample is representative of the young population, generalizability may be limited. In addition, gold-standard techniques for assessing insulin sensitivity, such as the hyperinsulinemic-euglycemic clamp, were not used due to feasibility constraints. However, the strong correlations observed with established metabolic markers support the utility of the TyG index as a surrogate for IR and visceral adiposity. Given these considerations, longitudinal studies are necessary to determine whether these associations persist over time and to establish causal relationships between TyG, visceral adiposity, and IR.
Conclusions
In summary, our results suggest that the TyG index is strongly associated with visceral adiposity and IR in young individuals, reinforcing its role as a potential screening tool for early metabolic dysfunction. Further longitudinal studies are needed to confirm the predictive value of the TyG index for future metabolic disorders and cardiovascular risk.
Ethical Disclosures
This study was evaluated by an ethical committee in our work center with the approval number CBI-002-2023. Confidentiality of data: The authors declare that they have followed the protocols of their work center on the publication of patient data. Right to privacy and informed consent: The authors have obtained the written informed consent of the patients or subjects mentioned in the article. The corresponding author is in possession of this document.
Footnotes
Data Availability
Further data are available from the corresponding author on reasonable request.
Authors’ Contributions
All the authors declared that they have read and approved the article. The contribution of each author is as follows: C.E.G.S.: Supervision, conceptualization, project administration, writing—original draft. R.L.U.N.: Methodology, formal analysis, data curation, writing—review and editing. Corresponding author. C.V.M.T.: Conceptualization, investigation, writing—review and editing. L.A.M.G.: Investigation, data curation, writing—review and editing. S.J.S.J.: Investigation, resources, writing—review and editing. M.Z.R.: Validation, visualization, writing—review and editing. M.G.G.S.: Conceptualization, resources, writing—review and editing.
Author Disclosure Statement
The author(s) declared no potential conflicts of interest with respect to the research, authorship, and/or publication of this article.
Funding Information
This work was fund by the Universidad de Guadalajara to the program “Apoyo a Cuerpos Académicos (PIFI 2022–2024), academic secretariat of CUCEI, [Tamizaje para evaluar el control metabólico en una población joven aparentemente Saludable] of the CA UDG-156 Fisiología y Toxicología.