
Abstract
Background:
Diabetic nephropathy (DN) is traditionally diagnosed based on urinary albumin-to-creatinine ratio (ACR) and estimated glomerular filtration rate (eGFR). Newer biomarkers, such as urinary cystatin C, neutrophil gelatinase-associated lipocalin (NGAL), interleukin (IL)-18, and angiotensinogen, may offer better prediction of renal dysfunction in diabetes without hypertension.
Methodology:
This 30-month prospective study followed 55 type 2 diabetic patients without hypertension. Urinary NGAL, cystatin C, angiotensinogen, and IL-18 were assessed at baseline, 12, 18, and 30 months to determine their predictive value for progression of renal disease and the trends of the progression of biomarkers. Biomarker levels were correlated with changes in urine ACR and eGFR. Statistical analyses included Pearson’s correlation and linear regression to identify significant predictors.
Results:
The study cohort had a mean age of 48.93 years, with 60% being male. The mean eGFR at baseline was 111.8 mL/min/1.73m2, and urine ACR significantly increased over 30 months (52.2 mg/g to 111.7 mg/g, P = 0.013). Urinary cystatin C showed the strongest correlation with ACR progression (r = 0.6814, P < 0.0001), explaining 46.4% of the variance. IL-18 also correlated with ACR changes (r = 0.4245, P = 0.0012). In contrast, NGAL and angiotensinogen did not significantly predict ACR progression or eGFR decline. Elevated HbA1c levels were associated with worsening albuminuria (r = 0.2833, P = 0.0361).
Conclusions:
Urinary cystatin C and IL-18 are strong early predictors of albuminuria progression in type 2 diabetic patients without hypertension. NGAL and angiotensinogen did not show predictive value for early renal decline. Further large-scale studies are needed to validate these findings and refine biomarker-driven approaches to DN management.
Introduction
Diabetes mellitus (DM) is the leading cause of end-stage kidney disease (ESKD) globally, accounting for 40% of cases. Approximately 30%–40% of DM patients develop renal complications, significantly increasing cardiovascular disease risk. 1 Diabetic nephropathy (DN) typically progresses through stages: hyperfiltration, microalbuminuria, macroalbuminuria, declining glomerular filtration rate (GFR), and ultimately ESKD. 2 Its complex pathogenesis involves advanced glycation end products, hemodynamic changes, renin angiotensin aldosterone synthesis (RAAS) activation, oxidative stress, inflammation, and fibrosis. While earlier studies focused on metabolic and hemodynamic factors, ongoing research highlights crucial role on inflammation.3,4
Microalbuminuria is usually the earliest detectable sign of renal damage; however, significant injury may already have occurred. 5 Monitoring albuminuria has limitations, as factors such as exercise, infections, illness, and surgery can influence levels. Moreover, 20%–40% of patients may experience declining renal function without albuminuria.6,7 These challenges highlight the need for novel biomarkers to detect and predict renal disease earlier. This is crucial given the availability of therapeutic agents—such as RAAS inhibitors, sodium-glucose co-transporter 2 inhibitors, nonsteroidal mineralocorticoid receptor antagonists, and glucagon-like peptide-1 agonists, which can reverse or slow disease progression if used early.
Inflammation is linked to proteinuria and renal dysfunction in DM.8,9 Macrophages, T cells, and inflammatory cytokines contribute to this process. Interleukin-18 (IL-18) is specifically associated with DN.10,11 Elevated IL-18 levels predict DN onset (12); urinary and serum IL-18 correlate with renal injury progression and early dysfunction in type 1 and type 2 DM.12,13 Urinary neutrophil gelatinase-associated lipocalin (NGAL) and cystatin C are elevated in DM patients without microalbuminuria, predicting renal dysfunction.14–17 Urinary angiotensinogen, indicating intrarenal RAAS activation, is another biomarker associated with renal disease progression in diabetic patients.18–20
Most DM patients develop hypertension and cardiovascular diseases; hypertension may be an early sign of renal involvement. Estimating urinary biomarkers may offer a noninvasive method to monitor diabetic kidney disease progression, especially early before development of hypertension or cardiovascular disease.
Present study aimed to assess the progression of renal disease in patients with type 2 DM and early stages of renal involvement (either hyperfiltration or microalbuminuria) without hypertension by evaluating four urinary biomarkers: NGAL (a marker of renal injury), cystatin C (a marker freely filtered and metabolized by the proximal tubule), IL-18 (a marker of inflammation), and angiotensinogen (a marker of intrarenal RAAS activation). By analyzing these levels over time, we sought to determine their utility in predicting the progression of albuminuria and early renal dysfunction in this patient population.
Methodology
This was a single center prospective studied conducted over 30 months at Atal Bihari Vajpayee Institute of Medical Sciences and Dr. Ram Manohar Lohia Hospital, New Delhi, India. The study was approved by the Institute Ethics Committee and written informed consent was obtained from each participant.
Screening and data collection
All consecutive T2DM patients aged above 30 years attending the outpatient departments of Nephrology, Internal Medicine, and Endocrinology, were screened for eligibility of the study. Those patients who were deemed to be having early DN i.e., a) either hyperfiltration: as defined as estimated glomerular filtration rate (eGFR) of >120 mL/min/1.73m2 with any levels of albuminuria or b) microalbuminuria: as defined as eGFR 90-120 mL/min/1.73m2 with urine albumin-to-creatinine ratio (ACR) 30–300 mg/g. The exclusion criteria were presence of hypertension, recurrent urinary tract infections, thyroid diseases, renal stone diseases, pregnancy, glomerular diseases, taking immunosuppression or post-renal transplant and eGFR <90 mL/min/1.73m2. Hypertension was defined as either SBP ≥ 130 mmHg or DBP ≥ 90 mmHg or taking any antihypertensives. eGFR was calculated using the CKD-EPI creatinine-based equation. Blood samples for analysis were collected at every 6 months and urine samples were collected at baseline, 12, 18, and 30 months. Urine samples were collected in Eppendorf tubes and stored at −20°C. The methods of urine biomarker examination have been detailed in our earlier study. 21
Statistical analysis
Baseline characteristics were summarized using counts and percentages for categorical variables and means and standard deviations for continuous variables. Parametric paired t-tests were used to compare variables at the baseline (biomarkers, eGFR, urine ACR) and end of follow-up for continuous variables. The Pearson correlation coefficients (r) were computed to assess the magnitude and direction of the relationships between baseline biomarkers (such as IL-18, NGAL, urinary cystatin C, and angiotensinogen) and variations in urine ACR and eGFR. Quantitative analysis of the correlation between baseline biomarker levels and changes in eGFR and urine ACR was conducted using linear regression models. The Friedman test was employed to evaluate the temporal patterns in biomarker levels obtained at several time intervals (baseline, 12 months, 18 months, and 30 months). This nonparametric test was selected as a result of the repeated measures of the data. All statistical analyses were performed using SPSS version 23.0 and R version 4.0.3. P-values below 0.05 were regarded as indicating statistical significance.
Results
A total of 952 T2DM patients were screened, and 120 patients were initially included in our previous study of 1 year duration. 21 The present study cohort comprised of 55 patients who had complete data available at baseline and during the 30-month follow-up period. Consort diagram of the study is shown in Figure 1. The mean age of the cohort was 48.93 years with 60% being males and about 38% had duration of diabetes for ≥5 years. The mean hemoglobin A1c (HbA1c) and eGFR at baseline were 7.84% and 111.8 mL/min/1.73 m2. The mean arterial pressure (MAP) was 91 mmHg. The baseline and end of the study characteristics of the cohort is shown in Table 1. The mean eGFR decline over the study period was 1.02 ± 8.43 mL/min/1.73 m2. The range of eGFR change was substantial, with some patients experiencing a decline as great as 30.95 mL/min/1.73 m2, while others showed an improvement of up to 20.05 mL/min/1.73 m2 (probably indicating a shift to the hyperfiltration spectrum). The median change was 0.00 mL/min/1.73 m2, suggesting that a significant proportion of the cohort maintained stable kidney function. The proportion of patients who experienced an eGFR decline of ≥5 mL/min/1.73 m2 at 30 months was 14.55%.

Consort diagram of the study.
Demographic Characteristics and Laboratory Parameters at Baseline and at the End of the 30-Month Follow-Up
BP, blood pressure; eGFR, estimate glomerular filtration rate; ACR, albumin-to-creatinine ratio; NGAL, neutrophil gelatinase-associated lipocalin.
The mean urine ACR increased from a baseline value of 52.2 ± 83.4 mg/g to 111.7 ± 218.4 mg/g at the end of the follow-up, resulting in a mean change of 59.4 ± 172.1 mg/g. The median change in urine ACR was 7.3 mg/g, with a range from a minimum of −35.9 mg/g to a maximum of 1081.1 mg/g.
Association between baseline biomarkers and eGFR decline
We investigated the predictive value of baseline biomarkers IL-18, NGAL, urinary angiotensinogen, and urinary cystatin for eGFR decline over the follow-up period and found that none of these biomarkers showed a statistically significant association with eGFR decline. IL-18 had a weakly negative correlation with eGFR decline (r = −0.149, P = 0.278), explaining only 2.2% of the variance (R2 = 0.022). NGAL exhibited a weak positive correlation (r = 0.090, P = 0.497), explaining just 0.8% of the variance (R2 = 0.008). Angiotensinogen also had a weak positive correlation (r = 0.150, P = 0.276), accounting for 2.3% of the variance (R2 = 0.023). Similarly, Cystatin showed a weak positive correlation (r = 0.135, P = 0.326), explaining 1.8% of the variance (R2 = 0.018). In all cases, the regression coefficients were nonsignificant, indicating no meaningful predictive value for eGFR decline from these biomarkers at baseline.
Association between baseline biomarkers and urine ACR change
The analysis of changes in urinary ACR revealed significant associations with baseline levels of IL-18 and urinary cystatin C. IL-18 was moderately correlated with changes in urinary ACR (r = 0.4245, P = 0.0012), accounting for 18% of the variance (R2 = 0.180). The regression analysis showed a significant positive effect of IL-18 on ACR change (β = 0.0005, P = 0.0012). Urinary cystatin C demonstrated a stronger correlation (r = 0.6814, P < 0.0001), explaining 46.4% of the variance in ACR (R2 = 0.464), with a highly significant regression coefficient (β = 0.9845, P < 0.0001).
In a multivariate linear regression model that included both IL-18 and cystatin C, both biomarkers were significantly associated with changes in ACR. IL-18 had a regression coefficient of β = 0.0003 (P = 0.021), while cystatin C had a coefficient of β = 0.8795 (P < 0.001). The interaction between IL-18 and cystatin C was also significant (β = 0.003, P < 0.001), indicating a combined effect of these biomarkers on ACR. This model explained 49.8% of the variance in ACR, and there were no indications of multicollinearity between the predictors (Fig. 2).

3D regression plot showing the association between change in urine albumin-to-creatinine ratio (ACR) and baseline levels of interleukin (IL)-18 and cystatin C.
Pairwise correlation analysis showed a significant relationship between IL-18 and cystatin C at baseline, suggesting some overlap in the information provided by these markers. However, no significant correlations were found between these two biomarkers and other markers, such as urinary NGAL or angiotensinogen, which in turn did not show any meaningful associations with changes in ACR (Fig. 3).

Correlation matrix of biomarkers with estimated glomerular filtration rate decline and urine ACR change.
In addition, an exploratory analysis examined whether changes in mean blood pressure (BP) and HbA1c were associated with changes in urine ACR. An increase in HbA1c was significantly correlated with significant increase in urine ACR (r = 0.2833, P = 0.0361), explaining 8.0% of the variance (R2 = 0.080) and yielding a significant regression coefficient (β = 0.0236, P = 0.0361). Although the association between changes in mean BP and urine ACR was not statistically significant (r = 0.2535, P = 0.0618), it exhibited a positive trend, accounting for 6.4% of the variance (R2 = 0.064). Changes in urinary angiotensinogen showed a positive correlation with an increase in mean BP (r = 0.134, P = 0.039).
Trends of IL-18, NGAL, cystatin C and angiotensinogen over the study period
We conducted a longitudinal analysis of NGAL, IL-18, angiotensinogen, and cystatin C levels at four time points: baseline, 12 months, 18 months, and 30 months (Fig. 4). The Friedman test identified statistically significant increasing trends for all four biomarkers. Specifically, angiotensinogen and cystatin C levels demonstrated a relatively linear increase over time, whereas NGAL and IL-18 levels exhibited more erratic fluctuations.
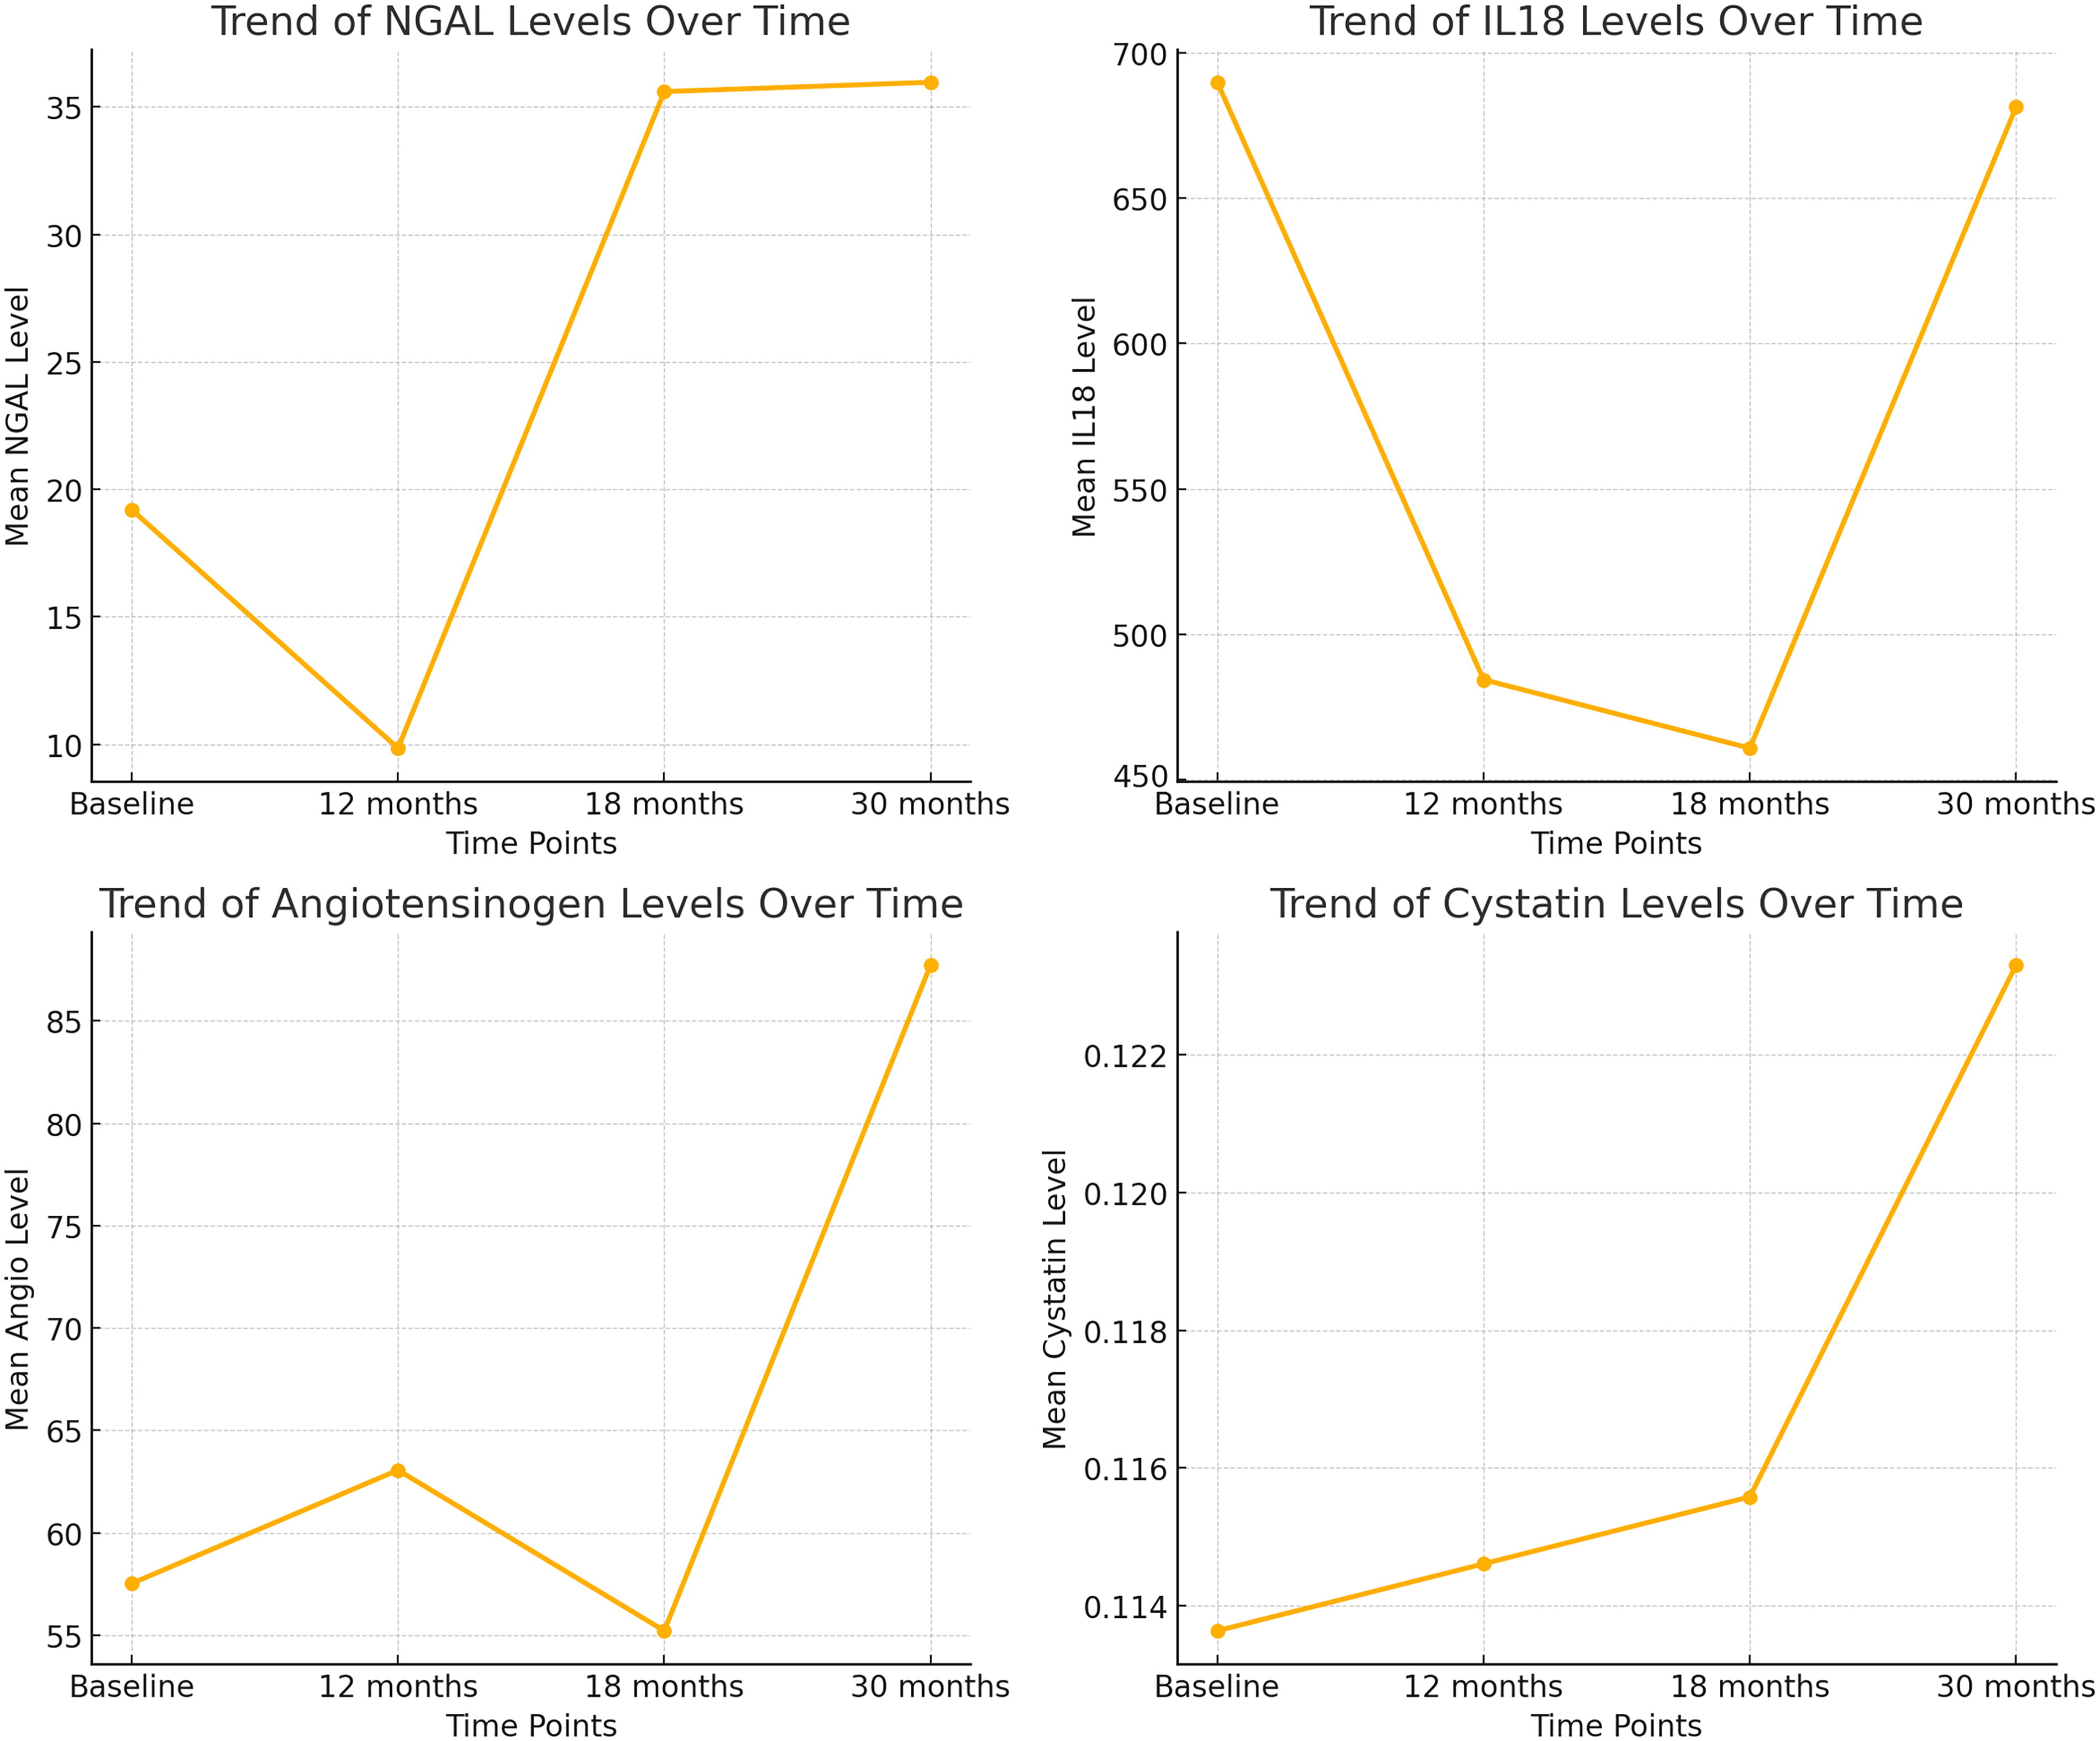
Trends of the biomarkers over time.
Discussion
In this prospective study of patients with type 2 DM who had early features of DN and were free from hypertension, we found that baseline urinary levels of IL-18 and cystatin C were positively correlated with the progression of albuminuria over a 30-month period. Both biomarkers exhibited a significant linear correlation with the increase in urinary albumin-to-creatinine ratio (UACR) during the follow-up. Cystatin C exhibited a stronger association and a steady temporal increase, in contrast to IL-18. The findings indicate that urinary cystatin C may function as a more effective early biomarker for forecasting the progression of albuminuria in this patient cohort.
Our findings corroborate prior research that emphasizes the potential of urine cystatin C and IL-18 as early biomarkers of renal impairment in diabetes individuals. Nakamura et al. identified substantial positive correlations between urine cystatin C and urinary albumin excretion rate in Japanese diabetic patients. 13 Hassan et al. similarly discovered a correlation between urine cystatin C levels and albuminuria. 22 Moriwaki et al. identified a significant association between serum IL-18 levels and microalbuminuria in type 2 DM. 23 The suggested process entails oxidative damage resulting in heightened systemic inflammation, perhaps elevating IL-18 levels.
Our investigation validated the association between these biomarkers and the progression of albuminuria, with cystatin C identified as a more dependable predictor owing to its constant temporal increase. This indicates that cystatin C may possess more sensitivity in identifying early renal alterations prior to the onset of substantial glomerular damage. The sustained increase in cystatin C may indicate continuous tubular dysfunction or injury, occurring prior to inflammatory damage as evidenced by IL-18 levels.
Conversely, we did not observe a significant association between baseline urine concentrations of NGAL and angiotensinogen and the advancement of albuminuria. Our results contrast with those of Satirapoj et al., who documented elevated urine angiotensinogen levels in diabetic patients exhibiting different levels of albuminuria. 18 This disparity could be explained by variations in the study populations, including the fact that our cohort was made up only of people with normotension, while their study included hypertension patients (about 96% of patients). The study by Sawaguchi also showed a significantly raised urinary angiotensinogen level in type 2 DM with microalbuminuria than in those with normoalbuminuria. 19 However, in this study also there was a significant difference in the mean SBP (135 vs. 144 mmHg, P < 0.01) and DBP (77 vs. 81 mmHg, P < 0.01) between these two groups. Urinary angiotensinogen levels in our cohort also continuously rose during the follow-up period and had a significant correlation with increase in MAP. This suggests that urine angiotensinogen may more accurately represent intrarenal renin-angiotensin-aldosterone system (RAAS) activation instead of serving as a direct indicator of albuminuria development.
The UACR in our cohort experienced a substantial increase from a mean of 52.2 mg/g to 111.7 mg/g during the 30-month follow-up. An exploratory analysis demonstrated a significant correlation between the progression of proteinuria and the deterioration of glycosylated HbA1c levels. This emphasizes the significance of optimal glycemic control in the prevention of the progression of DN. Despite the fact that patients with more severe proteinuria exhibited a higher mean blood pressure, this correlation did not reach statistical significance, possibly as a result of the small sample size.
A significant change in the eGFR was not observed during the study period, which is to be expected as the study duration was for a relatively short duration and considering the early stage of the disease. As a result, none of the urinary biomarkers exhibited a significant correlation with or predictive value for variations in eGFR. While urinary biomarkers increased significantly from baseline to the end of the trial, only NGAL and cystatin C showed a linear increase over time, indicating their potential utility in monitoring renal function over long durations.
The strengths of our study include the relatively long follow-up duration of 30 months and the collection of urinary samples at four time points. By documenting temporal changes in biomarker levels and their association with clinical outcomes, this longitudinal approach enhances the validity of our findings. The majority of prior research on this subject has been cross-sectional, which has restricted its capacity to evaluate progression over time.
Nevertheless, our study is subject to certain limitations. The small sample size of 55 patients may reduce the generalizability of our results and limit the statistical power to detect significant associations, especially regarding blood pressure correlations. In addition, there was a paradoxical worsening of HbA1c levels in our cohort. This may be due to selection bias, as only patients with samples at all four time points were included. It is plausible that those who maintained regular visits were patients struggling to achieve glycemic targets, thereby skewing the results toward poorer glycemic control. Other drawbacks were usage of eGFR to categorize patients in the hyperfiltration stage rather than the gold standard of measured GFR and lack of renal biopsy.
In conclusion, our study suggests that urinary cystatin C is a promising early biomarker for predicting the progression of albuminuria in patients with type 2 DM without hypertension. While IL-18 levels also correlated with albuminuria progression, cystatin C demonstrated a more significant and consistent association over time. Urinary angiotensinogen appears to be more related to intrarenal RAAS activation, hemodynamic and blood pressure changes rather than directly predicting albuminuria progression. Further large-scale studies are warranted to validate these findings and explore the mechanisms underlying differential roles of these biomarkers in DN.
Footnotes
Authors Contributions
All authors contributed to the study conception and design. Material preparation, data collection, and analysis were performed by H.S.M., B.K., and A.K. The first draft of the article was written by R.B. and all authors commented on previous versions of the article. All authors read and approved the final article.
Ethical Approval
Approval was obtained from the institutional ethics committee of ABVIMS & Dr RML Hospital via File No.2/2010/IEC/ABVIMS?RMLH dated 25-05-2021. The procedures used in this study adhere to the tenets of the Declaration of Helsinki.
Informed consent was obtained from all individual participants included in the study.
Data Availability
The datasets generated during and/or analyzed during the current study are available from the corresponding author on reasonable request.
Author Disclosure Statement
The authors have no relevant financial or nonfinancial interests to disclose.
Funding Information
This study was funded by Indian Council of Medical Research (ICMR) Vide Project Number: 5/4/7-7/13/NCD-II.