
Abstract
This study was designed to investigate the role of aquaporin 1 (AQP1) in ferroptosis, macrophage polarization, mitochondrial dysfunction, and impaired autophagy of lipopolysaccharide (LPS)-stimulated RAW264.7 cells and explored the underlying mechanisms. Si-AQP1-mediated AQP1 silencing RAW264.7 cells was constructed. Si-P53-mediated P53 silencing or pcDNA-P53 overexpression RAW264.7 cells was constructed. Assays of ATP, reverse transcription-quantitative polymerase chain reaction (RT-qPCR), and Mitochondrial membrane potential (JC-1) staining were performed to evaluate mitochondrial biological function. Assays of flow cytometry, reactive oxygen species (ROS) staining, western blot (WB), RT-qPCR, malondialdehyde (MDA), glutathione (GSH), and total superoxide dismutase (SOD) were performed to detect cell ferroptosis, macrophage polarization, and impaired autophagy. The involvement of the P53 pathway was revealed by WB. The results showed that LPS (30 μg/mL) could induce ferroptosis, M1 polarization, mitochondrial dysfunction, and autophagy damage in RAW264.7 cells. Meanwhile, the expression of AQP1 was increased and the expression of P53 was decreased. In addition, Pifithrin-α (PIF; 15 μM), a P53 inhibitor, significantly aggravated ferroptosis, M1 polarization, mitochondrial dysfunction, and autophagy damage as well as up-regulation of AQP1 protein expression in LPS-induced RAW264.7 cells. Interestingly, this phenomenon was markedly alleviated by Kevetrin hydrochloride (70 μM), a P53 agonist. Mechanistically, silencing AQP1 significantly alleviated ferroptosis, M1 polarization, mitochondrial dysfunction, and autophagy damage by up-regulating the expression of P53 in LPS-stimulated RAW264.7 cells. Indeed, inhibition of P53 expression by PIF treatment dramatically reversed this effect on the basis of LPS+si-AQP1. Therefore, we concluded for the first time that AQP1 can promote ferroptosis, M1 polarization, mitochondrial dysfunction, and autophagy impairment by inhibiting the expression of P53 in LPS-stimulated RAW264.7 cells, and AQP1 or P53 may be considered as a crucial determiner that can regulate the biological behavior of RAW264.7 cells stimulated by LPS.
Introduction
Ferroptosis is a new type of iron-dependent non-programmed cell death discovered by Brent. R. Stockwell laboratory of Columbia University in 2012, which is induced by excessive accumulation of lipid peroxide (Dixon et al., 2012). Its morphological characteristics, mode of action, and molecular mechanism are completely different from other programmed cell death processes (Dixon et al., 2012). This novel finding breaks with the traditionally known forms of cell death, which mainly include apoptosis, necrosis, or autophagy (Dixon et al., 2012).
This is in contrast to the morphological and biological changes that occur during apoptosis, necrosis, and autophagy. First, morphologically, there are neither apoptotic vesicles nor autophagosome nor chromatin granule coalescence, cell crumpling, or membrane rupture throughout the ferroptosis process (Dixon et al., 2012; Chen et al., 2020b), which is very different from the classical way of cell death.
Second, biochemically, ferroptosis is mainly manifested by intracellular iron accumulation and peroxidation of polyunsaturated fatty acids, which promote cell membrane lipid peroxidation leading to disruption and ultimately cell death (Dixon et al., 2012; Stockwell et al., 2017). Therefore, intracellular iron accumulation and lipid peroxidation are considered to be important contributors to ferroptosis (Dixon et al., 2012; Chen et al., 2020b).
Further, iron chelators (e.g., desferrioxamine) and lipid peroxidation-like inhibitors (e.g., ferrostatin-1 [Fer]) are effective in inhibiting ferroptosis, respectively, and thus rescuing cell biological functions (Dixon et al., 2012; Cao and Dixon, 2016). However, ferroptosis cannot be inhibited by inhibitors of apoptosis, autophagy, or necrosis (Dixon et al., 2012; Cao and Dixon, 2016).
These results suggest that ferroptosis is a novel cell death process independent of apoptosis, autophagy, and necrosis (Dixon et al., 2012). At present, ferroptosis has been reported to be concerned with numerous physiological and pathological processes, together with cancer, neurodegenerative diseases, tissue ischemia/reperfusion injury, and immune reaction (Stockwell et al., 2017; Chen et al., 2020b).
Aquaporin 1 (AQP1), a member of the aquaporin family with a molecular weight of 28 kDa, is involved in regulating the inflow and outflow of water to maintain the intracellular and extracellular water balance (Nielsen et al., 2002). So far, 13 aquaporins have been found, which are distributed in various tissues and organs of the mammalian and participate in the occurrence and development of various diseases (Hua et al., 2019).
Recently, accumulating pieces of evidences have shown that AQP1, in addition to controlling intracellular and extracellular water balance and homeostasis, can also be necessary and indispensable in a variety of biological processes such as macrophage polarization, inflammation, as well as oxidative stress, proliferation, and migration of epithelial cells (Hara-Chikuma and Verkman, 2006; Galan-Cobo et al., 2016; Li et al., 2019; Chen et al., 2020a; Maltaneri et al., 2020). Zhou et al. (2021). demonstrated that Lentivirus-mediated AQP1 overexpression promoted tumor necrosis factor-α (TNF-α)-stimulated (fibroblast-like synoviocytes) MH7A cells to convert from G0/G1 phase to S phase and inhibited cell apoptosis by activating Wnt/β-catenin signaling pathway, as evidenced by increased mitochondrial membrane potential and Bcl-2 protein levels as well as decreased Bax and cleaved caspase 3 protein levels.
Moreover, Li et al. (2019) showed that AQP1 protein expression was significantly increased in RAW264.7 cells induced by lipopolysaccharide (LPS). Most importantly, increased AQP1 expression attenuated inflammation and M1 polarization by inhibiting the P38 MAPK signaling pathway in LPS-induced RAW264.7 cells (Li et al., 2019). Moreover, AQP1 is also closely related to mitochondrial function and reactive oxygen species (ROS) level.
Liu et al. (2018). found that mitochondrial oxidative stress was involved in the regulation of aquaporin expression in obstructive kidney disease. However, it is still unclear whether AQP1 plays an important role in the regulation of ferroptosis and needs further exploration in the future.
P53 is a tumor suppressor protein that plays an important role in tumor pathogenesis (DeLeo et al., 1979; Kruiswijk et al., 2015). P53 mainly as a transcription factor, activating or inhibiting the transcription of a variety of downstream genes, and its expression changes and state stability are consistent with a variety of reversible post-translational modifications (Kruiswijk et al., 2015).
P53 undergoes rapidly transcriptional modifications to actively regulate cellular biological functions and prevent damage from spreading and amplification when cells are subjected to numerous external/internal stimuli or stresses, including DNA damage, oncogene expression, hypoxia, ROS, and nutrient deprivation (Zhang et al., 2014; Kruiswijk et al., 2015). For example, P53 is rapidly activated and stably expressed after DNA damage to promote cell cycle arrest, repair damaged DNA, and prevent the inheritance of defective DNA (Kruiswijk et al., 2015).
In addition, P53 gene mutations or other mechanisms, including amplification and/or overexpression of P53 negative regulators such as MDM2 and MDM4, allow P53 to be induced and/or rapidly undergo post-translational modifications stabilization and activation to be disrupted, which is an indispensable condition for the progression of many human tumors (Kastenhuber and Lowe, 2017; Zhang et al., 2020). In 2015, Jiang research team (Jiang et al., 2015) reported for the first time that solute carrier family 7 member 11 (SLC7A11), a crucial component of cystine/glutamate antiporter, is a direct target of P53-mediated transcriptional repression, and that high levels of ROS can activate P53 to inhibit cystine uptake by inhibiting the expression of SLC7A11, thus sensitizing cells to ferroptosis.
Subsequently, increasing research has shown that P53 inhibits tumor progression by promoting ferroptosis of cancer cells (Kang et al., 2019). Especially, the accumulation of mutant P53 protein in cancer cells makes cancer cells more sensitive to ferroptosis (Kang et al., 2019). Interestingly, Schuoler et al. (2017) and Liu et al. (2019) found in a mouse model of pulmonary hypertension that the up-regulation of AQP1 expression and the reduction of P53 expression in pulmonary artery smooth muscle cells promoted the proliferation and migration of smooth muscle cells, leading to strong pulmonary artery stenosis and aggravating disease progression. This result suggests a potential interaction mechanism between AQP1 and P53.
In this study, we revealed the effects of AQP1-regulated P53 expression on ferroptosis, macrophage polarization, mitochondrial function, and autophagy block in LPS-stimulated RAW264.7 cells, and we explored the mechanisms involved in the P53 pathway. We intended to provide direct evidence that AQP1 can regulate the biological behavior of RAW264.7 cells induced by LPS through P53 pathway.
Materials and Methods
The study protocol was approved by the Use Committee of Harbin Medical University and the experimental procedures were in accordance with the recommendations of the Guide for of Harbin Medical University.
Reagents
Dulbecco's modified Eagle's medium (DMEM) was purchased from Gibco (Beijing, China), fetal bovine serum (FBS) was purchased from Procell Life Science&Technology Co., Ltd. (Wuhan, China), and penicillin–streptomycin was purchased from Solarbio Life Sciences (Beijing, China). The antibodies used in this study were as follows: anti-AQP1 (20333-1-AP), anti-P53 (21891-1-AP) from Proteintech; anti-P-ERK (WH143281) and anti-peroxisome proliferator-activated receptor gamma coactivator 1 (anti-PGC-1α; WH186207) from ABclonal; anti-LC3I/II (ab62721), anti-nuclear factor kappa B (NF-κB) p65 (ab16502), anti-P38 (ab195049), anti-PI3K (ab191606), and anti-P62 (ab56416) from Abcam; anti-glutathione peroxidase 4 (anti-GPX4; T56959S) and anti-XCT/SLC7A11 (T57046S) from Abmart (Shanghai, China); and anti-β-actin (TA-09) from Zhongshanjinqiao (Beijing, China).
All secondary antibodies, including a goat anti-Rabbit IgG a goat anti-mouse IgG, were purchased from Affinity Biosciences (Jiangsu, China) and Abcam, respectively. LPS (Escherichia coli serotype 0111: B4, L4130) was purchased from Sigma-Aldrich (St. Louis, MO). ROS (Cat. No. S0033S) and Mitochondrial membrane potential detection kit (JC-1, Cat. No. C2003S) was supplied by the Beyotime Biotechnology (Shanxi, China).
Total Superoxide Dismutase (T-SOD, Cat. No. BL901A), Lipid Peroxidation Malondialdehyde (MDA, Cat. No. BL904A) and Reduced Glutathione (GSH, Cat. No. BL874B) content assay kit were supplied by Biosharp (Hefei, China). Pifithrin-α (PIF; HY-15484), Kevetrin hydrochloride (Keve; HY-16271), and Cell Counting Kit-8 (CCK8, HY-K0301) assay kit were obtained from MedChemExpress (Monmouth Junction, NJ, USA).
ATP (A095-1-1) content assay kit was purchased from Nanjing Jiancheng Bioengineering Institute (Nanjing, China). Inflammatory cytokine Kit (C60021) was purchased from Tianjin Kuangbo Biotechnology (Tianjin, China). Enzyme-linked immunosorbent assay (ELISA) kit (Cat. Nos. JL11718, JL 45832) was purchased from Jianglai Biological Co., Ltd. (Shanghai, China).
Cell culture
RAW264.7 cells were purchased from the Procell Life Science&Technology Co., Ltd. and incubated at 37°C in a humidified atmosphere containing 5% CO2 with DMEM-F12 medium containing 10% FBS and 1% penicillin-streptomycin. When the density of cells in the culture flask reached 70–80%, the cells were separated and passaged, and the number of cell passages was maintained within 15–20 passages.
Cell viability
RAW264.7 cells (2 × 10⁵ cells) were cultured in 96-well plates with full DMEM for 24 h to make them fully adherent. Next, different concentrations of LPS, PIF, and Keve were added into 96-well plates and cultured for 24 h at 37°C and 5% CO2 humidity, respectively. LPS and PIF were dissolved in dimethyl sulfoxide (DMSO; final concentration <0.1%) and Keve were dissolved in sterile water. After the treatment cited earlier, the old medium was discarded and 100 μL of serum-deprived RPMI 1640 medium was added for equilibration for 30 min, followed by addition of CCK8 reagent at room temperature and in the dark and incubation for 2 h at 37° C with 5% CO2 humidity. Finally, the cell viability rates were assessed by measuring the optical density at 450 nm using a microplate reader (Antu Experimental Instrument Co., LTD., Zhengzhou, China).
Cell transfection
RAW264.7 cells (2 × 10⁵ cells) were cultured in 24-well plates with full DMEM for 24 h to make them fully adherent. The medium was replaced with serum-free and antibiotic-free RPMI 1640 and cultured for 30 min at 37°C in 5% CO2 saturated humidity. Subsequently, RAW264.7 cells were transiently transfected with 100 nM small interfering-negative control RNA (si-NC), si-AQP1, si-P53, pcDNA, or pcDNA-P53 (GenePharma, Shanghai, China) for 6 h using Lipofectamine 2000 reagent (GenePharma) according to the manufacturer's instructions.
Following transfection, the cells were incubated with the PIF (P53 inhibitor) at 15 μM for 24 h and stimulated with 30 μg/mL LPS for 24 h. The total RNA and protein prepared from the RAW264.7 cells were used for reverse transcription-quantitative polymerase chain reaction (RT-qPCR) and Western blot (WB) analyses.
Superoxide dismutase and MDA analysis
Superoxide dismutase
Following treatment, the cell supernatant was discarded. RAW264.7 cells were washed twice with precooled phosphate buffered saline (PBS). Then, 200 μL superoxide dismutase (SOD) sample preparation solution was added to every sample (1 × 10⁶ cells/mL), properly blown to fully lyse the cells, centrifuged at 12,000 g for 5 min at 4°C, and the supernatant was used for subsequent determination. Next, SOD detection reagent was added according to the operating instructions, and after zero adjustment with double-distilled water at room temperature, the absorbance of each tube was measured at 560 nm using a spectrophotometer (Ningbo Jiuxing Technology Co. Ltd.).
Malondialdehyde
Following treatment, the cell supernatant was discarded. RAW264.7 cells were washed twice with precooled PBS. Nest, 100 μL PBS was added to every sample (1 × 10⁶ cells/mL), properly blown to fully lysed cells, centrifuged at 12,000 g for 10 min at 4°C, and the supernatant was used for subsequent determination. Next, MDA detection reagent was added according to the operating instructions, and after zero adjustment with double-distilled water at room temperature, the absorbance of each tube was measured at 532 nm using a spectrophotometer.
GSH analysis
Following treatment, the cell supernatant was collected and transiently centrifuged at 400 g for 30 s at room temperature. Then, GSH reagent was added to each sample as indicated in the operating instructions. Finally, the absorbance value of each sample was measured at 412 nm using a microplate reader.
ATP analysis
The cells in 12-well plates were harvested and centrifuged at 800 rpm for 3 min at room temperature to separate the cells from the supernatant, and then the supernatant was removed to obtain a sublayer of cells (typically 106 cells). The collected cells were added with 300–500 μL pre-cooled double-distilled water, placed in an ice water bath, and broken by an ultrasonic cell breaker (Ningbo Jiuxing Technology Co. Ltd.) for 1 min (the protein concentration was determined by removing the part); then, the cell suspension was boiled in boiling water for 10 min; and the cell suspension was shaken and mixed for 1 min. Next, the ATP detection reagent was then added according to the operating instructions, and after zero adjustment with double-distilled water at room temperature, the absorbance of each tube was measured at 636 nm using a spectrophotometer.
Fluorescence microscope with ROS
Flow cytometry was performed to quantify ROS levels using an ROS (PI staining and DCFH-DA staining) Kit. After cell culture and treatment, the cell culture medium in the culture plate was discarded and gently rinsed twice with sterile PBS. DCFH-DA was diluted with serum-free RPMI 1640 medium to a final concentration of 10 μM as indicated in the instruction manual of the ROS kit. One milliliter of diluted DCFH-DA was added to each sample and incubated for 20 min at 37°C in an incubator. Then, the cells were washed three times with serum-free RPMI 1640 to allow adequate removal of DCFH-DA that did not enter the cells. Finally, they were directly observed by fluorescence confocal microscopy.
Flow cytometry
Flow cytometry with Inflammatory cytokines
Flow cytometry was performed to quantify inflammatory factor levels using an Inflammatory cytokine Kit, mainly including interleukin (IL)-2, IL-4, IL-6, IL-10, and TNF-α. After cell culture and treatment, the cell supernatant was collected and transiently centrifuged at 400 g for 30 s to collect the supernatant for the next procedure. According to the operating instructions, 10 μL capture microspheres, 10 μL antibody mixture, 20 μL dilution, and 20 μL cell supernatant were added to each detection system and mixed for 2 h at room temperature with shaking.
Next, 20 μL SA-PE was added to each sample and incubated for 30 min at room temperature. Subsequently, 500 μL of buffer was added, centrifuged at 500 g for 5 min at room temperature; the supernatant was discarded; and the procedure was repeated three times. After the earlier cited procedures were completed, 300 μL buffer was added to each sample and detected under flow cytometry.
Flow cytometry with ROS levels
Flow cytometry was performed to quantify ROS levels using ROS assay kit. RAW264.7 cells were harvested and washed in ice-cold PBS twice, making a cell suspension. DCFH-DA was diluted in serum-free RPMI 1640 medium to a final concentration of 10 μM according to the instruction manual. Cells were collected and suspended in diluted DCFH-DA at a cell concentration of 106/mL and incubated in a cell incubator at 37°C for 20 min.
The mixture was reversed at intervals of 3–5 min to allow adequate contact between the probe and the cell. After the earlier cited treatment, cells were washed three times with serum-free cell culture medium to adequately remove DCFH-DA that had not entered the cells. All samples were quantitatively analyzed using a FACSC Calibur flow cytometer at 488 nm emission and 525 nm excitation (BD Biosciences, San Jose, CA) and analyzed by Cell Quest software (version 3.0; BD Biosciences).
Enhanced mitochondrial membrane potential assay with JC-1
The fluorescent, dual-emission mitochondrion-specific lipophilic, cationic dye JC-1 was used to assess the mitochondrial membrane potential according to the manufacturer's manuals. After the cells were cultured and treated, the cell culture medium in the culture plate was discarded, gently rinsed twice with sterile PBS, and then 1 mL RPMI 1640 culture medium was added to each sample. Next, according to the instruction manual, 1 mL of JC-1 staining working solution was added to each sample, mixed by shaking several times, and incubated at 37°C for 20 min.
At the end of the incubation at 37°C, the supernatant was aspirated and washed twice with JC-1 staining buffer. At the end of the wash, 2 mL RPMI 1640 culture medium was added. Finally, the cells were observed under a fluorescence microscope.
RNA extraction and RT-qPCR
The total RNA was extracted from RAW264.7 cells using RNAiso Plus reagent (Code No. 9109; Takara) according to the manufacturer's protocol. Extracted and purified total RNA (1 μg) was reverse-transcribed into complementary DNA (cDNA) using a Script cDNA Synthesis Kit (Code No. RR036A, PrimeScriptTMRT Master Mix; Takara) at 37°C for 15 min and at 85°C for 5 s. The total system of reverse transcription was 10 μL.
The real-time quantitative polymerase chain reaction (qPCR) reaction volume was 20 μL and included cDNA, dNTPs, primers, SYBR Premix Ex Taq (Perfect Real Time; Takara), and nuclease-free water. The following qPCR conditions were used: 40 cycles of denaturation at 95°C for 5 s, annealing at 60°C for 30 s, and extension at 72°C for 15 s. Results were calculated using the 2−ΔΔCt method, and each experiment was performed in triplicate. β-actin served as an internal loading control. Primer sequences used are provided in Table 1.
Primer Sequences of the Target Gene in RAW264.7 Cells
AQP1, aquaporin 1; Arg-1, arginase-1; Drp1, dynamin-related protein 1; Fizz, Resistin-like molecule alpha; IL-1β, interleukin-1β; iNOS, inducible nitric oxide synthase; Mfn2, mitofusin; OPA1, optic atrophy 1; Pink1, PTEN-induced putative kinase 1; Tfam, mitochondrial transcription factor A.
WB analysis
Following treatment, RAW264.7 cells were washed twice in cold PBS and added with pre-cooled 100 μL RIPA buffer (Solarbio Life Sciences) and 1 μL PMSF (100 mM; Solarbio Life Sciences), which was ground on ice and lysed for 30 min. Proteins in the supernatants were extracted and quantified by BCA assay. Next, 5 × loading buffer (Solarbio Life Sciences) was added to the extracted protein supernatant and boiled for 10 min and the next step was proceeded to.
After electrophoresis on 12% sodium dodecyl sulphate-polyacrylamide gel electrophoresis (SDS-PAGE) gels, the proteins were blotted to polyvinylidene fluoride (PVDF) membranes (Millipore-Upstate). After blocking in nonfat milk (5%) for 60 min at room temperature, the membranes were incubated at 4°C for 12–18 h with antibodies, including AQP1 (1:500), P53 (1:500), XCT/SLC7A11 (1:500), GPX4 (1:1000), PI3K (1:1000), P38 (1:1000), NF-κB p65 (1:1000), P62 (1:3000), LC3I/II (1:1000), P-ERK (1:500), PGC-1α (1:500), and β-actin (1:2000).
After washing three times with Tris-buffered saline with Tween 20 (TBST) at room temperature, each of 10 min, the membranes were incubated with secondary antibodies, including a goat anti-Rabbit IgG (1:10,000), a goat anti-mouse IgG (1:10,000) at room temperature for 1 h. Proteins were visualized using enhanced chemiluminescence-plus reagents (No: WB100D; NCM Biotech). The density of the bands was measured using the Image J software (version 1.45s; National Institutes of Health, Bethesda, MA), and values were normalized to the densitometric values of β-actin.
Enzyme-linked immunosorbent assay
Following treatment, RAW264.7 cells were gently rinsed twice with pre-cooled PBS at room temperature. Next, 100 μL of cell lysate was added into each sample and cleaved on ice for 10 min. The cell supernatant was collected, and the cells were fully broken using an ultrasonic cell crusher. Subsequently, cell supernatant was centrifuged at 12,000 g at 4°C for 5 min and subsequent determination was carried out. The concentrations of AQP1 and P53 in RAW264.7 cells were measured using a sandwich ELISA kit according to the manufacturer's instructions. Absorbance was detected at 450 nm by an automated ELISA reader (Antu Experimental Instrument Co., LTD).
Statistical analysis
Statistical analyses were carried out using GraphPad Prism 8.0.1 software (La Jolla, CA). The data are expressed as the mean ± standard error of the mean. The treatment effects were analyzed by using one-way analysis of variance (ANOVA) and two-tailed Student's t tests. Specifically, comparisons among multiple groups were conducted by ANOVA and homogeneity test of variance. When the variance analysis had significant difference, the two-tailed Student's t tests was used for the comparison of two groups. A nonparametric rank test was applied when the variance was not uniform. *p < 0.05 was considered to be reflective of statistical significance.
Results
The viability of RAW264.7 cells induced by LPS decreased in a concentration-dependent manner
We used different concentrations of LPS to stimulate RAW264.7 cells for 24 h. The results showed that LPS (0–14 μg/mL) had no effect on the viability of cells, and stimulation of cells with LPS (16 and 18 μg/mL) for 24 h resulted in a slight decrease in cell viability (Fig. 1A). Next, we continued to increase the concentration of LPS to stimulate RAW264.7 cells for 24 h, and we found that the cell viability decreased in LPS concentration gradient during the LPS concentration (20–44 μg/mL) (Fig. 1B).
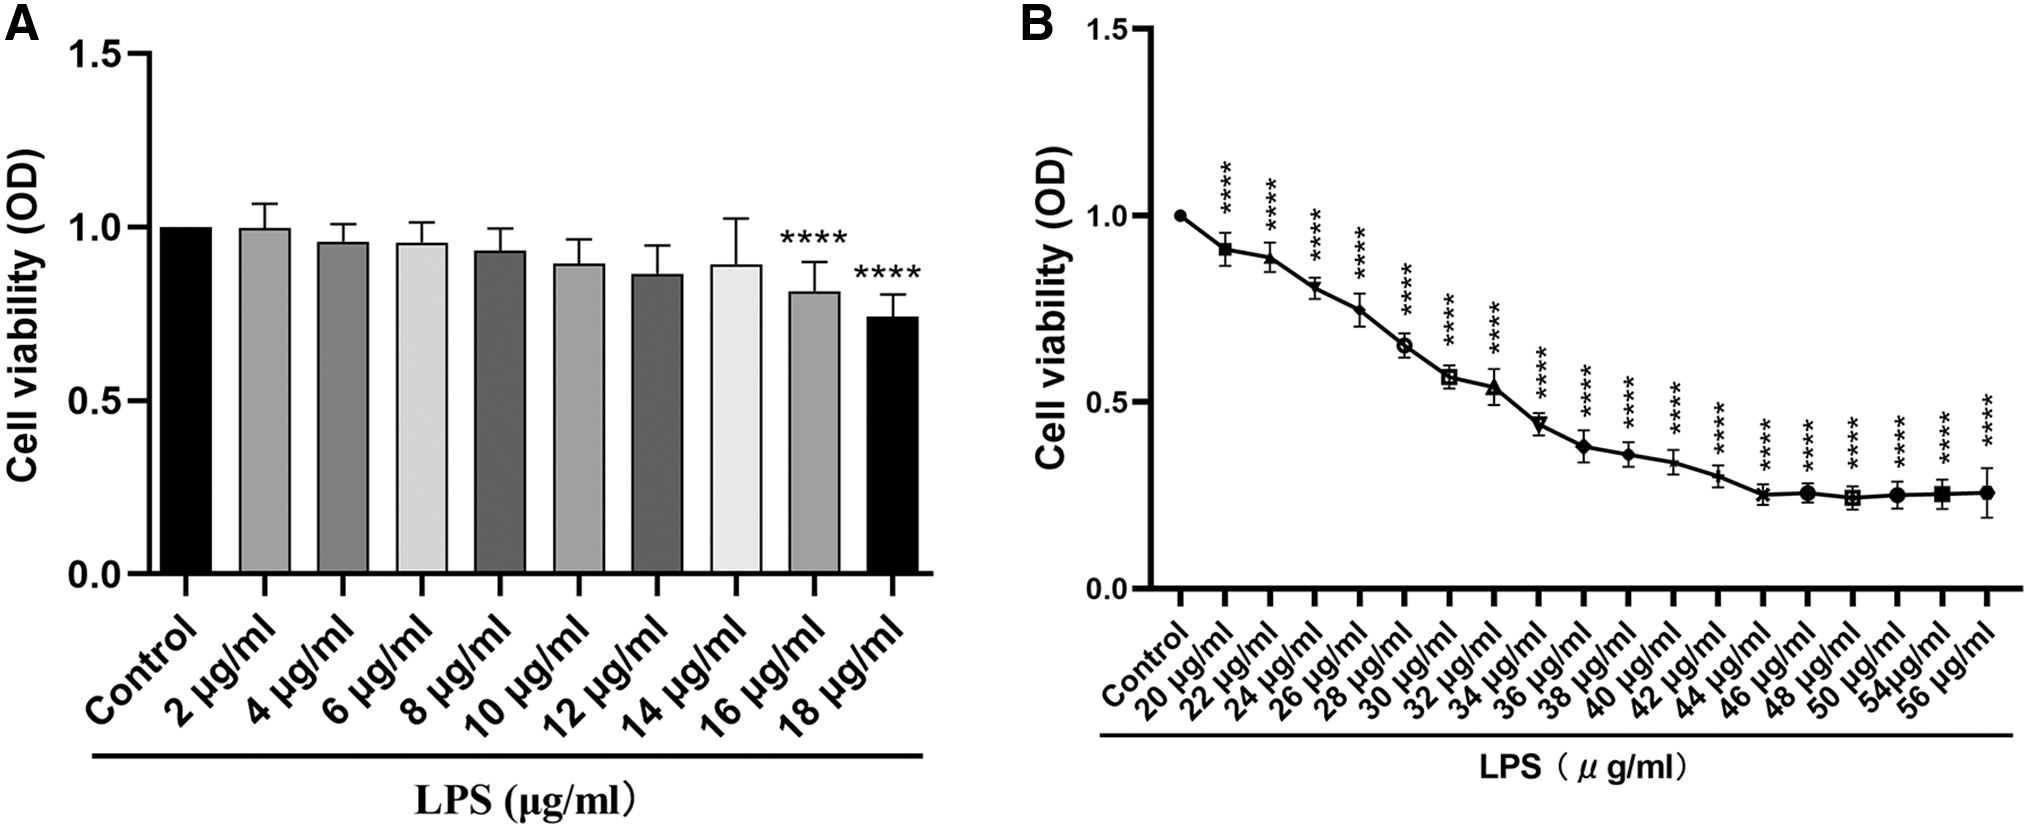
The viability of RAW264.7 cells induced by LPS decreased in a concentration-dependent manner.
Although the cell viability decreased significantly during the LPS concentration (46–56 μg/mL) compared with the control group, there was no concentration gradient decline trend (Fig. 1B). As shown in Figure 1B, cell viability was decreased by 50% at 30 μg/mL of LPS. Therefore, we finally selected 30 μg/mL of LPS for subsequent experiments.
LPS induced ferroptosis in RAW264.7 cells
We explored whether LPS induced ferroptosis in RAW264.7 cells. Therefore, we pretreated the cells using different concentrations of Fer (a ferroptosis inhibitor). The experimental results showed that 1 μM of Fer had no effect on cell viability compared with the LPS group (Fig. 2A). Among them, 5, 10, and 15 μM of Fer reversed LPS-induced cell death in a concentration gradient, and 15 μM Fer had the most significant effect (Fig. 2A).
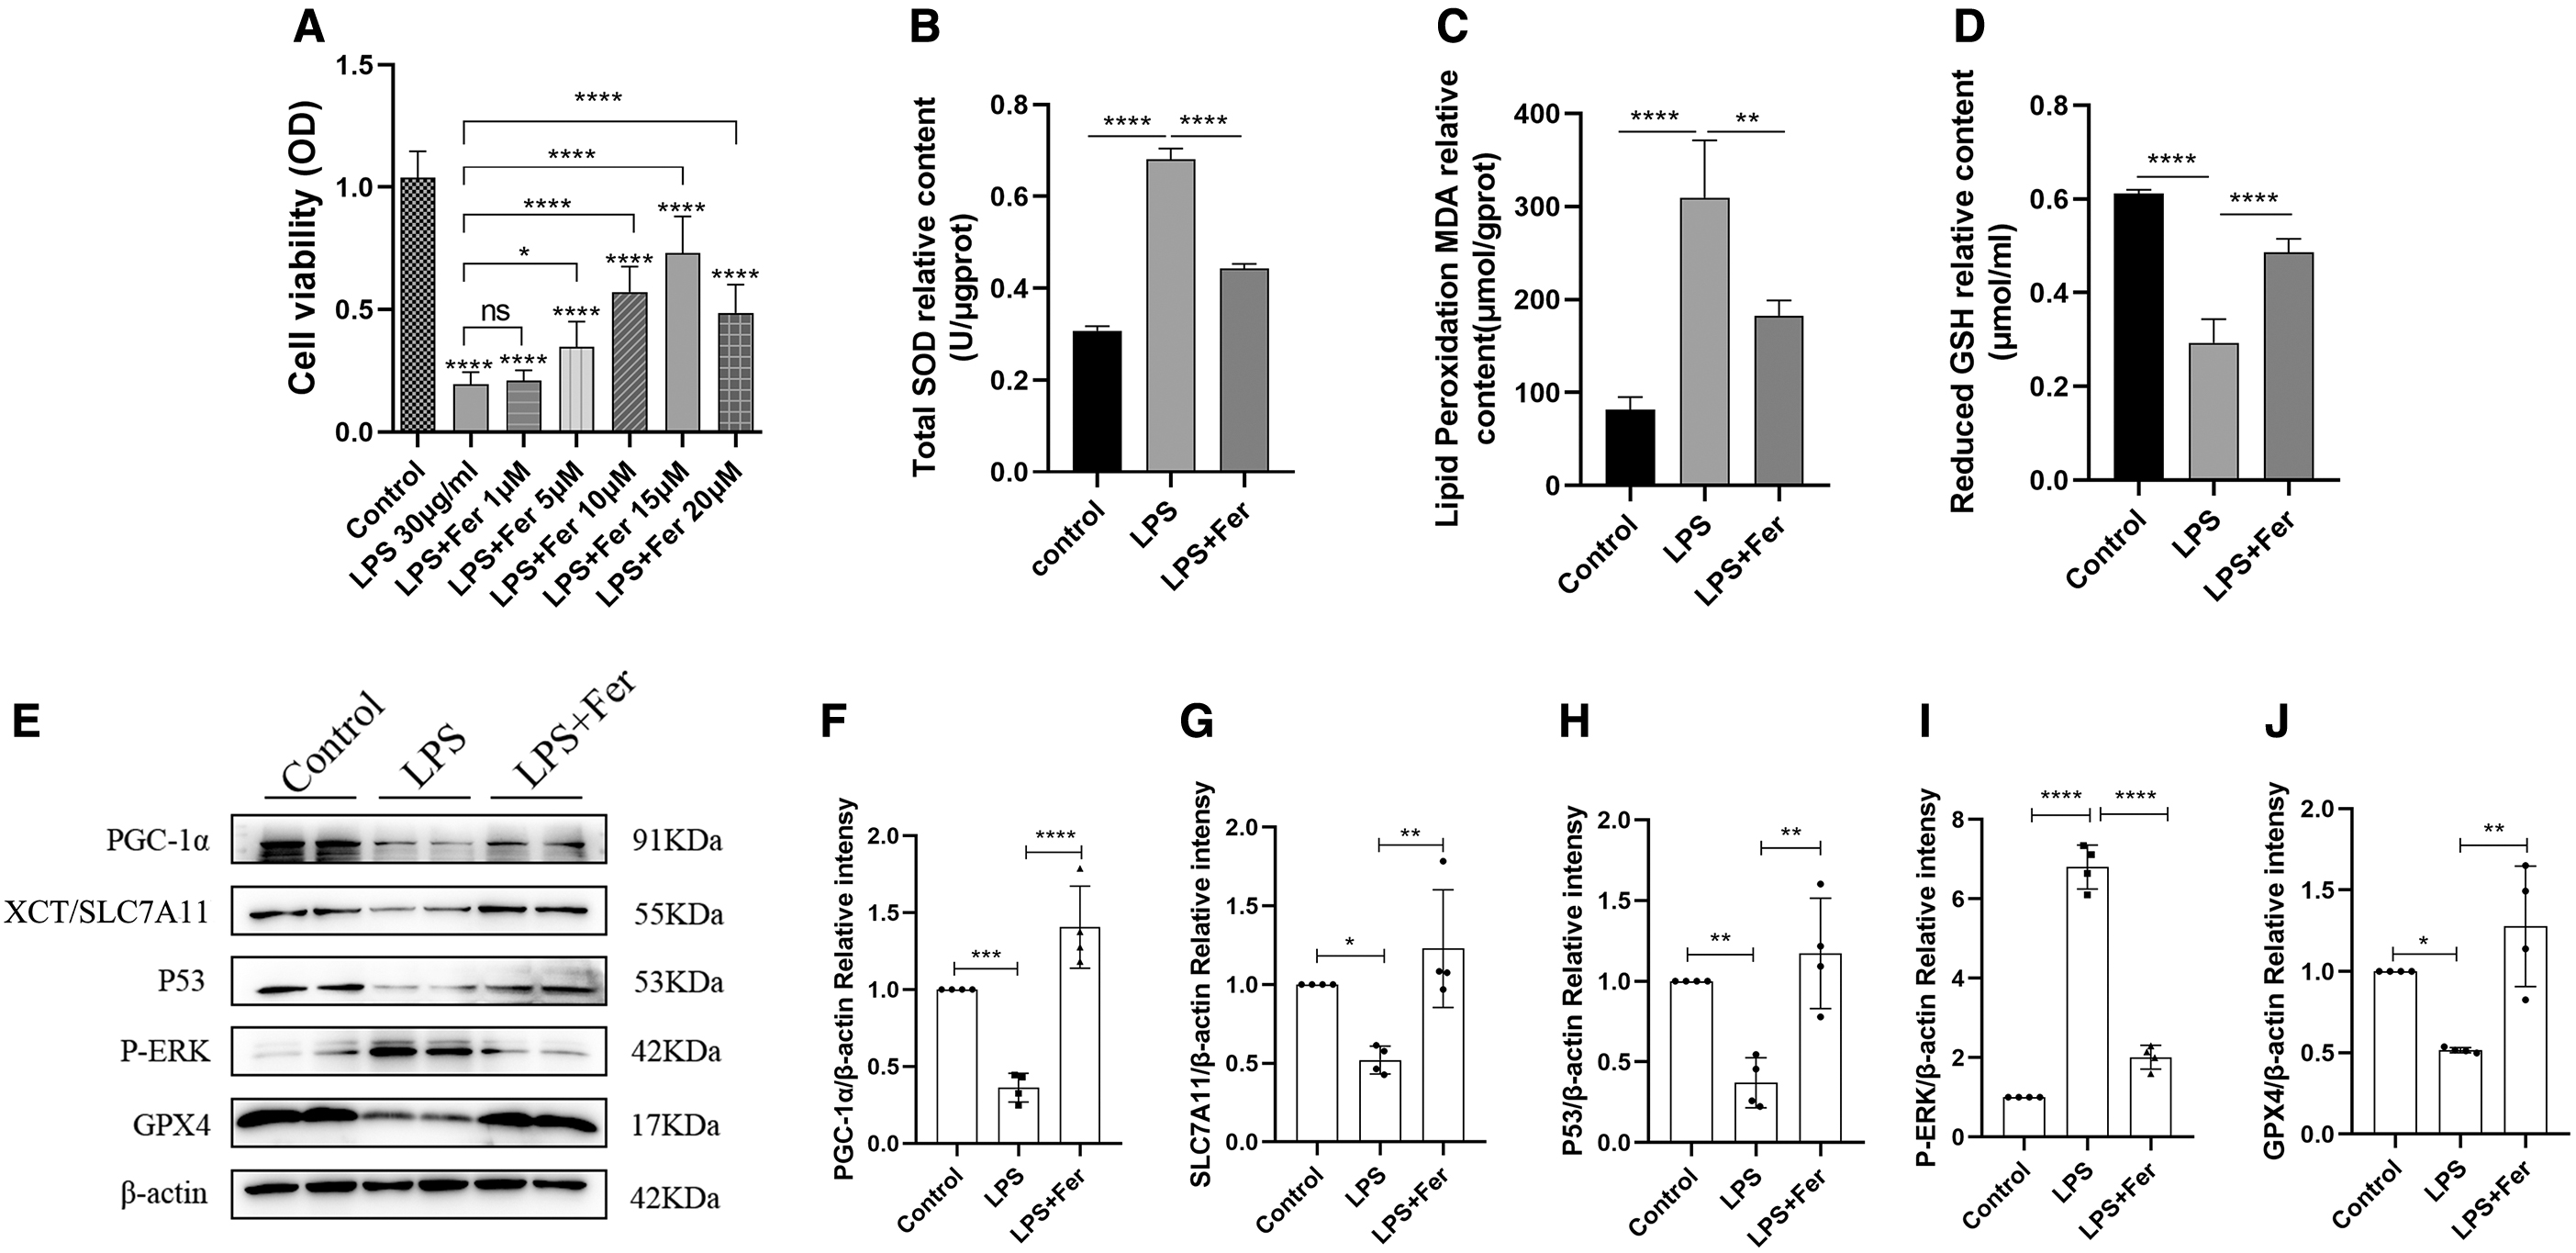
LPS induced ferroptosis and up-regulated AQP1 expression in RAW264.7 cells.
However, the cell viability was decreased in the LPS+Fer (20 μM) group compared with the LPS+Fer (15 μM) group (Fig. 2A). These results indicated that LPS-induced ferroptosis in RAW264.7 cells and 15 μM Fer had the most significant effect on reducing ferroptosis induced by LPS. Therefore, we finally decided to use 15 μM of Fer for subsequent experiments. Next, we decided to further improve the specificity of LPS-induced ferroptosis in RAW264.7 cells.
Therefore, RAW264.7 cells were treated with LPS, erastin (a ferroptosis inducers), and Fer, respectively. Firstly, RAW264.7 cells were treated with different concentrations of erastin for 24 h. It was found that the cell viability decreased with the increase of erastin concentration, and the most significant decrease was observed at 6 μM, indicating that the decrease of cell viability was dose-dependent (Supplementary Fig. S1A). Second, the experimental results showed that both LPS and erastin resulted in a decrease in cell viability compared with the control group, whereas Fer treatment mitigated the extent of the decrease in cell viability (Supplementary Fig. S1B).
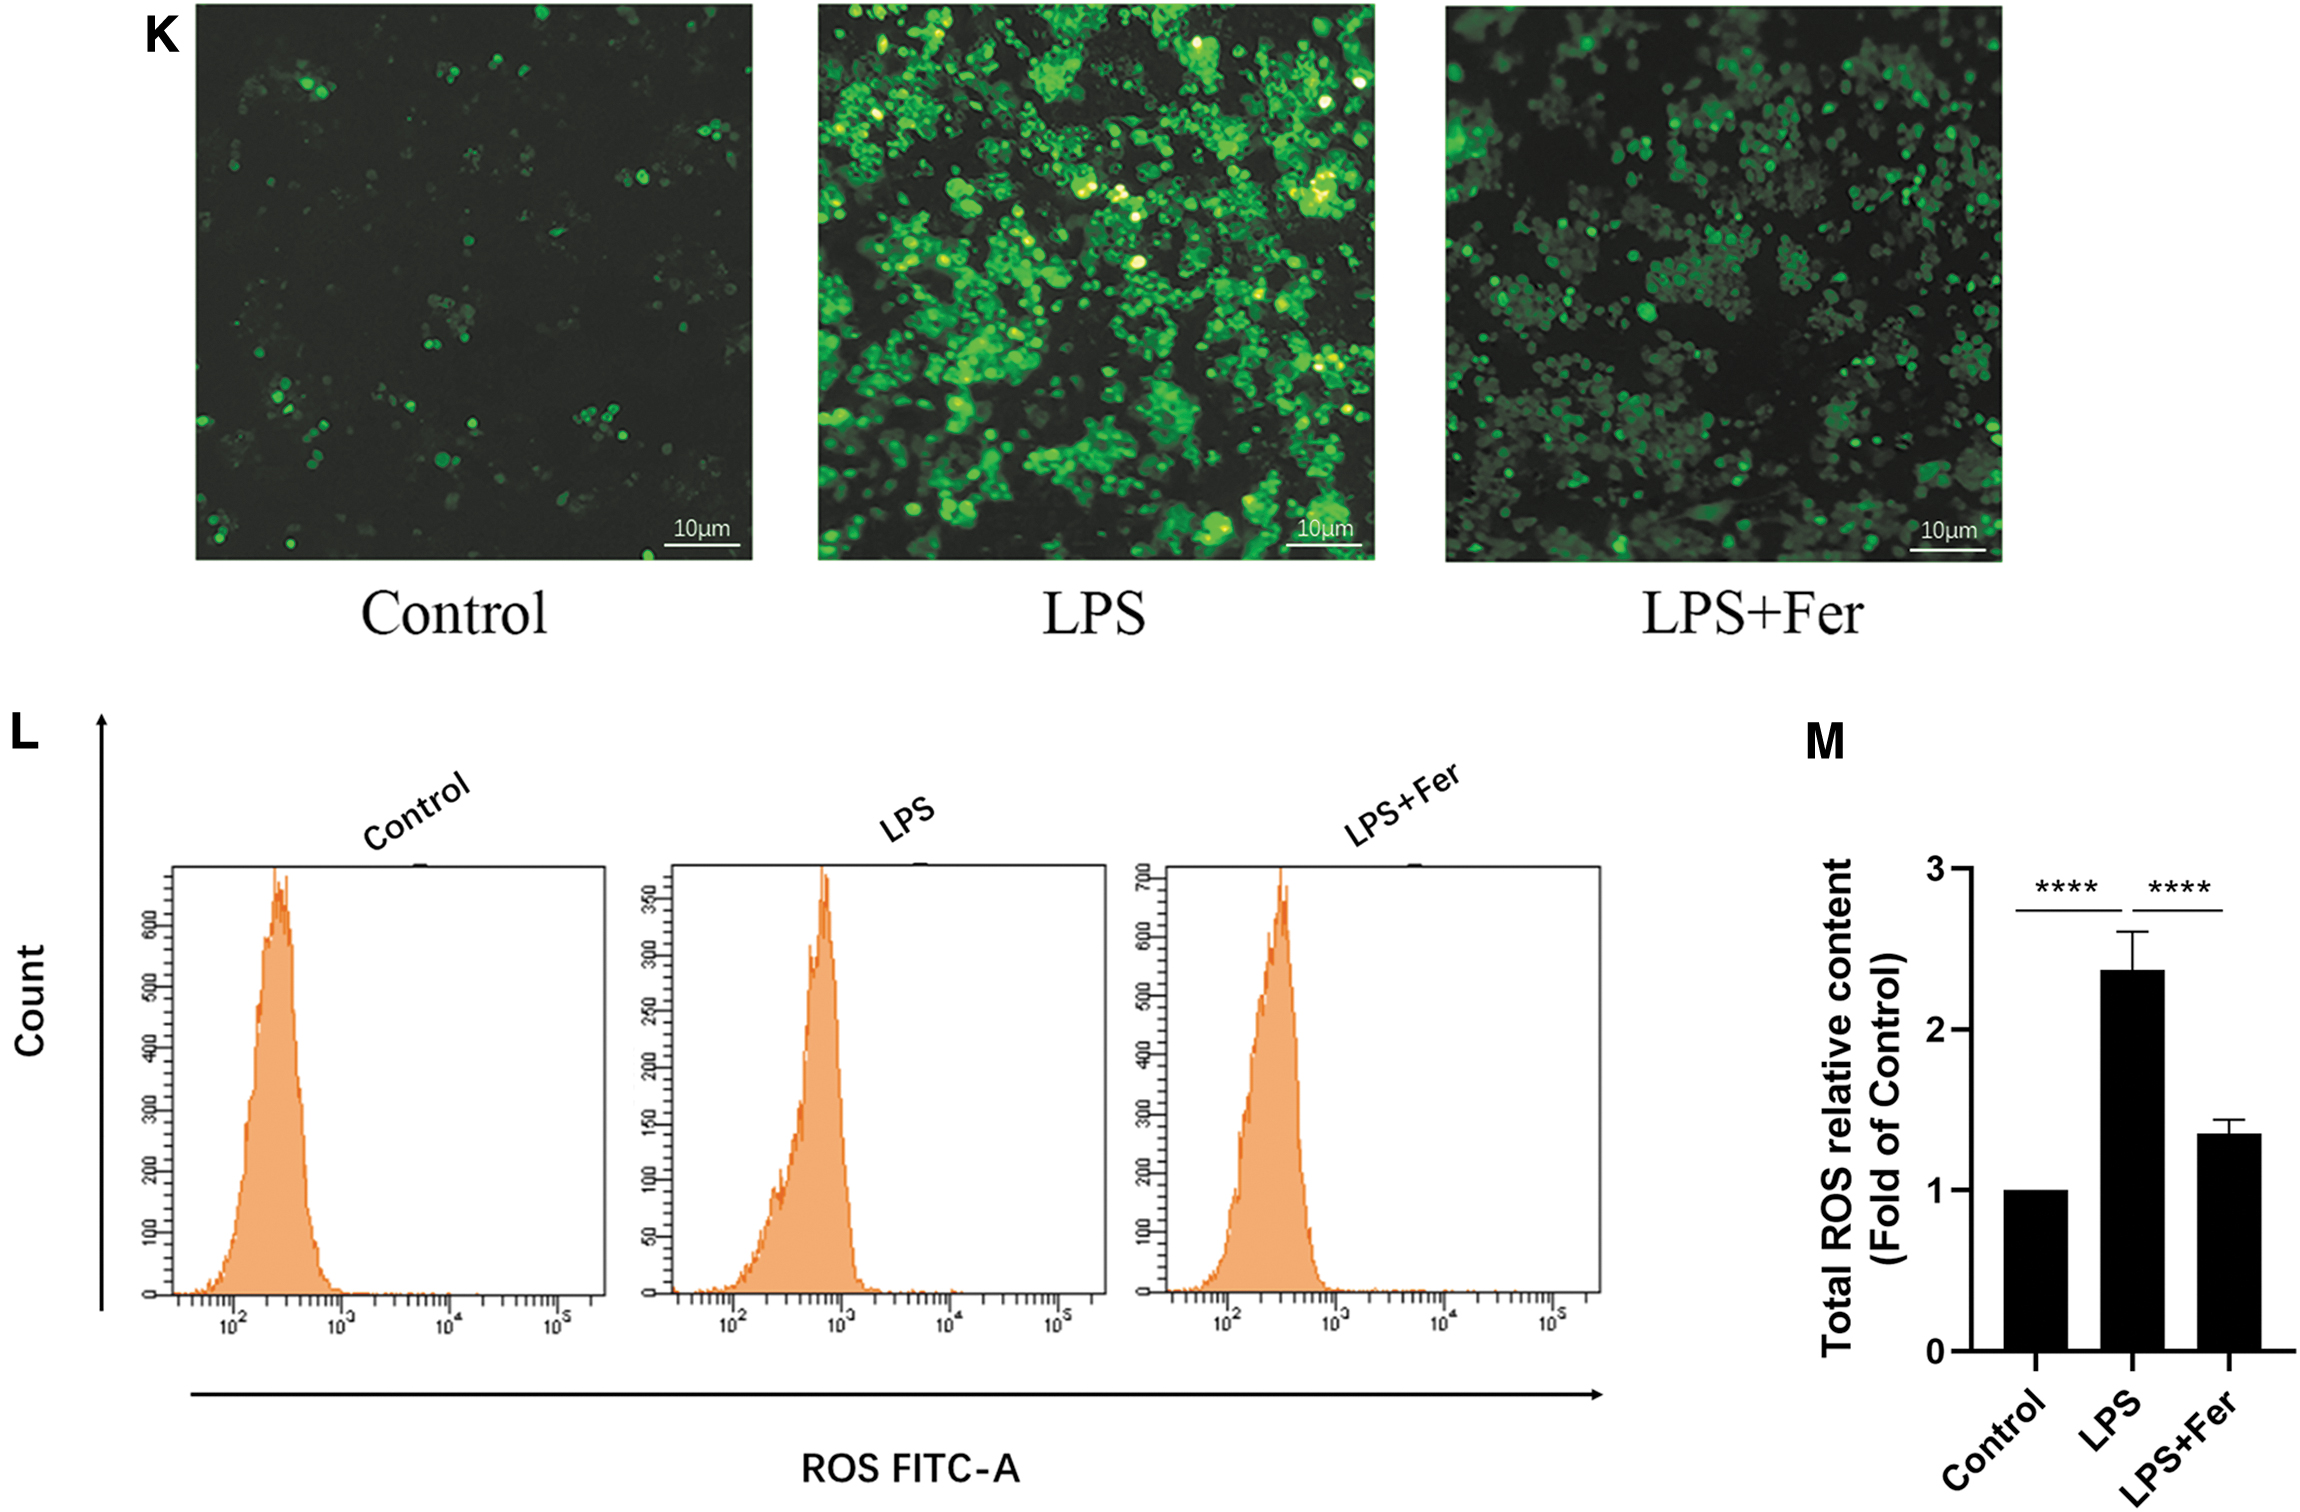
Further, the results showed that LPS treatment significantly increased the expression of T-SOD and MDA and decreased the level of GSH, which were significantly reversed by Fer (Fig. 2B–D). Meanwhile, both fluorescence microscopy and flow cytometry showed that ROS levels were significantly higher in the LPS group than the control group, whereas ROS levels were significantly lower in the LPS+Fer group than the LPS group (Fig. 2K–M).
XCT/SLC7A11 and GPX4 are often used as indicators of ferroptosis (Hu et al., 2019; Chen et al., 2020b). WB results showed that XCT/SLC7A11 and GPX4 protein expression was significantly decreased in the LPS group compared with the control group, which was significantly reversed by Fer (Fig. 2E, G, J). This further supported our results. Taken together, these results further supported the conclusion that ferroptosis occurred in RAW264.7 cells after induction with LPS (30 μg/mL) for 24 h and demonstrated that pretreatment with Fer (15 μM) significantly attenuated ferroptosis in LPS-induced RAW264.7 cells.
Altered AQP1 and P53 expression during LPS-induced ferroptosis in RAW264.7 cells
The protein and gene expression changes of AQP1 and P53 in response to LPS or erastin treatment were evaluated by RT-qPCR and ELSIA assays. The experimental results revealed that AQP1 protein and mRNA expression were significantly higher in the LPS group or erastin group (Supplementary Fig. S1C, E), whereas P53 protein and mRNA expression were dramatically lower compared with the control group (Supplementary Fig. S1D, F).
Treatment with Fer obviously reversed this phenomenon (Supplementary Fig. S1C–F). Notably, WB also showed that the expression of AQP1 protein was significantly increased and P53 protein was markedly decreased in the LPS group compared with the control group, which were significantly reversed by Fer (Figs. 2E, 2H, 3F, 3J). Homoplastically, treatment with Fer markedly mitigated LPS-induced elevated AQP1 mRNA expression and decreased P53 gene expression in RAW264.7 cells (Supplementary Fig. S2C). These results suggested that AQP1 and P53 are involved in the pathophysiological process of LPS-induced ferroptosis in RAW264.7 cells.
Inhibition of ferroptosis ameliorated macrophage M1 polarization, mitochondrial damage, and autophagy block.
Subsequently, we further assessed the changes in mRNA levels of AQP1 and P53 after LPS treatment of RAW264.7 cells for 6, 12, and 24 h. This is particularly important for p53, which could be regulated by post-translational mechanisms. The results showed that after 6 h of LPS stimulation of RAW264.7 cells, there was no difference in AQP1 mRNA or P53 mRNA between the control and LPS groups; after 12 h of LPS stimulation of RAW264.7 cells, AQP1 mRNA expression was elevated as well as P53 mRNA expression was decreased in the LPS group compared with the control group; after 24 h of LPS stimulation of RAW264.7 cells, the expression of AQP1 mRNA was dramatically increased, whereas the expression of P53 mRNA was greatly decreased in the LPS group compared with the control group (Supplementary Fig. S2A, B). In a word, these results indicate that the protein and gene levels of AQP1 and P53 were significantly altered at 24 h in LPS-treated RAW264.7 cells and changed in a consistent trend.
Inhibition of ferroptosis ameliorated M1 polarization, mitochondrial damage, and autophagy block in LPS-induced RAW264.7 cells
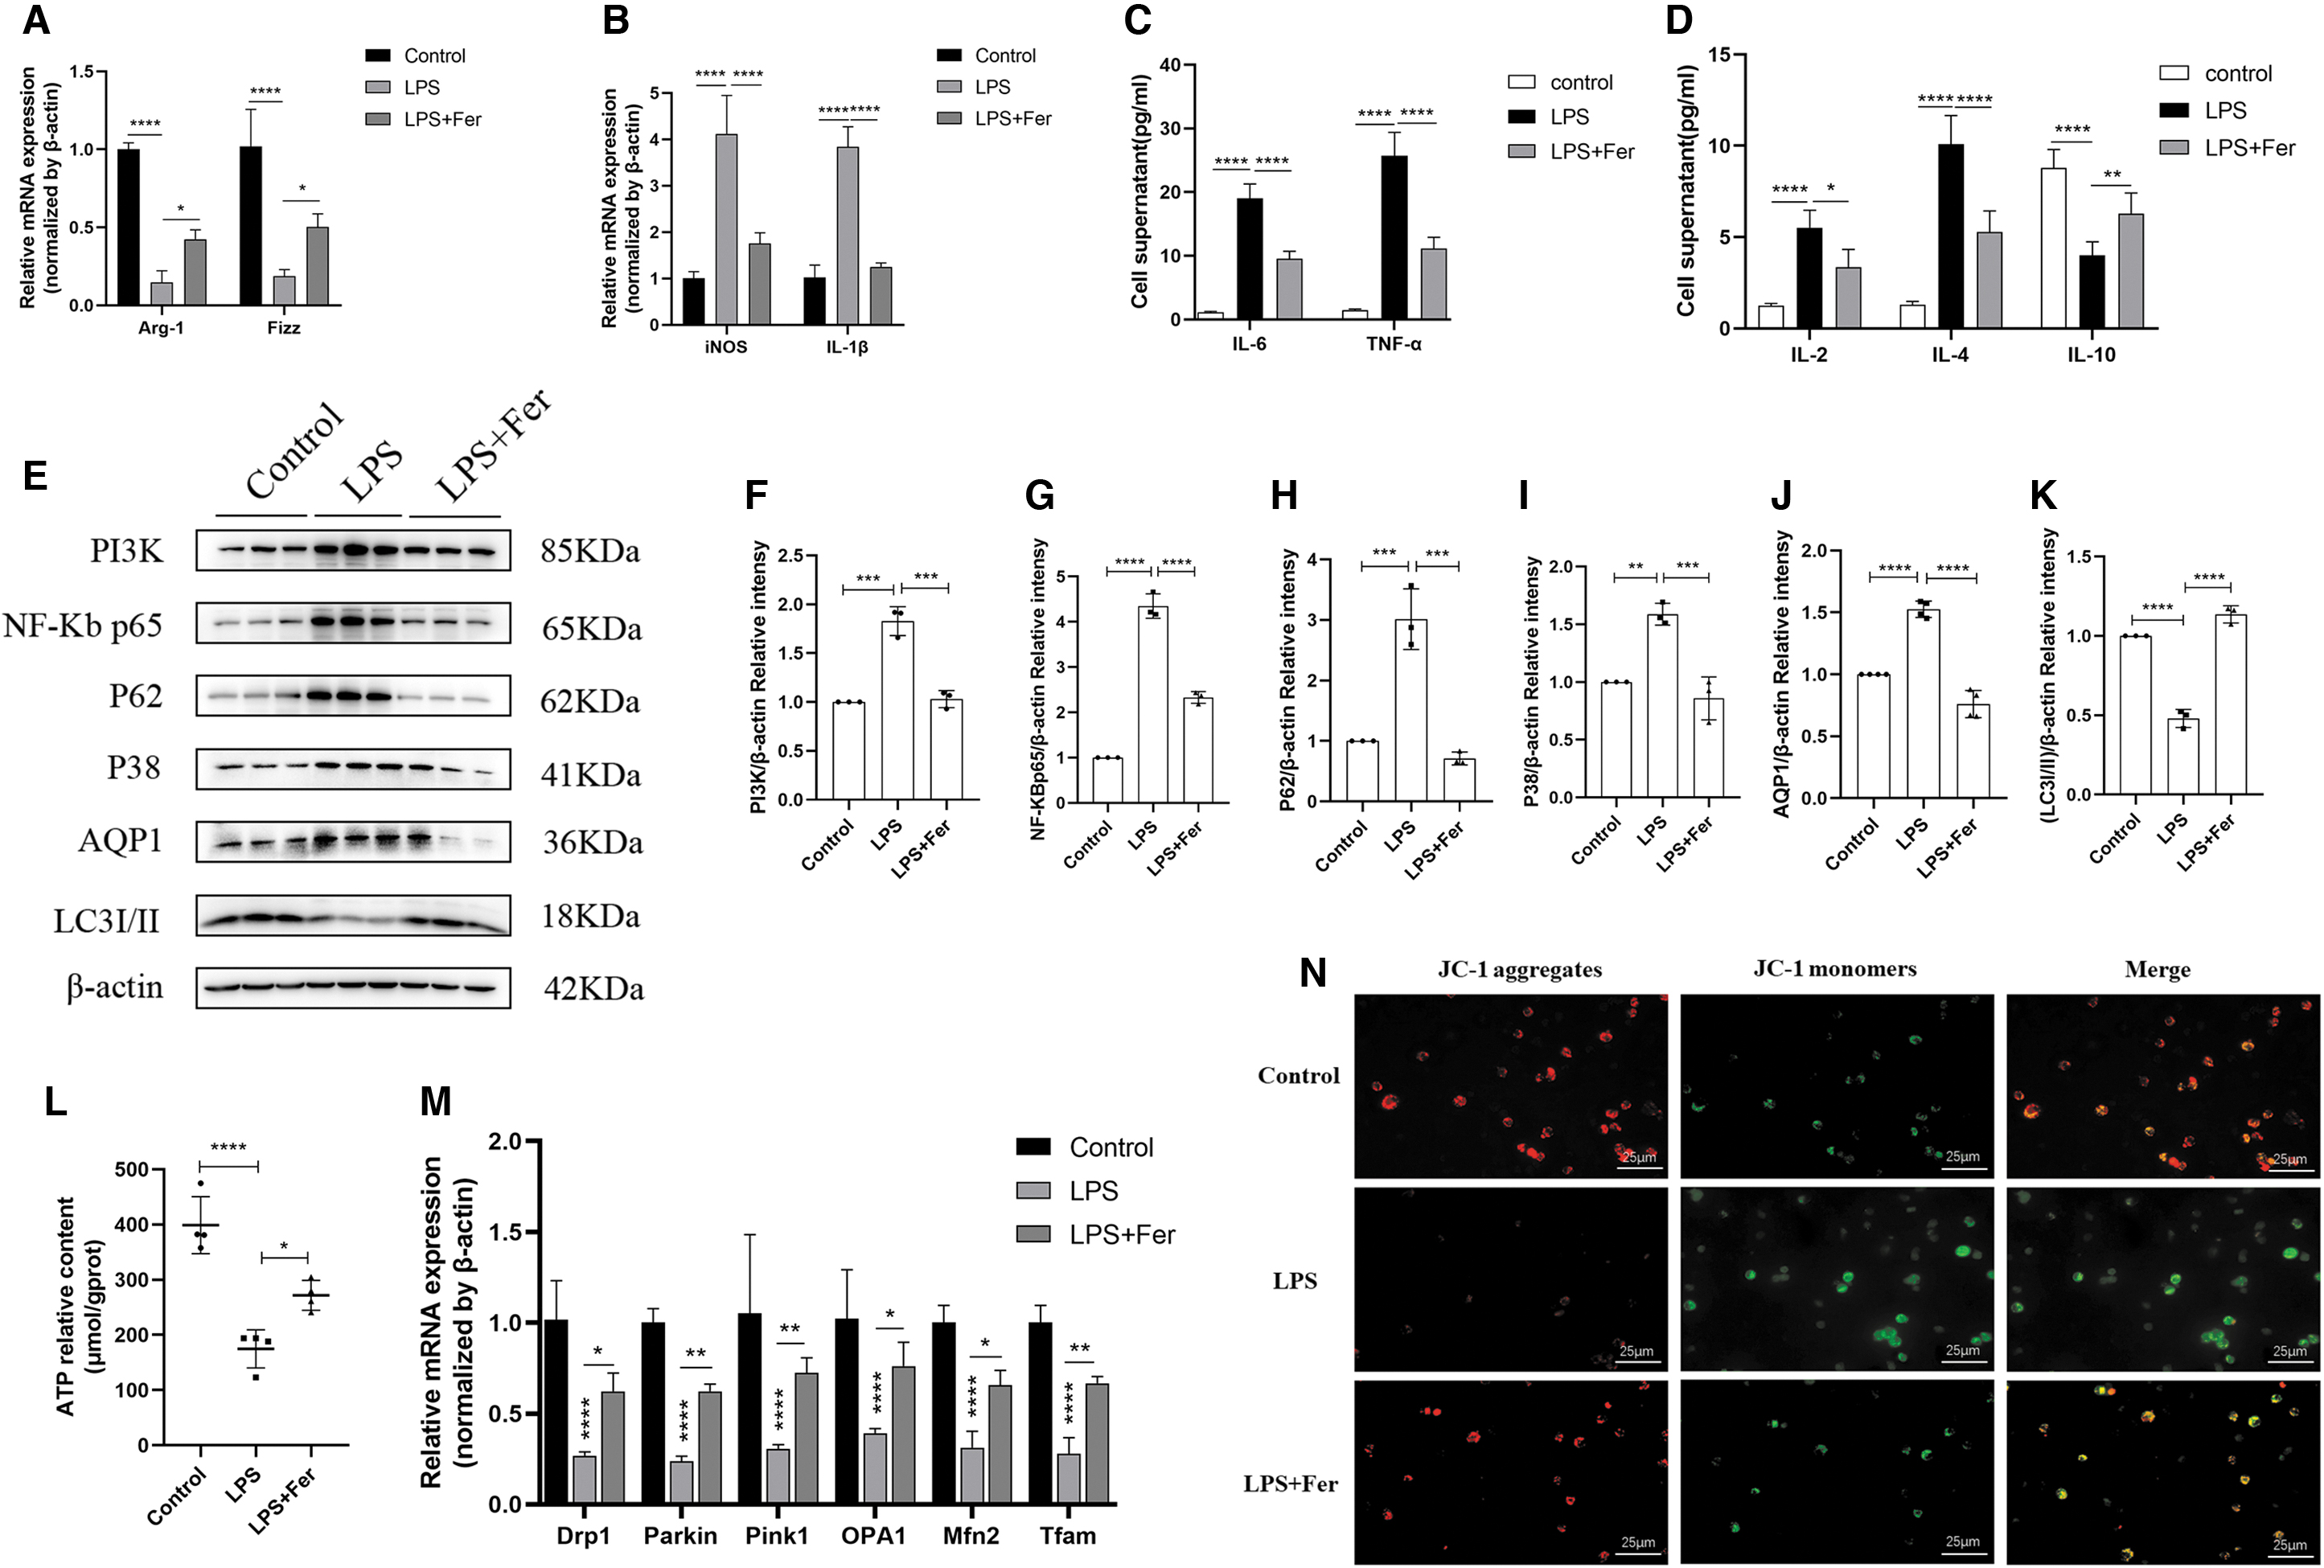
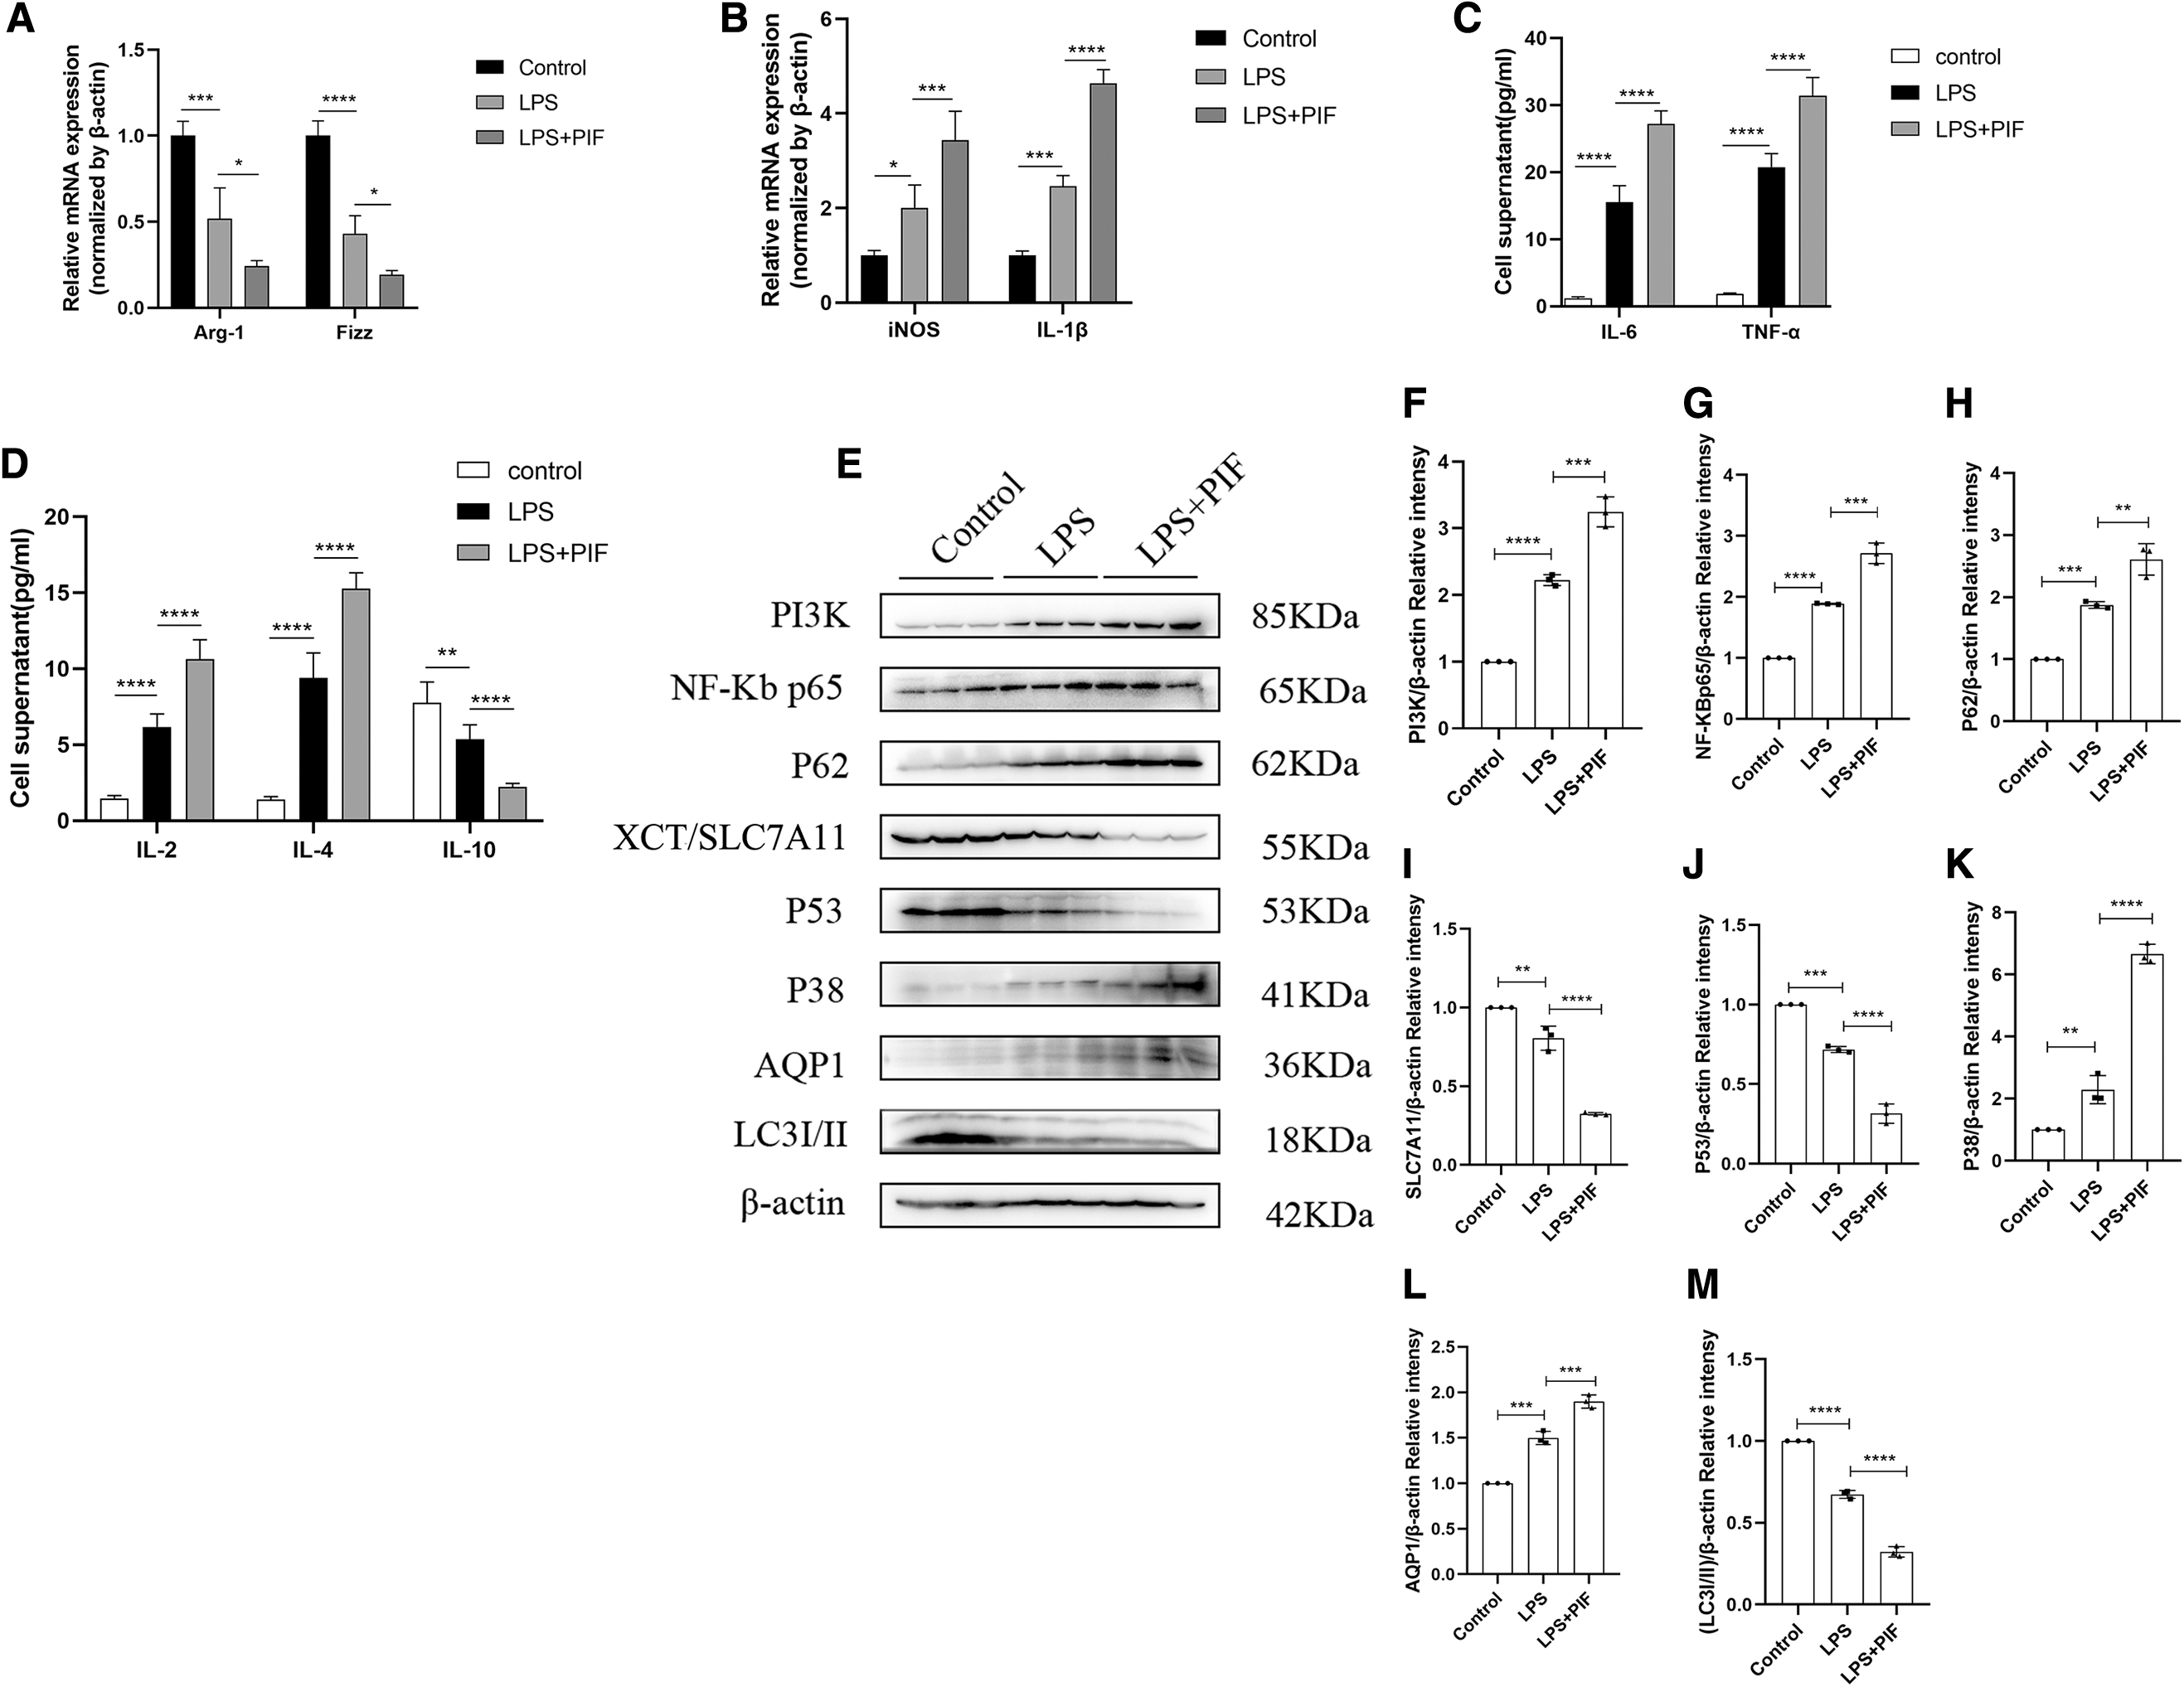
As shown in Figure 3A and B, the mRNA expression of arginase-1 (Arg-1) and Resistin-like molecule alpha (Fizz) was significantly decreased and the mRNA expression of inducible nitric oxide synthase (iNOS) and IL-1β was significantly increased in LPS-induced RAW264.7 cells, which was significantly reversed by Fer treatment. These results suggested that Fer attenuated M1 polarization of macrophage and increased M2 polarization of macrophage in LPS-induced RAW264.7 cells. Fer treatment attenuated the release of inflammatory cytokines.
The results showed that the LPS+Fer group had significantly increased expression of IL-6, TNF-α, IL-2, and IL-4, and significantly decreased expression of IL-10 compared with the LPS group (Fig. 3C, D). Meanwhile, the protein expression of PI3K, P38, NF-κB P65, and P-ERK in the LPS+Fer group was significantly lower than the LPS group (Figs. 2E, 2I, 3E–G, 3I).
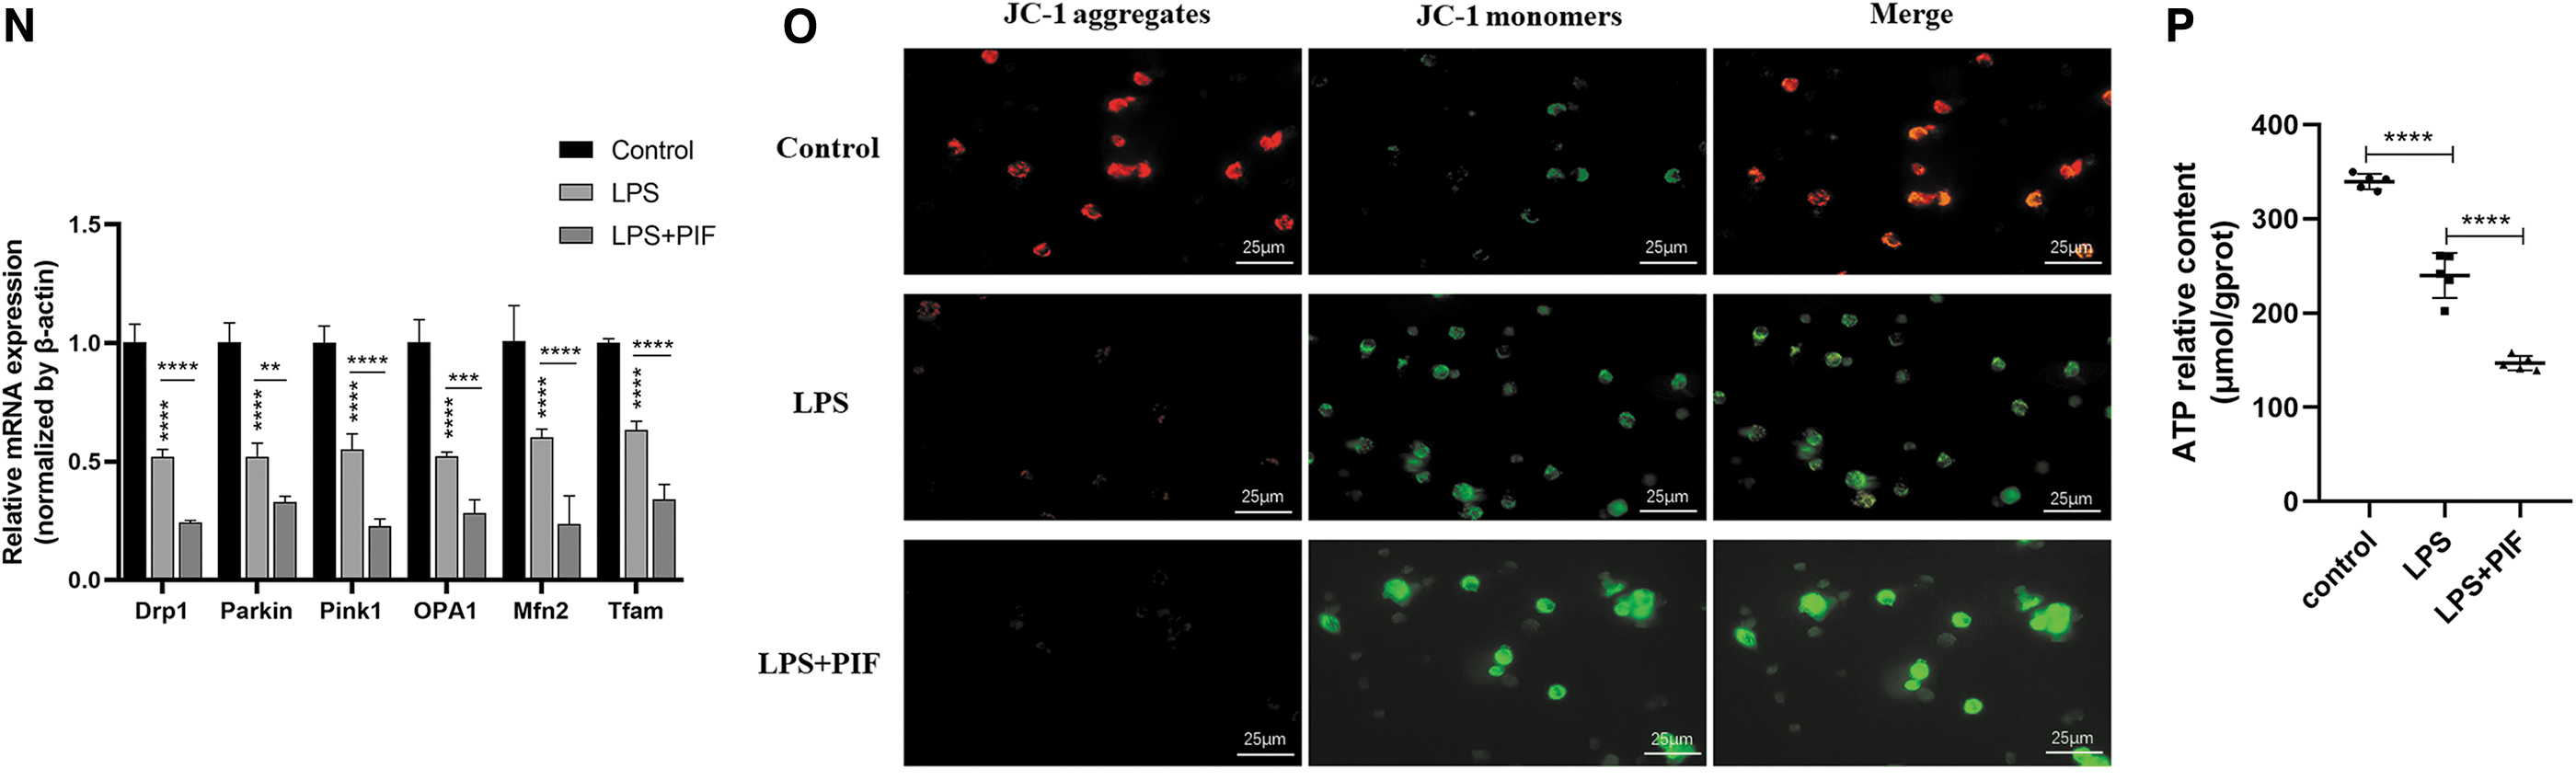
Moreover, RT-qPCR and fluorescence microscopy showed that mitochondrial functional gene (dynamin-related protein 1 [Drp1], Parkin1, PTEN-induced putative kinase 1 [Pink1], optic atrophy 1 [OPA1], mitofusin [Mfn2], mitochondrial transcription factor A [Tfam]) expression and mitochondrial membrane potential levels were decreased after LPS treatment (Fig. 3M, N), which were dramatically improved by Fer (Fig. 3M, N).
The WB results showed that PGC-1α protein expression in the LPS+Fer group was significantly higher than the LPS group (Fig. 2E, F). The ATP content in the LPS group was observably lower than the control group, whereas that in the LPS+Fer group was significantly higher than the LPS group (Fig. 3L).
P62 and LC3I/II are often regarded as the classic markers of autophagy (Liu et al., 2015). WB results showed that the expression of P62 was significantly increased and the expression of LC3I/II was decreased in the LPS group (Fig. 3E, H, K), suggesting that autophagy was blocked in RAW264.7 cells after LPS treatment, and Fer treatment alleviated the blockage of autophagy (Fig. 3E, H, K). Altogether, these results indicate that inhibition of ferroptosis significantly improves LPS-induced M1 polarization, mitochondrial dysfunction, and autophagy obstruction in RAW264.7cells.
Inhibition of P53 aggravated the ferroptosis of RAW264.7 cells induced by LPS and promoted the up-regulation of AQP1 expression.
In the earlier cited experiments, we found that P53 may be involved in the mechanistic process of ferroptosis induced by LPS. Therefore, RAW264.7 cells were treated with low (0.5 μM) and high (15 μM) concentrations of PIF (a P53 inhibitor) for 24 h, respectively. The results showed that 0.5 μM of PIF had no effect on cell viability, whereas treatment with 15 μM of PIF significantly reduced cell viability compared with the LPS group (Fig. 4A). Next, we clarified the suspicion that PIF has cytotoxic effects by si-RNA-mediated down-regulation of p53.
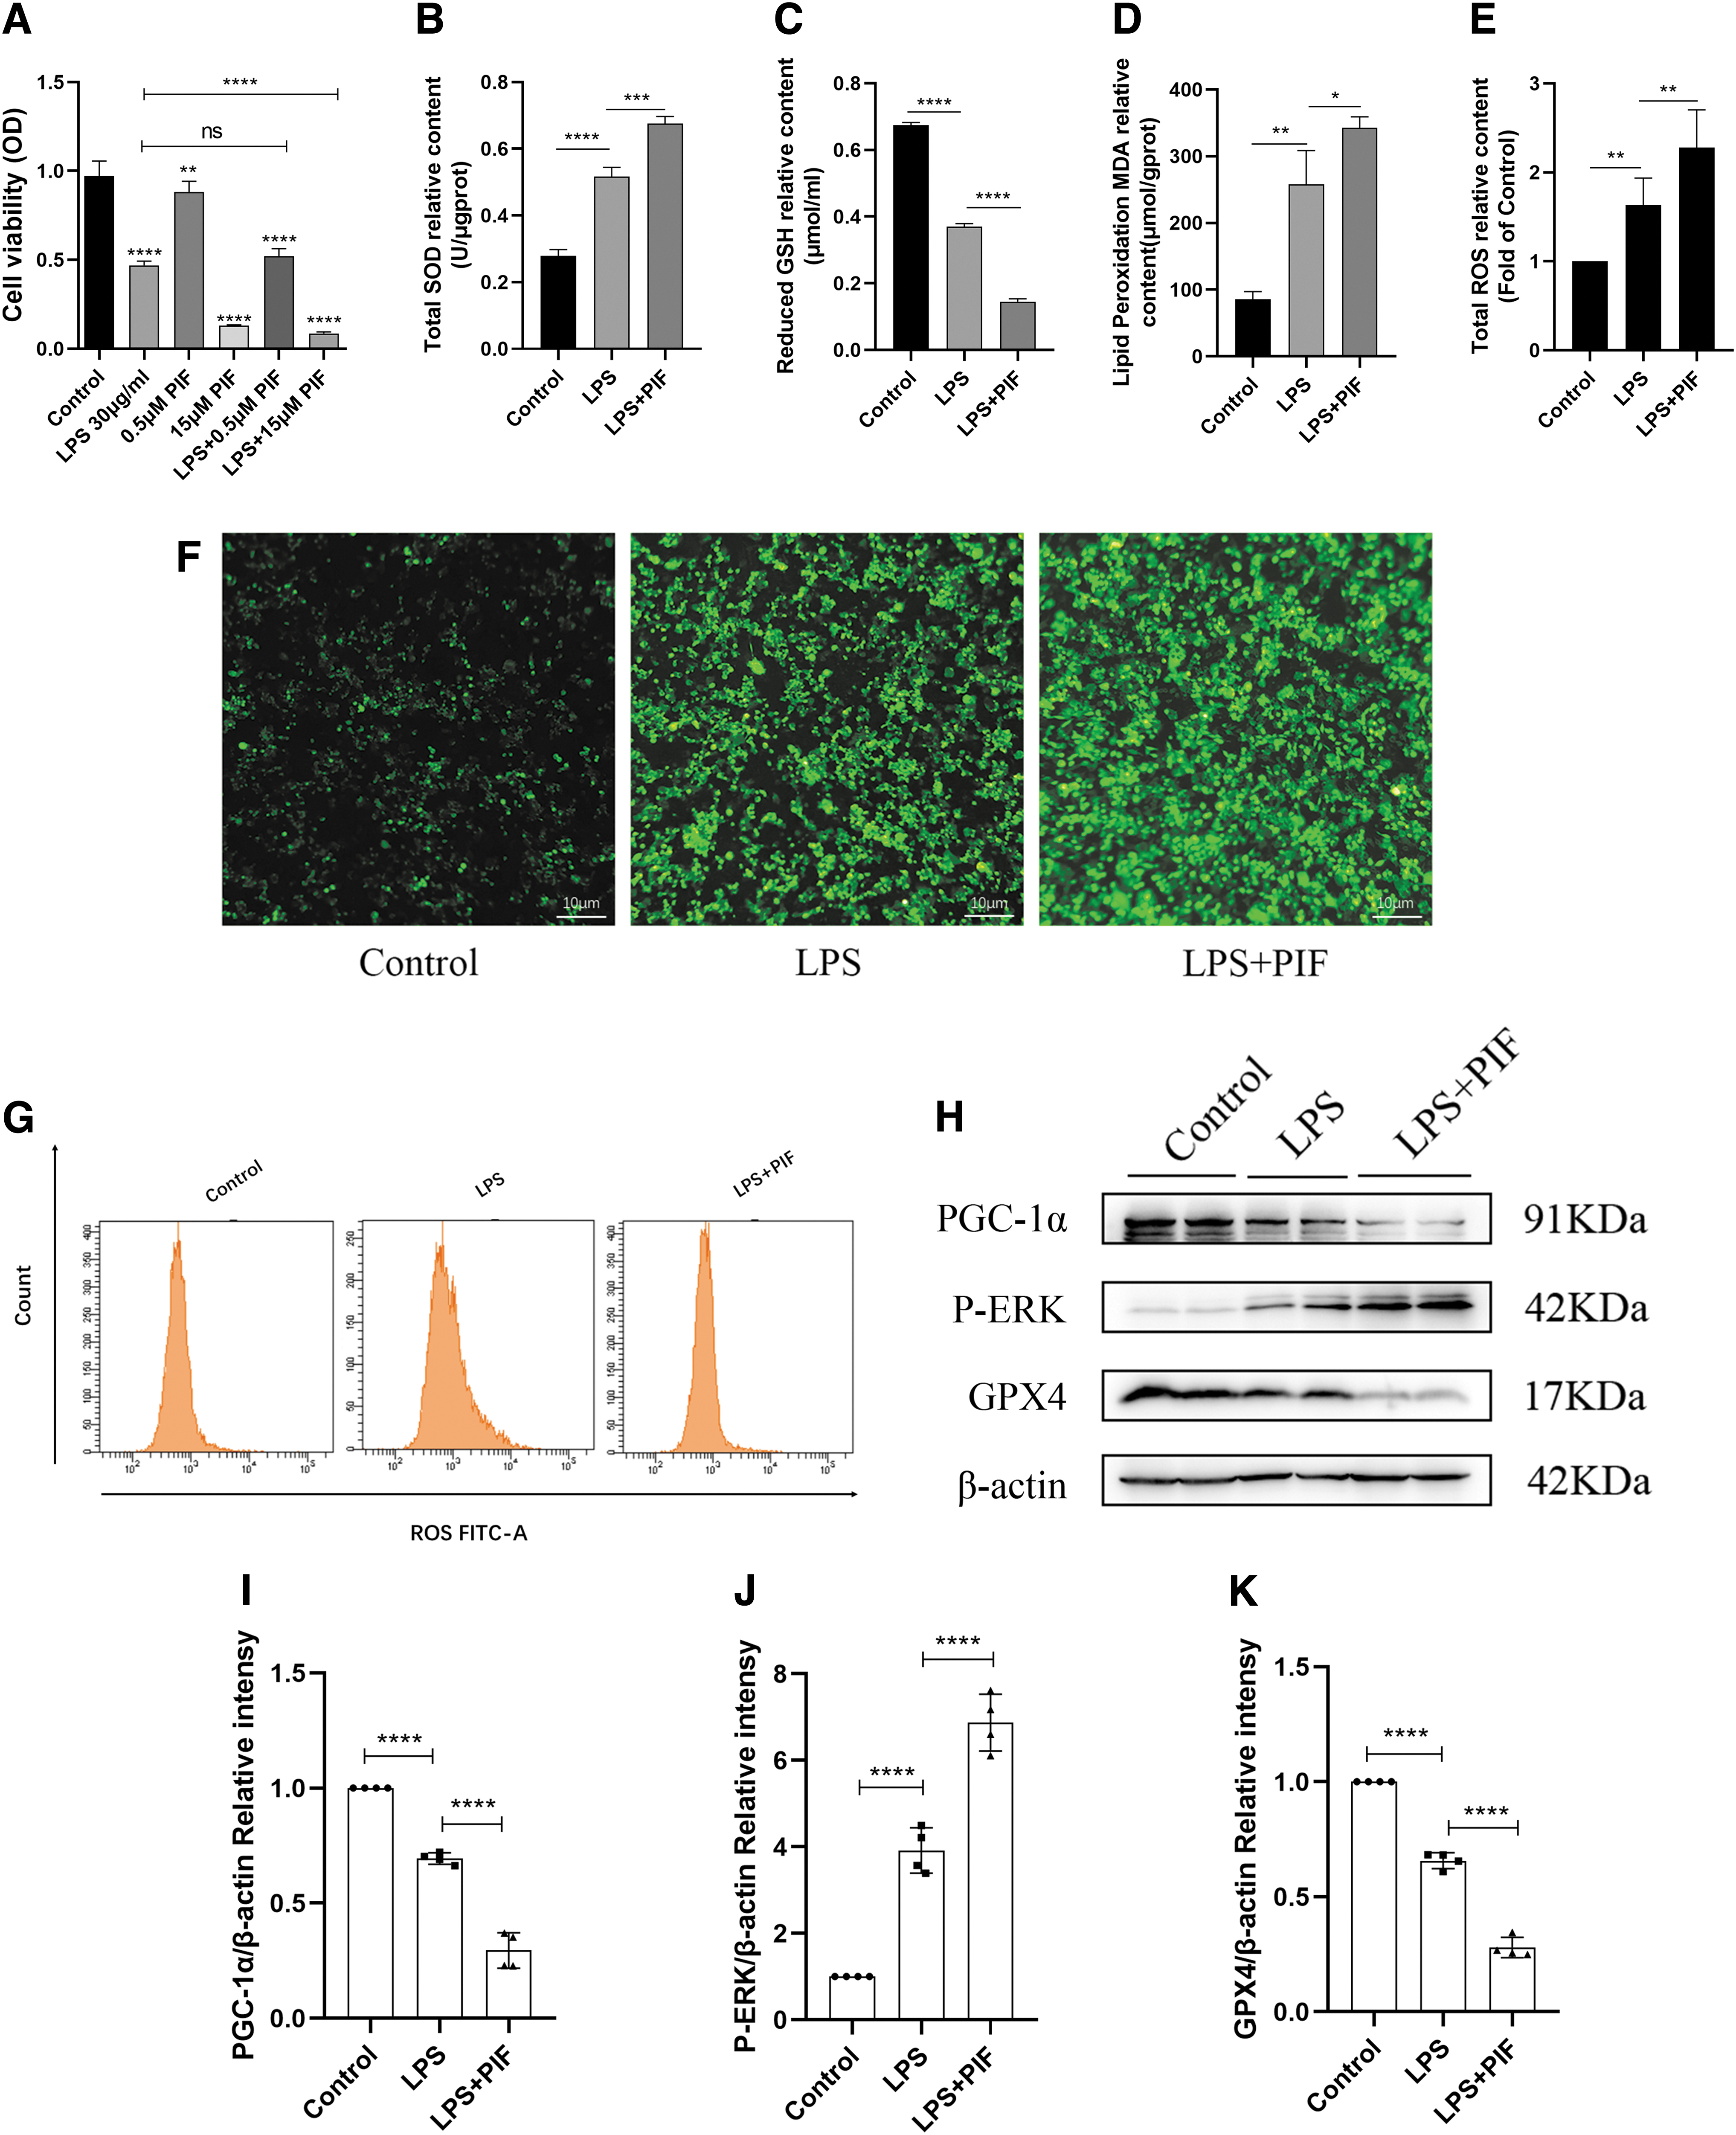
High concentrations of PIF aggravated the ferroptosis of RAW264.7 cells induced by LPS and promoted the up-regulation of AQP1 expression.
Similarly, the effect of Keve treatment was verified by pcDNA-P53 overexpression. The results showed that P53 mRNA and protein expression were significantly lower in the si-P53 group compared with the control group (Supplementary Fig. S3A, B). However, the expression of P53 mRNA and protein was significantly higher in the pcDNA-P53 group compared with the control group (Supplementary Fig. S3A, B), indicating that P53 was successfully knocked-down and overexpressed.
For another, CCK8 reagent was used to detect changes in cell viability after si-P53 or pcDNA-P53 overexpression treatment, respectively. The results showed that either PIF or si-P53 mediated down-regulation of p53 exacerbated the LPS-induced decrease in cell viability. In contrast, Keve or pcDNA-P53 overexpression treatment significantly alleviated the LPS-induced reduction in cell viability (Supplementary Fig. S3C, D).
Moreover, the results showed that the T-SOD and MDA expression was significantly increased and the GSH level was significantly decreased in the LPS+PIF (15 μM) group compared with the LPS group (Fig. 4B–D). Meanwhile, fluorescence microscopy and flow cytometry showed that ROS levels were significantly higher in the LPS+PIF (15 μM) group than the LPS group (Fig. 4E–G), which was consistent with the results of SOD and MDA.
The WB results showed that the protein expression of XCT/SLC7A11 and GPX4 in the LPS+PIF (15 μM) group was significantly lower than the LPS group (Figs. 4H, 4K, 5E, 5I). These results indicated that high concentrations of PIF (15 μM) significantly promoted LPS-induced ferroptosis in RAW264.7 cells.
Inhibition of P53 promoted macrophage M1 polarization, mitochondrial damage, and autophagy block.
Interestingly, the results also showed that AQP1 expression was significantly increased in the LPS+PIF (15 μM) group compared with the LPS group (Fig. 5E, J, L), indicating that inhibition of P53 expression significantly promoted the up-regulation of AQP1 protein expression. As expected, treatment with PIF significantly exacerbated the LPS-stimulated elevated AQP1 mRNA expression and diminished P53 mRNA expression in RAW264.7 cells (Supplementary Fig. S2D). Therefore, we speculated that there may be a potential mechanism for the interaction between P53 and AQP1 in the process of ferroptosis induced by LPS in RAW264.7 cells.
Inhibition of P53 promoted M1 polarization, mitochondrial damage, and autophagy block in LPS-induced RAW264.7 cells
As shown in Figure 5A and B, the gene expression of Arg-1 and Fizz in the LPS+PIF group was significantly lower than the LPS group. In contrast to Arg-1 and Fizz, the gene expression of iNOS and IL-1β was significantly higher than the LPS group, suggesting that inhibition of P53 expression promoted M1 polarization of RAW264.7 cells induced by LPS.
Further, the results showed that inhibition of P53 expression also promoted the release of pro-inflammatory cytokines (IL-6, TNF-α, IL-2, and IL-4) and decreased the expression of anti-inflammatory factor IL-10 (Fig. 5C, D). The results of WB showed that the expression of NF-κB p65, P-ERK, PI3K, and P38 proteins in the LPS+PIF group was significantly increased compared with the LPS group (Figs. 4H, 4J, 5E–G, 5K).
For another, the results of RT-qPCR and fluorescence microscopy showed that mitochondrial biological functional genes (Drp1, Parkin1, Pink1, OPA1, Mfn2, Tfam) and mitochondrial membrane potential levels were significantly lower in the LPS+PIF group than the LPS group (Fig. 5N, O). WB results showed that inhibition of P53 expression significantly reduced PGC-1α levels (Fig. 4H, I).
Meanwhile, the results showed that ATP content in the LPS+PIF group was significantly lower than the LPS group (Fig. 5P), which was consistent with the results of RT-qPCR and fluorescence microscopy. These results suggest that inhibition of P53 expression aggravates mitochondrial damage of macrophages induced by LPS.
In addition, WB results showed that the expression of P62 protein was significantly increased and the expression of LC3I/II was significantly decreased in the LPS+PIF group compared with the LPS group (Fig. 5E, H, M), suggesting that inhibition of P53 aggravated the obstruction of autophagy of macrophages induced by LPS. Taken together, these results indicate that inhibition of P53 expression by treatment with P53 inhibitor for 24 h significantly promotes M1 polarization, mitochondrial dysfunction, and autophagy obstruction in LPS-induced RAW264.7 cells.
Up-regulation of P53 expression alleviated ferroptosis and inhibited AQP1 protein expression in LPS-induced RAW264.7 cells
In the earlier cited experiments, we have shown that inhibition of P53 can promote the ferroptosis of RAW264.7 cells induced by LPS. Next, we examined the effect of up-regulation of P53 expression on LPS-induced RAW264.7 cells by treatment with Keve (a P53 agonist) for 24 h. First, we explored the effect of different concentrations of the Keve on cell viability and found that 70 μM of Keve rescued cell viability in LPS-induced RAW264.7 cells (Fig. 6A). Therefore, we finally selected 70 μM of Keve for subsequent experiments.
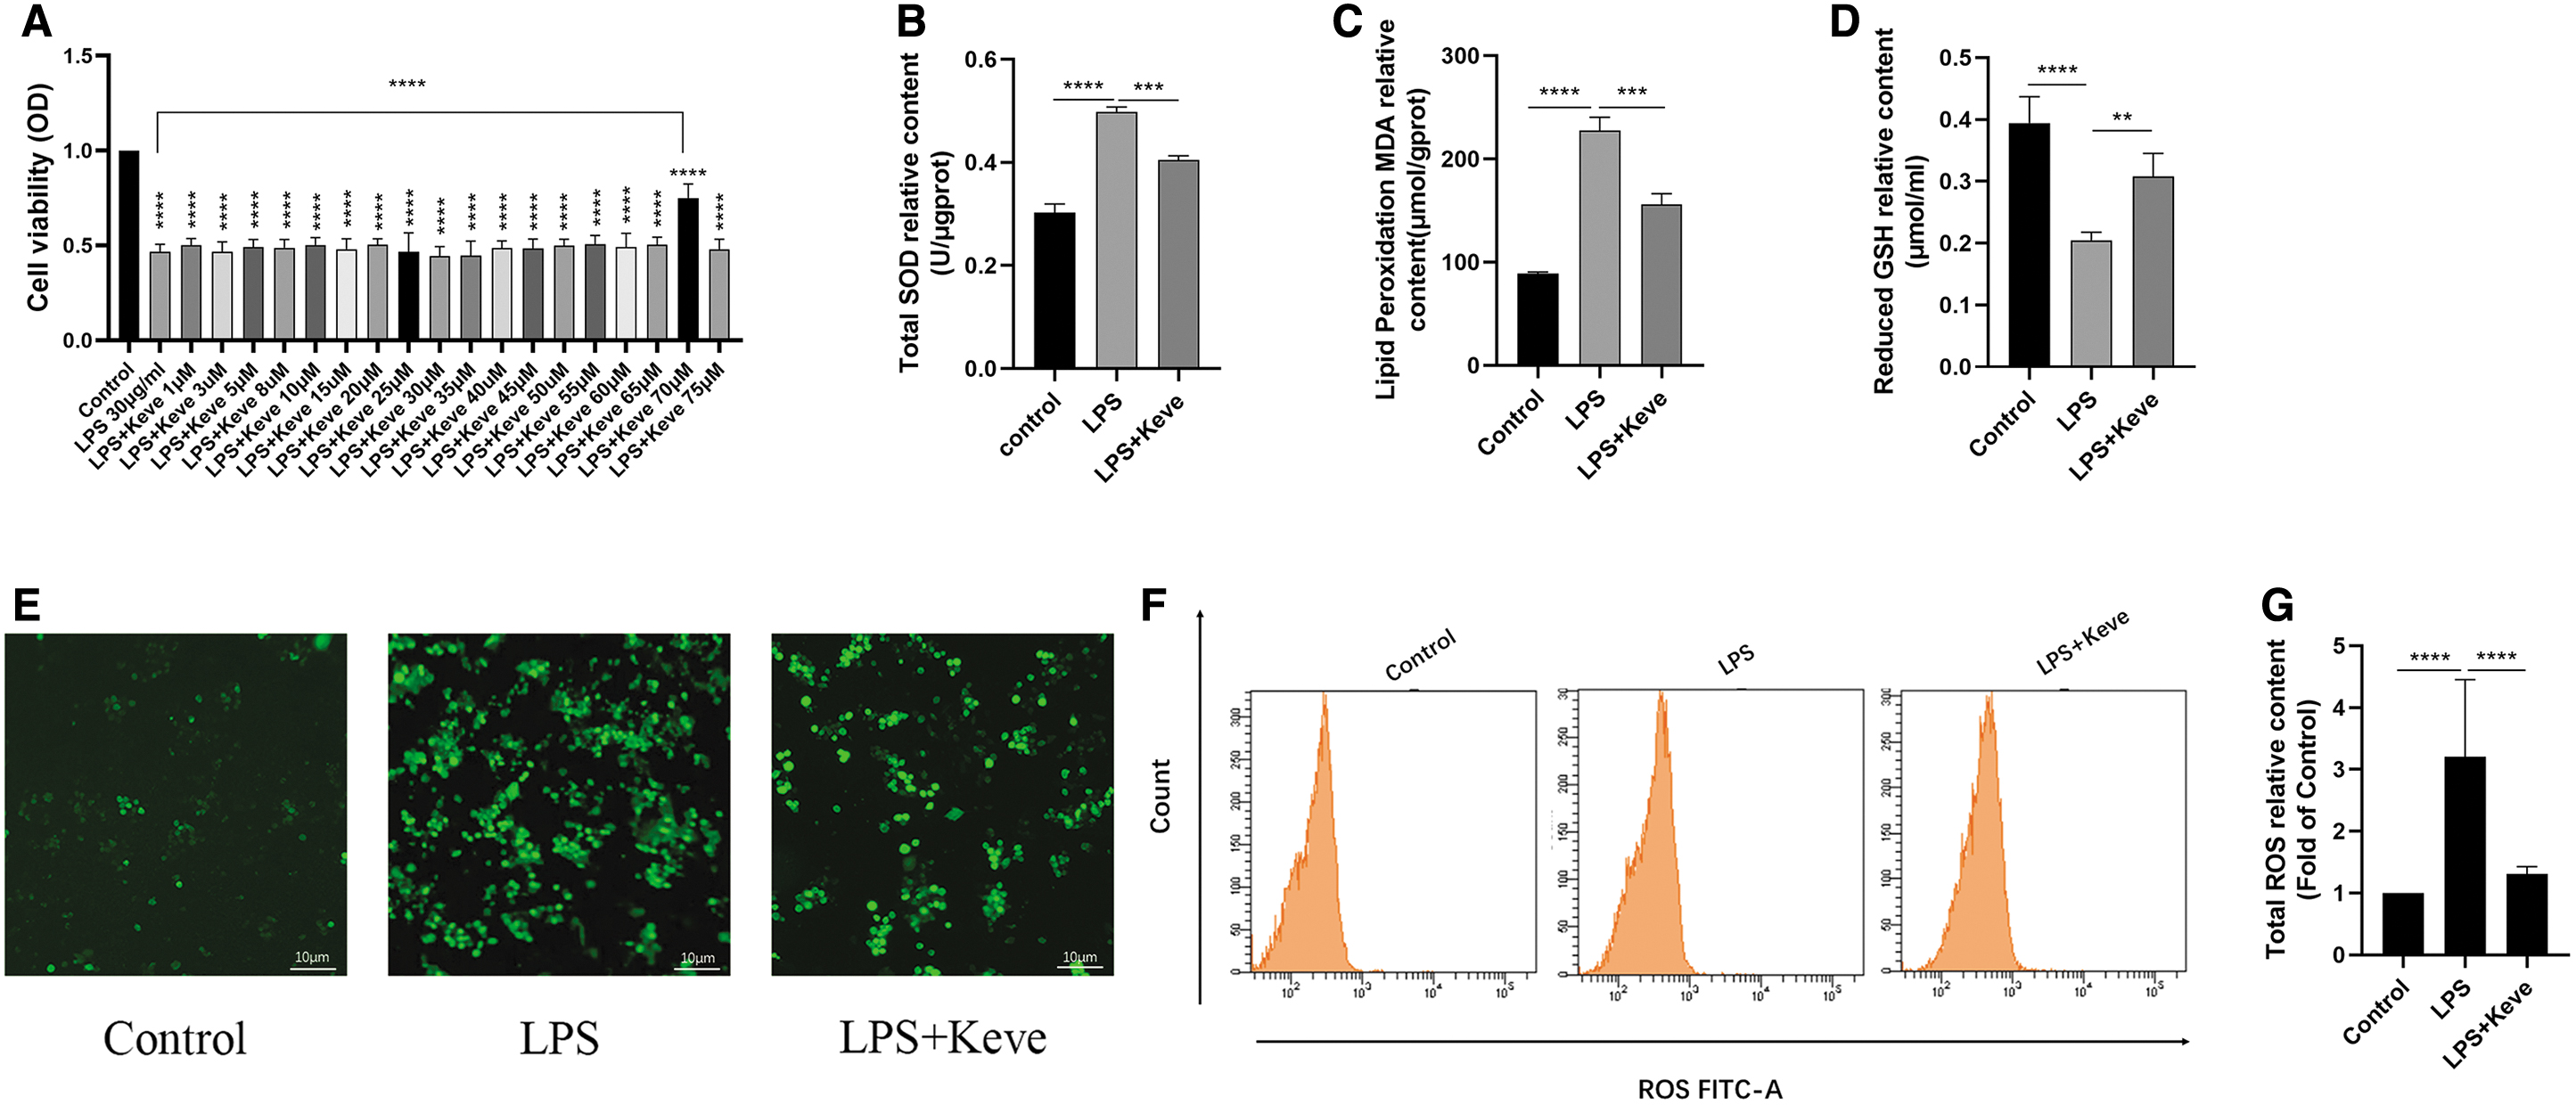
Up-regulation of P53 expression alleviated ferroptosis and inhibited AQP1 protein expression in LPS-induced RAW264.7 cells.
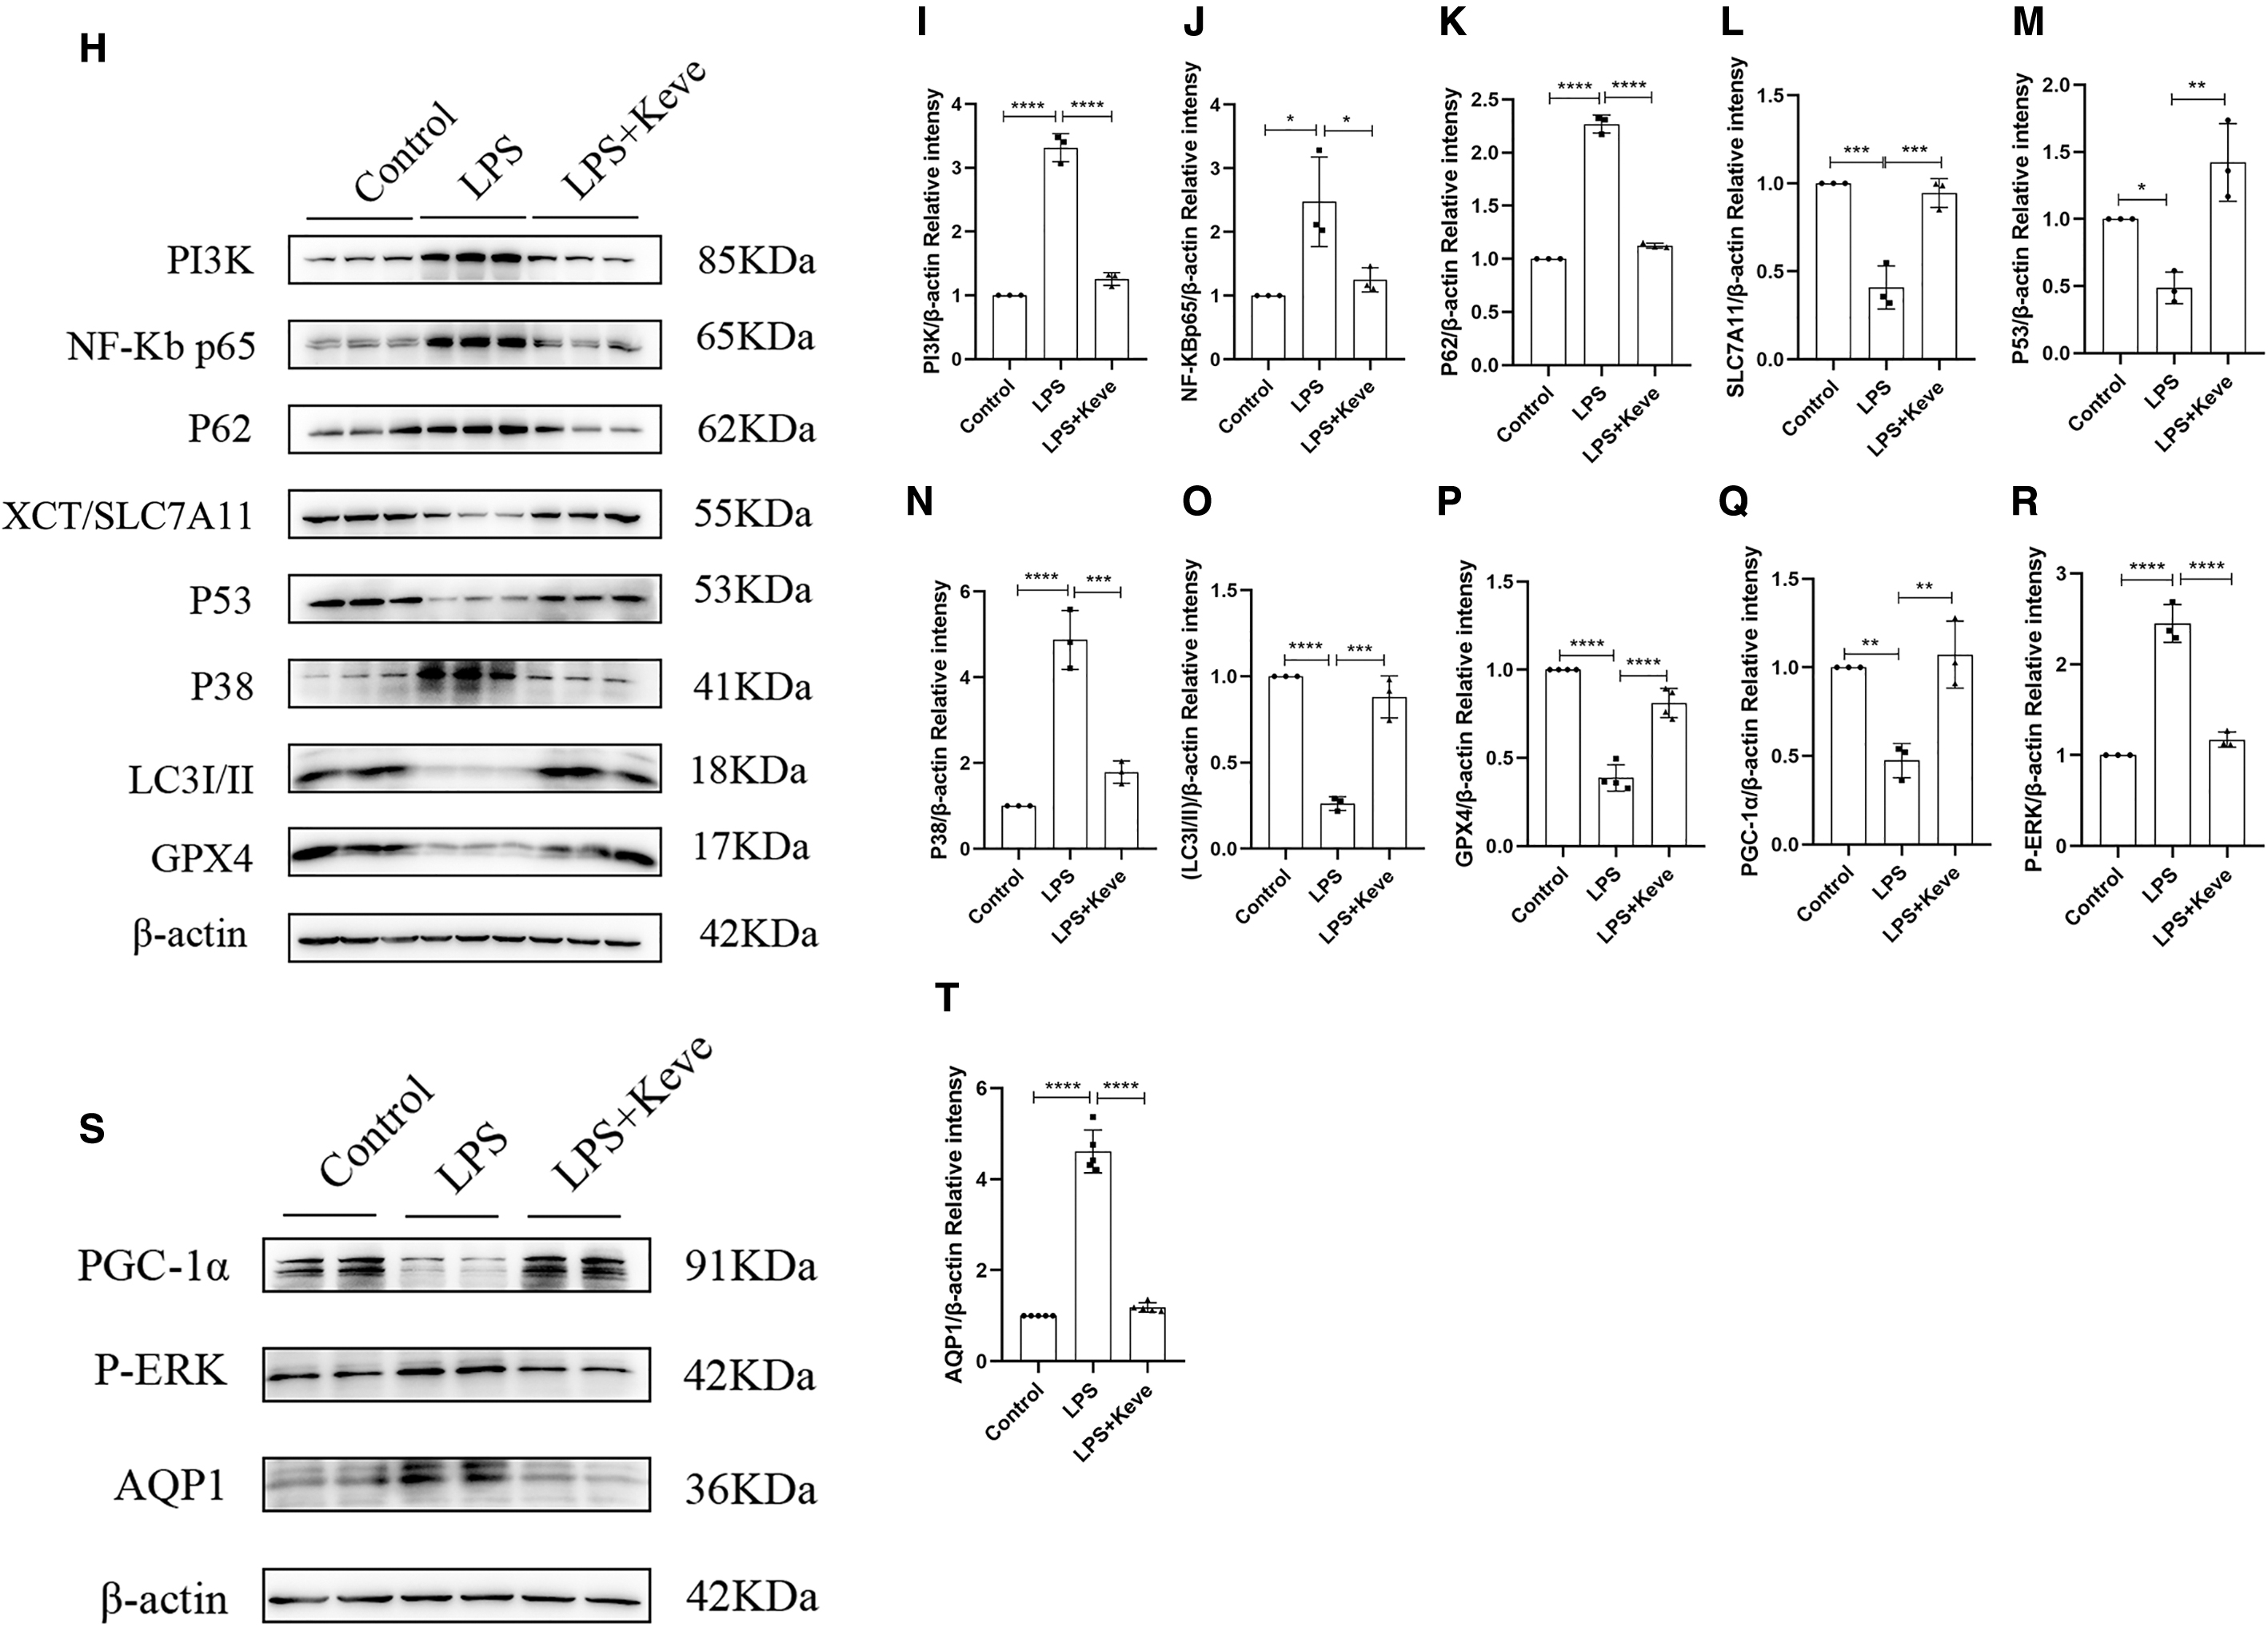
The results showed that the expression of T-SOD and MDA was significantly decreased and the level of GSH was significantly increased in the LPS+Keve group compared with the LPS group (Fig. 6B–D). Meanwhile, the results of fluorescence microscopy and flow cytometry showed that the ROS level in the LPS+Keve group was significantly lower than the LPS group (Fig. 6E–G). Moreover, WB results showed that the expression of XCT/SLC7A11 and GPX4 in the LPS+Keve group was dramatically higher than the LPS group (Fig. 6H, L, P).
Thus, these results showed that up-regulation of P53 expression significantly reduced ferroptosis in LPS-induced RAW264.7 cells. In addition, we found that AQP1 protein expression in the LPS+Keve group was significantly lower than the LPS group after the up-regulation of P53 protein by pretreatment with Keve (Fig. 6H, M, S, T). As expected, treatment with Keve reversed the LPS-induced elevated AQP1 mRNA expression and decreased P53 mRNA expression in RAW264.7 cells (Supplementary Fig. S2E).
Therefore, combined with the up-regulation of AQP1 by inhibiting P53, these results suggest a potential interaction between AQP1 and P53 in the process of ferroptosis of RAW264.7 cells induced by LPS.
Up-regulation of P53 expression alleviated M1 polarization, mitochondrial dysfunction, and autophagy block in LPS-induced RAW264.7 cells
As shown in Figure 7A and B, the gene expression of iNOS and IL-1β in the LPS+Keve group was significantly lower than in the LPS group. In contrast to iNOS and IL-1β, the gene expression of Arg-1 and Fizz in the LPS+Keve group was significantly higher than in the LPS group (Fig. 7A, B), suggesting that up-regulation of P53 alleviated M1 polarization of macrophages and promoted M2 polarization of macrophages.
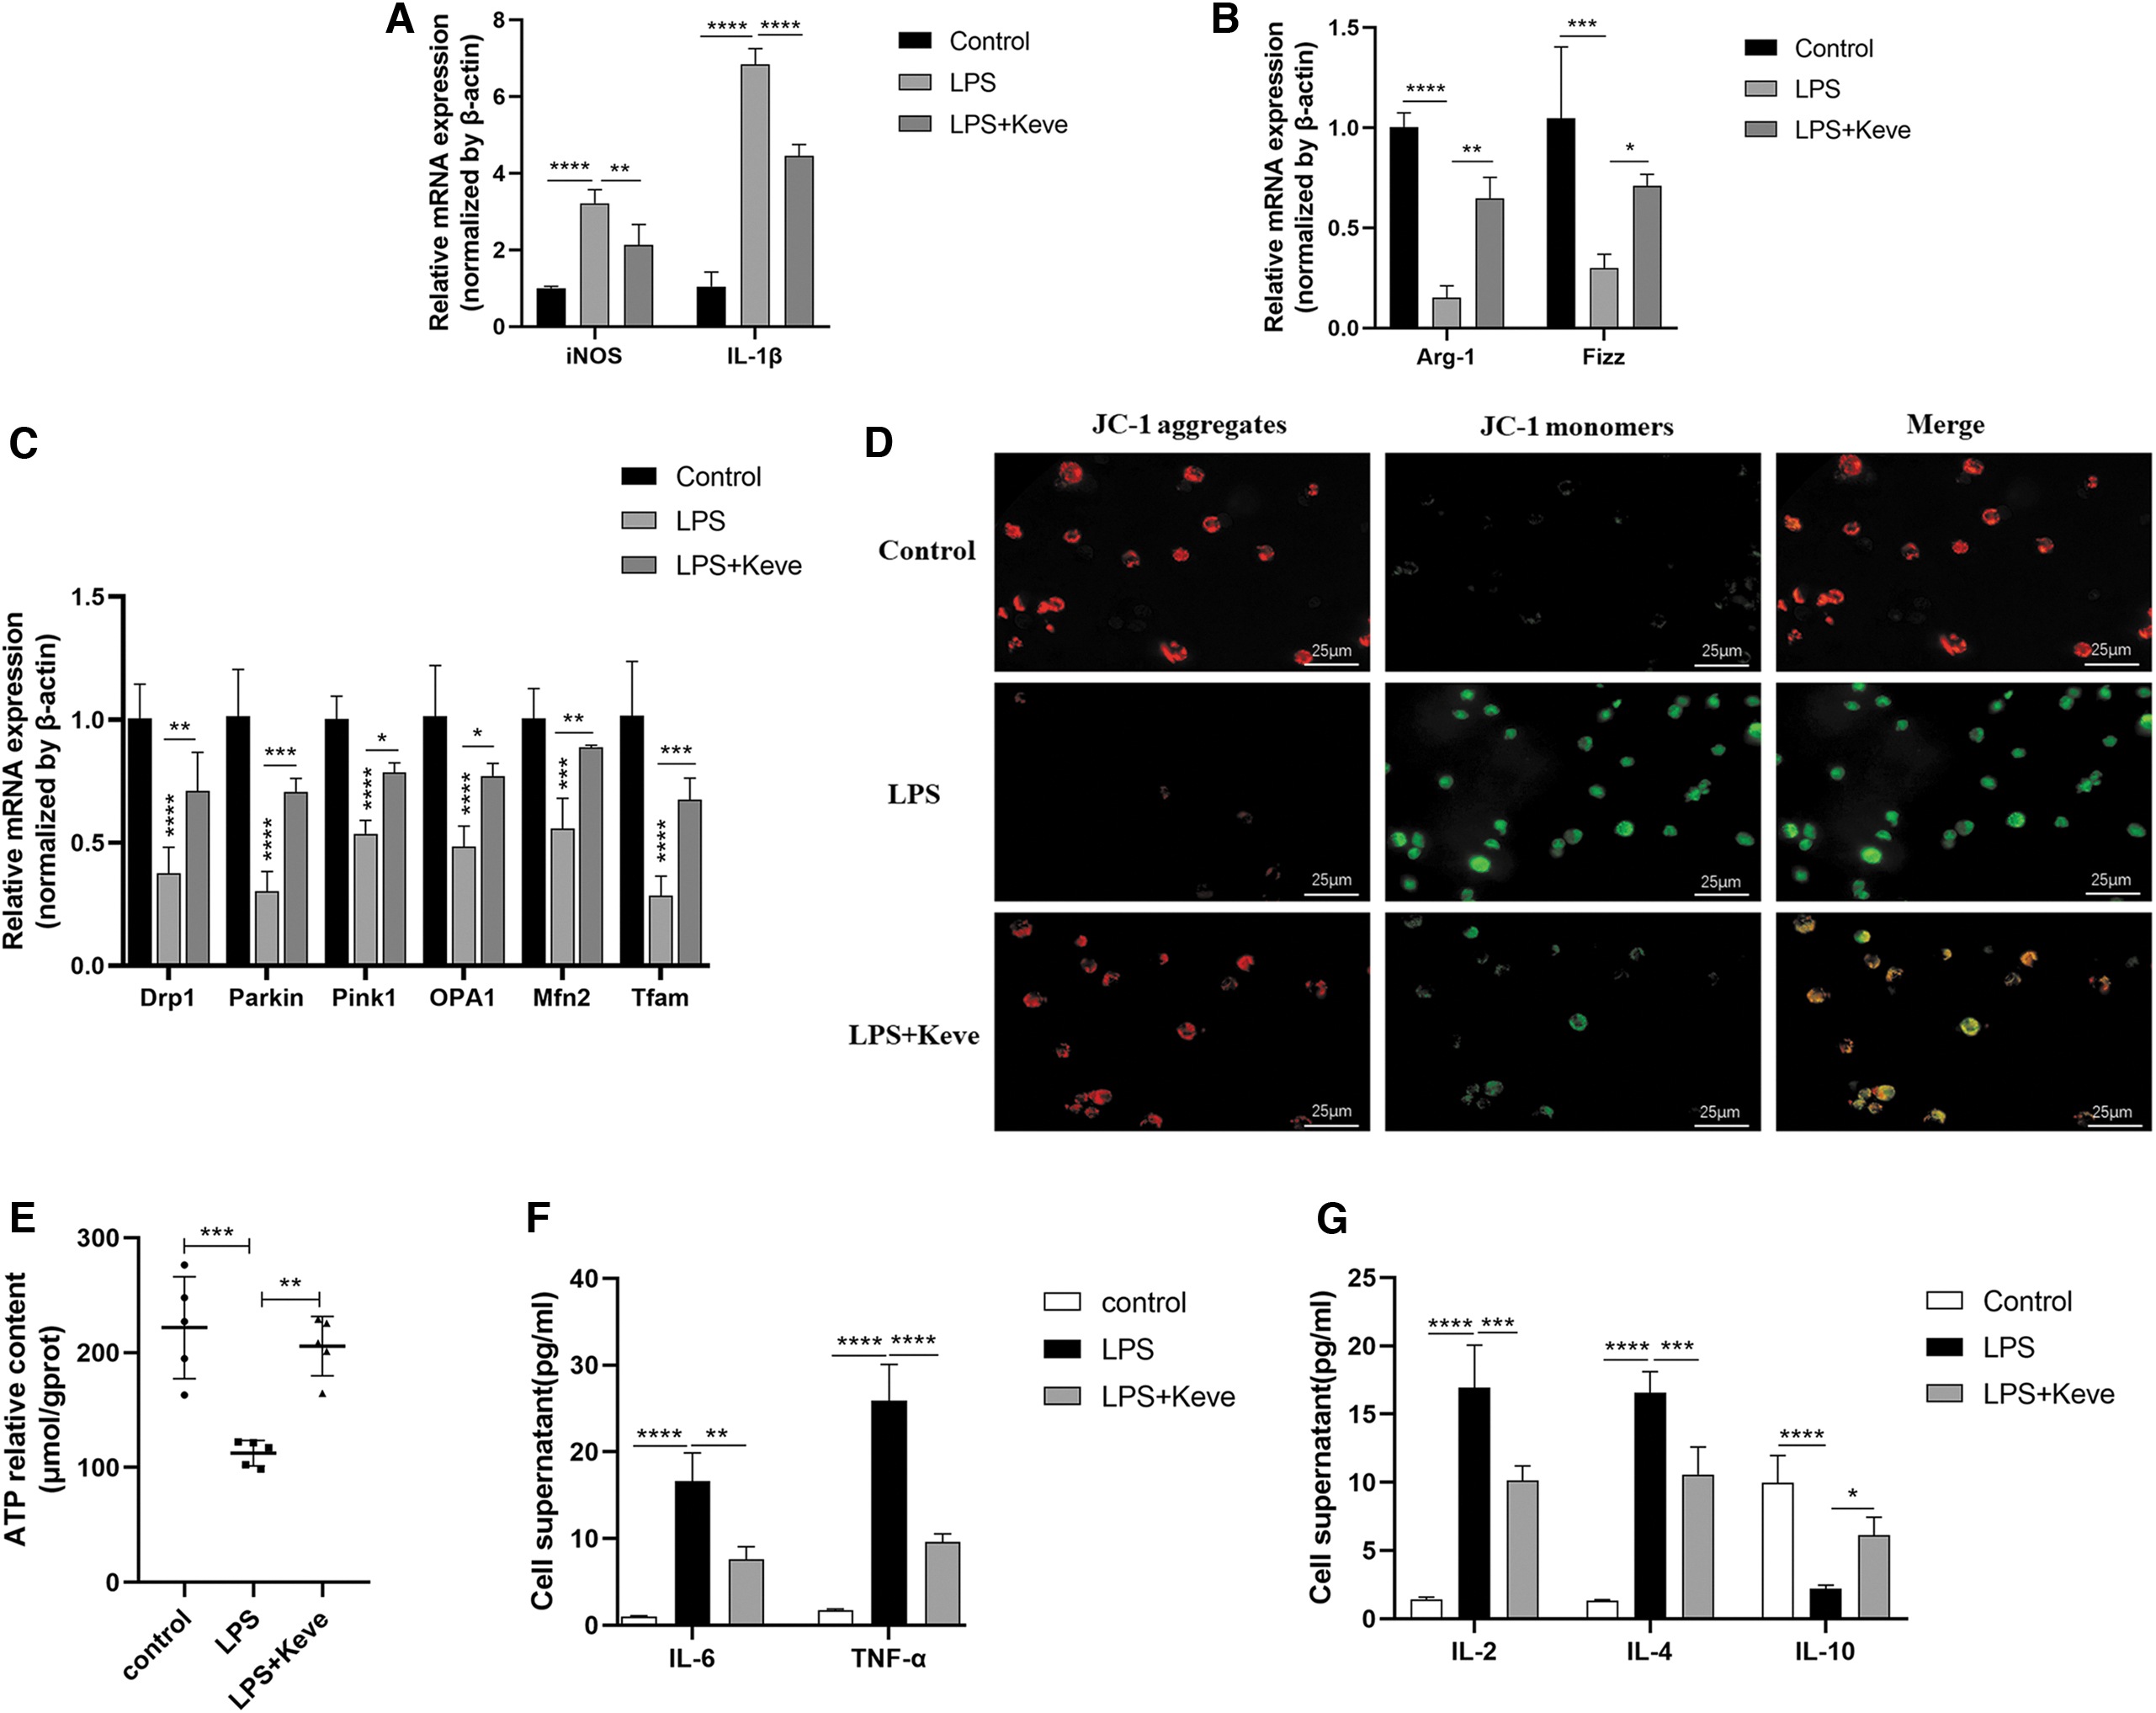
Up-regulation of P53 expression alleviated macrophage M1 polarization, mitochondrial dysfunction, and autophagy block in LPS-induced RAW264.7 cells.
Simultaneously, the levels of IL-6, TNF-α, IL-2, and IL-4 were significantly decreased and the expression of IL-10 was increased in the LPS+Keve group compared with the LPS group (Fig. 7F, G). The WB results showed that the protein expression of NF-κB p65, PI3K, P38, and P-ERK in the LPS+Keve group was markedly decreased compared with the LPS group (Fig. 6H–J, N, R, S).
Moreover, RT-qPCR, WB, and fluorescence microscopy showed that the levels of mitochondrial functional genes (Drp1, Parkin1, Pink1, OPA1, Mfn2, Tfam) and PGC-1α protein levels as well as mitochondrial membrane potential were significantly higher in the LPS+Keve group than in the LPS group (Figs. 6Q, 6S, 7C, 7D), indicating that Keve attenuated mitochondrial dysfunction of macrophages induced by LPS. Concurrently, the experimental results showed that the ATP content of LPS+Keve group was significantly higher than the LPS group (Fig. 7E). These results indicated that increased P53 expression alleviated mitochondrial dysfunction in LPS-induced RAW264.7 cells.
On the other hand, WB showed that the protein expression of P62 was significantly decreased and the protein expression of LC3I/II was increased in the LPS+Keve group compared with the LPS group (Fig. 6H, K, O), suggesting that the increased expression of P53 alleviated macrophage autophagy block. Therefore, these results showed that up-regulation of P53 expression via Keve pretreatment significantly alleviated M1 polarization, mitochondrial dysfunction, and autophagy block in LPS-induced RAW264.7 cells.
AQP1 promotes LPS-induced ferroptosis in RAW264.7 cells by inhibiting P53 expression
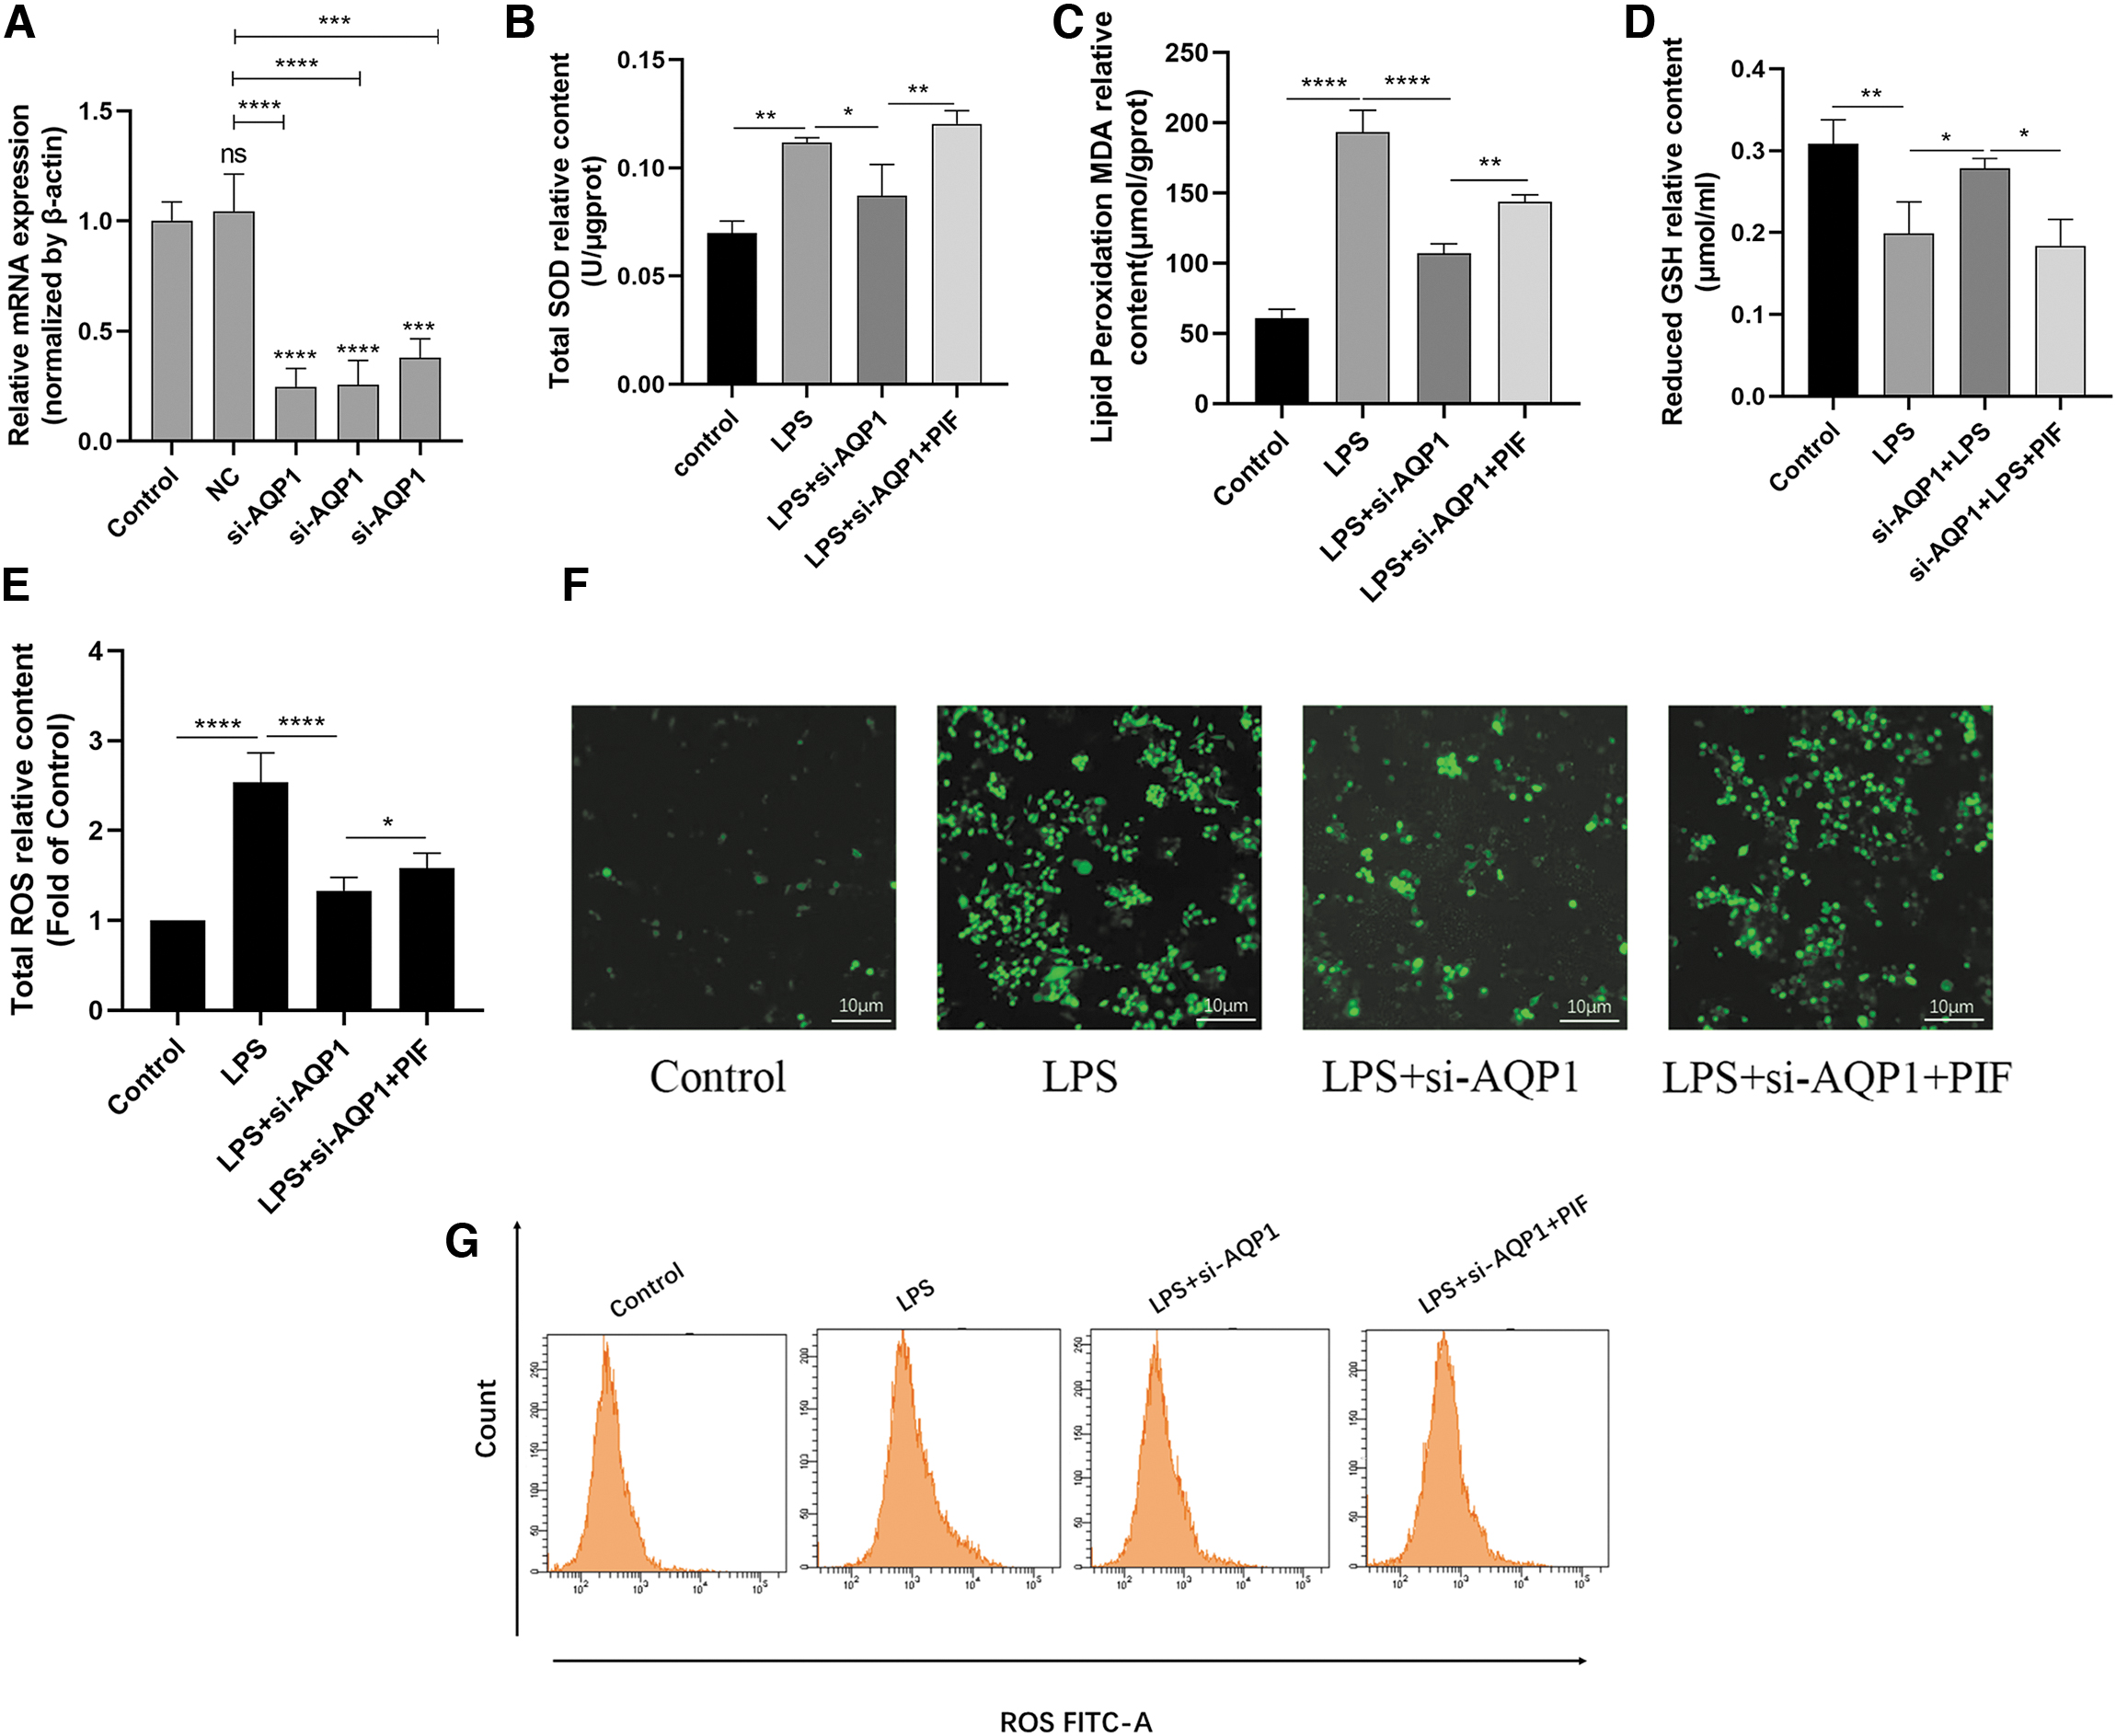
In the earlier cited experiments, we have demonstrated that AQP1 and P53 are involved in the process of ferroptosis of RAW264.7 cells induced by LPS and there is a potential interaction mechanism between AQP1 and P53 proteins. Next, we will further explore whether AQP1 mediates ferroptosis by regulating P53 expression in LPS-induced RAW264.7 cells. First, si-AQP1 was performed to successfully knock down AQP1 in RAW264.7 cells, as shown by RT-qPCR (Fig. 8A).
AQP1 promotes ferroptosis of RAW264.7 cells induced by LPS by inhibiting the expression of P53.
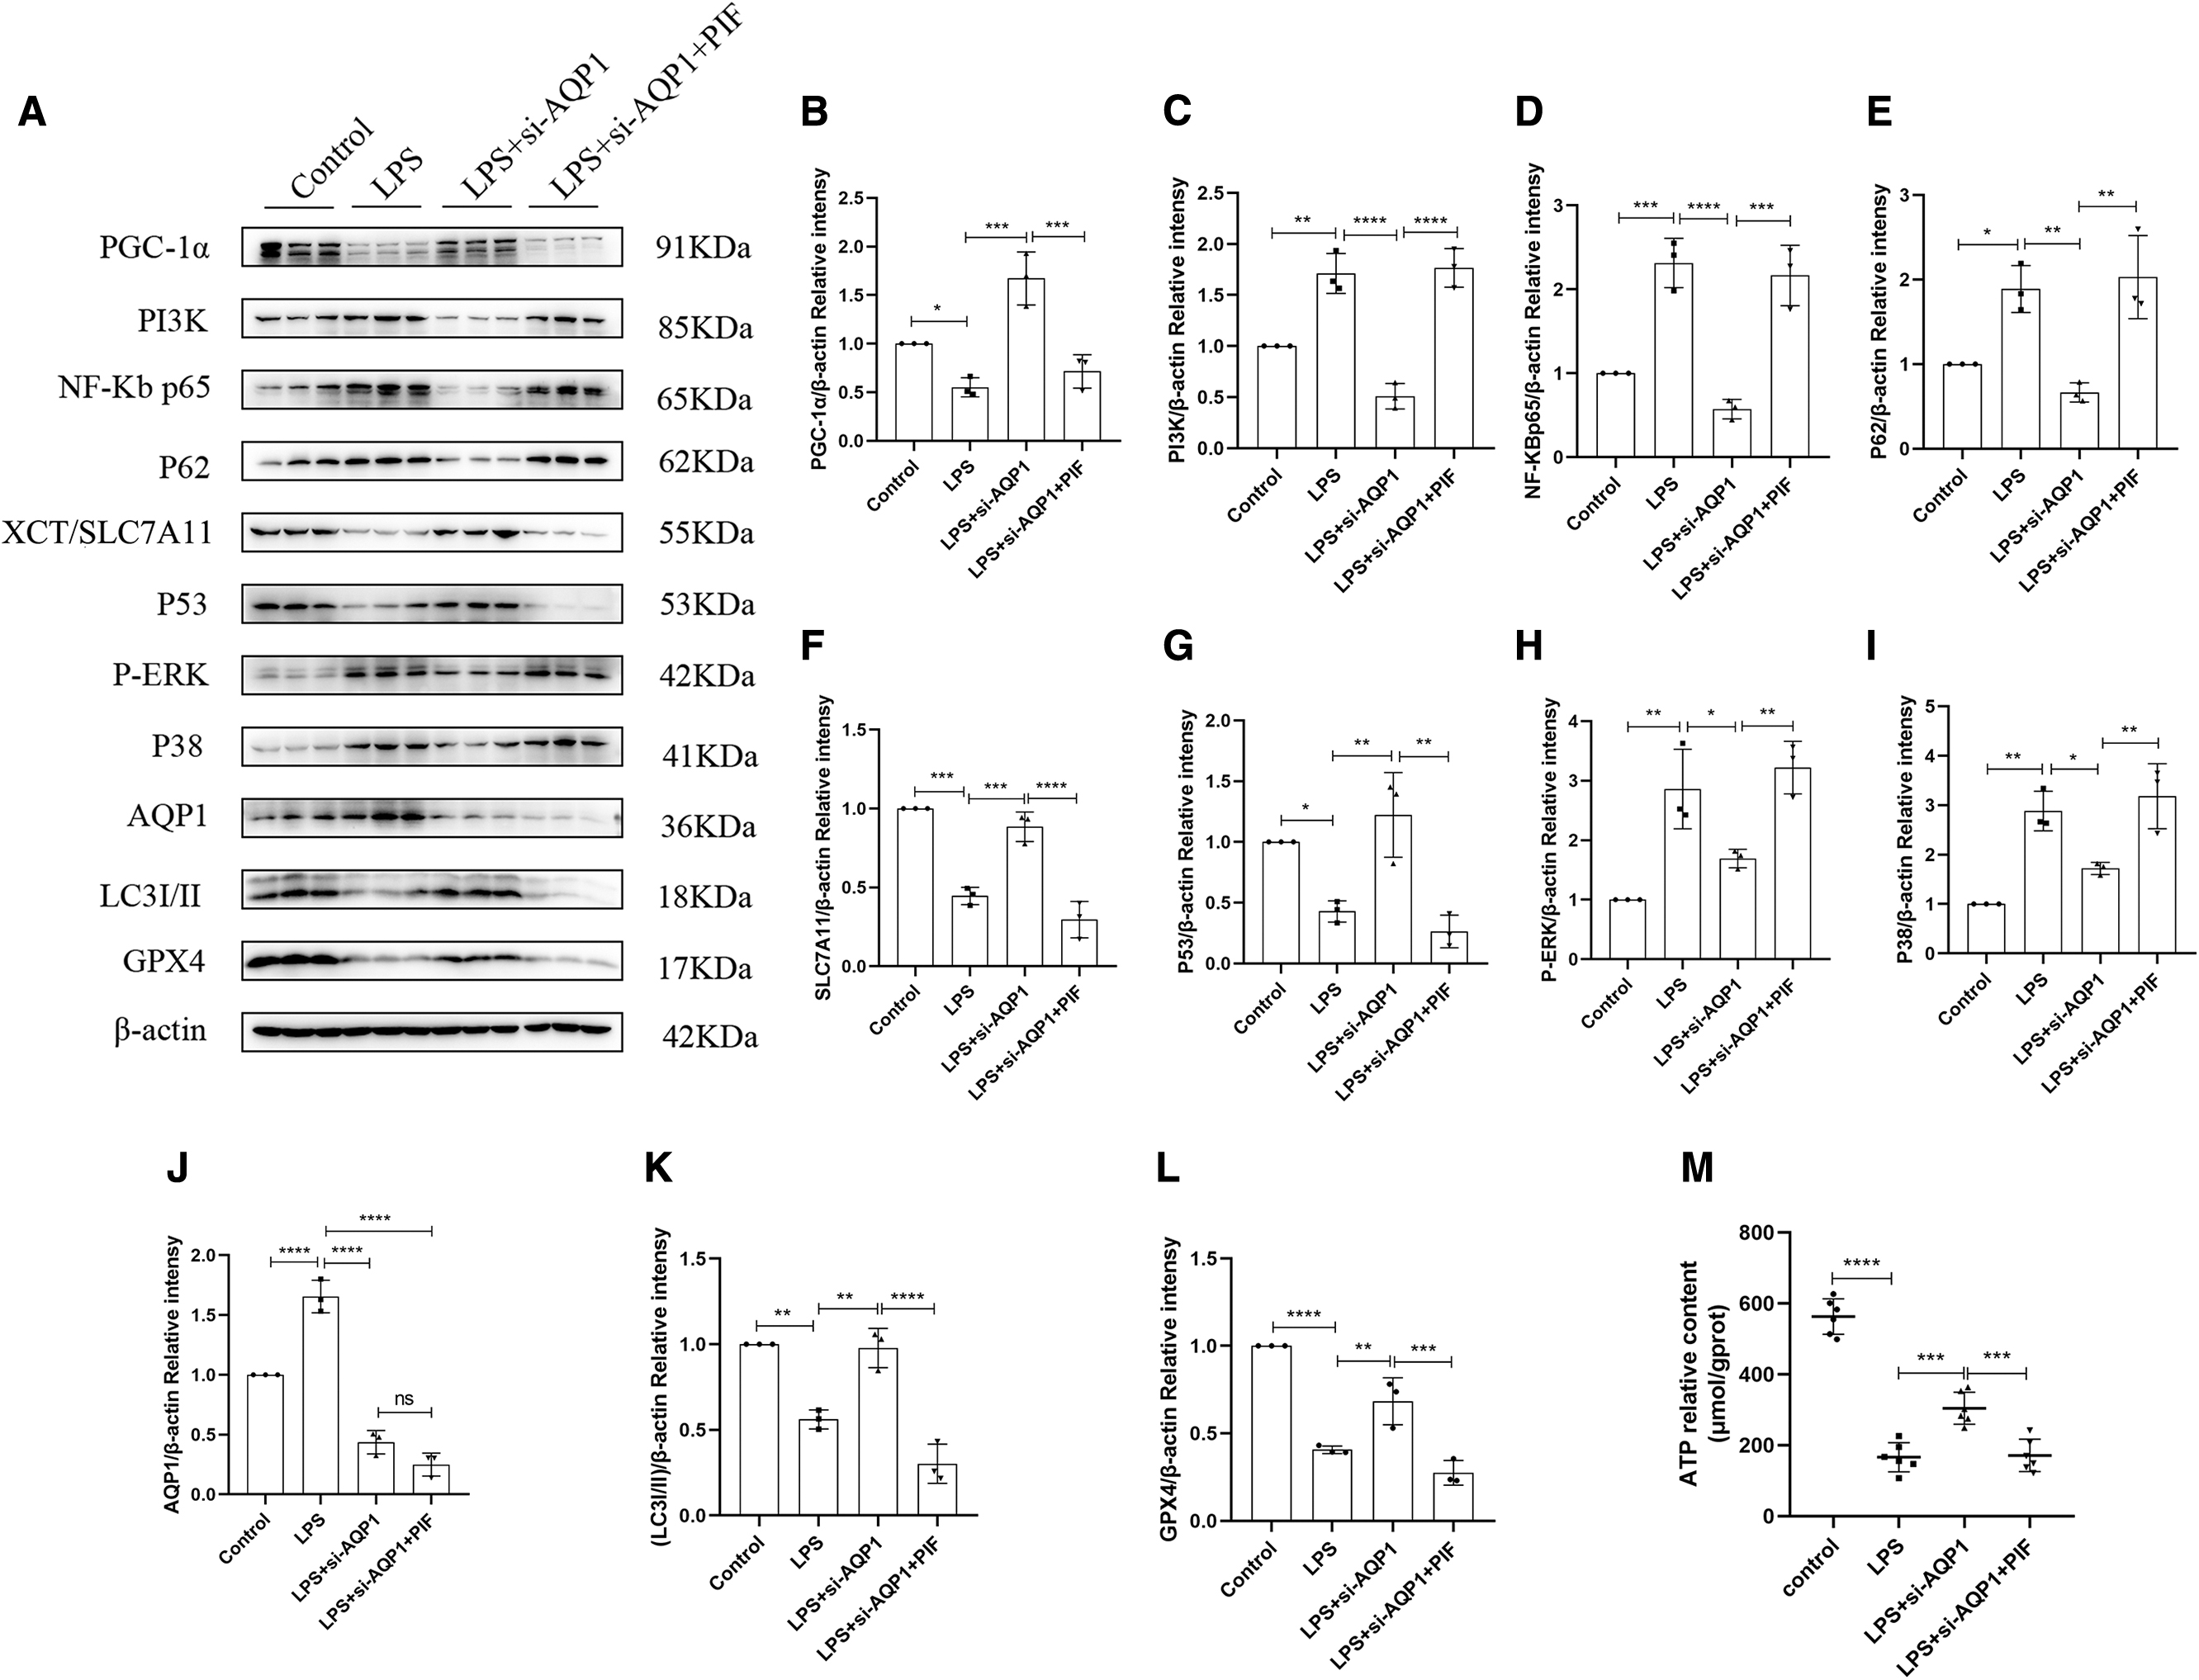
Second, the results of WB showed that the expression of AQP1 was significantly increased and the expression of P53 was significantly in the LPS group compared with the control group (Fig. 9A, G, J). However, the expression of P53 protein was significantly higher after AQP1 knockout (Fig. 9A, G, J). In addition, transfection of si-AQP1 to silence AQP1 partially attenuated the LPS-induced decrease in P53 gene expression in RAW264.7 cells. However, the addition of PIF on si-AQP1+LPS conditions eventually contributes to a reduction in P53 gene levels (Supplementary Fig. S2F). This result indicated that AQP1 can down-regulate P53 expression in LPS-induced RAW264.7 cells.
AQP1 aggravates M1 polarization of macrophages, autophagy obstruction, and mitochondrial dysfunction by inhibiting P53 expression.
Next, as shown in Figure 8B–D, the expression of T-SOD and MDA was significantly decreased and the GSH level was increased in the LPS+si-AQP1 group compared with the LPS group. However, the expression of T-SOD and MDA increased significantly and the level of GSH decreased significantly after inhibiting P53 expression (Fig. 8B–D). Similarly, fluorescence microscopy and flow cytometry showed that ROS levels were decreased in the LPS+si-AQP1 group compared with the LPS group (Fig. 8E–G).
However, the levels of ROS were significantly increased after inhibition of P53 (Fig. 8E–G), which was consistent with the results of T-SOD and MDA. In addition, WB results showed that the protein expression of XCT/SLC7A11 and GPX4 in the LPS+si-AQP1 group was significantly higher than the LPS group, whereas the inhibition of P53 significantly reversed this result (Fig. 9A, F, L). Therefore, these results confirmed that AQP1 promotes ferroptosis by down-regulation expression of P53 in LPS-induced RAW264.7 cells.
AQP1 aggravates M1 polarization, autophagy obstruction, and mitochondrial dysfunction by inhibiting P53 expression in LPS-induced RAW264.7 cells
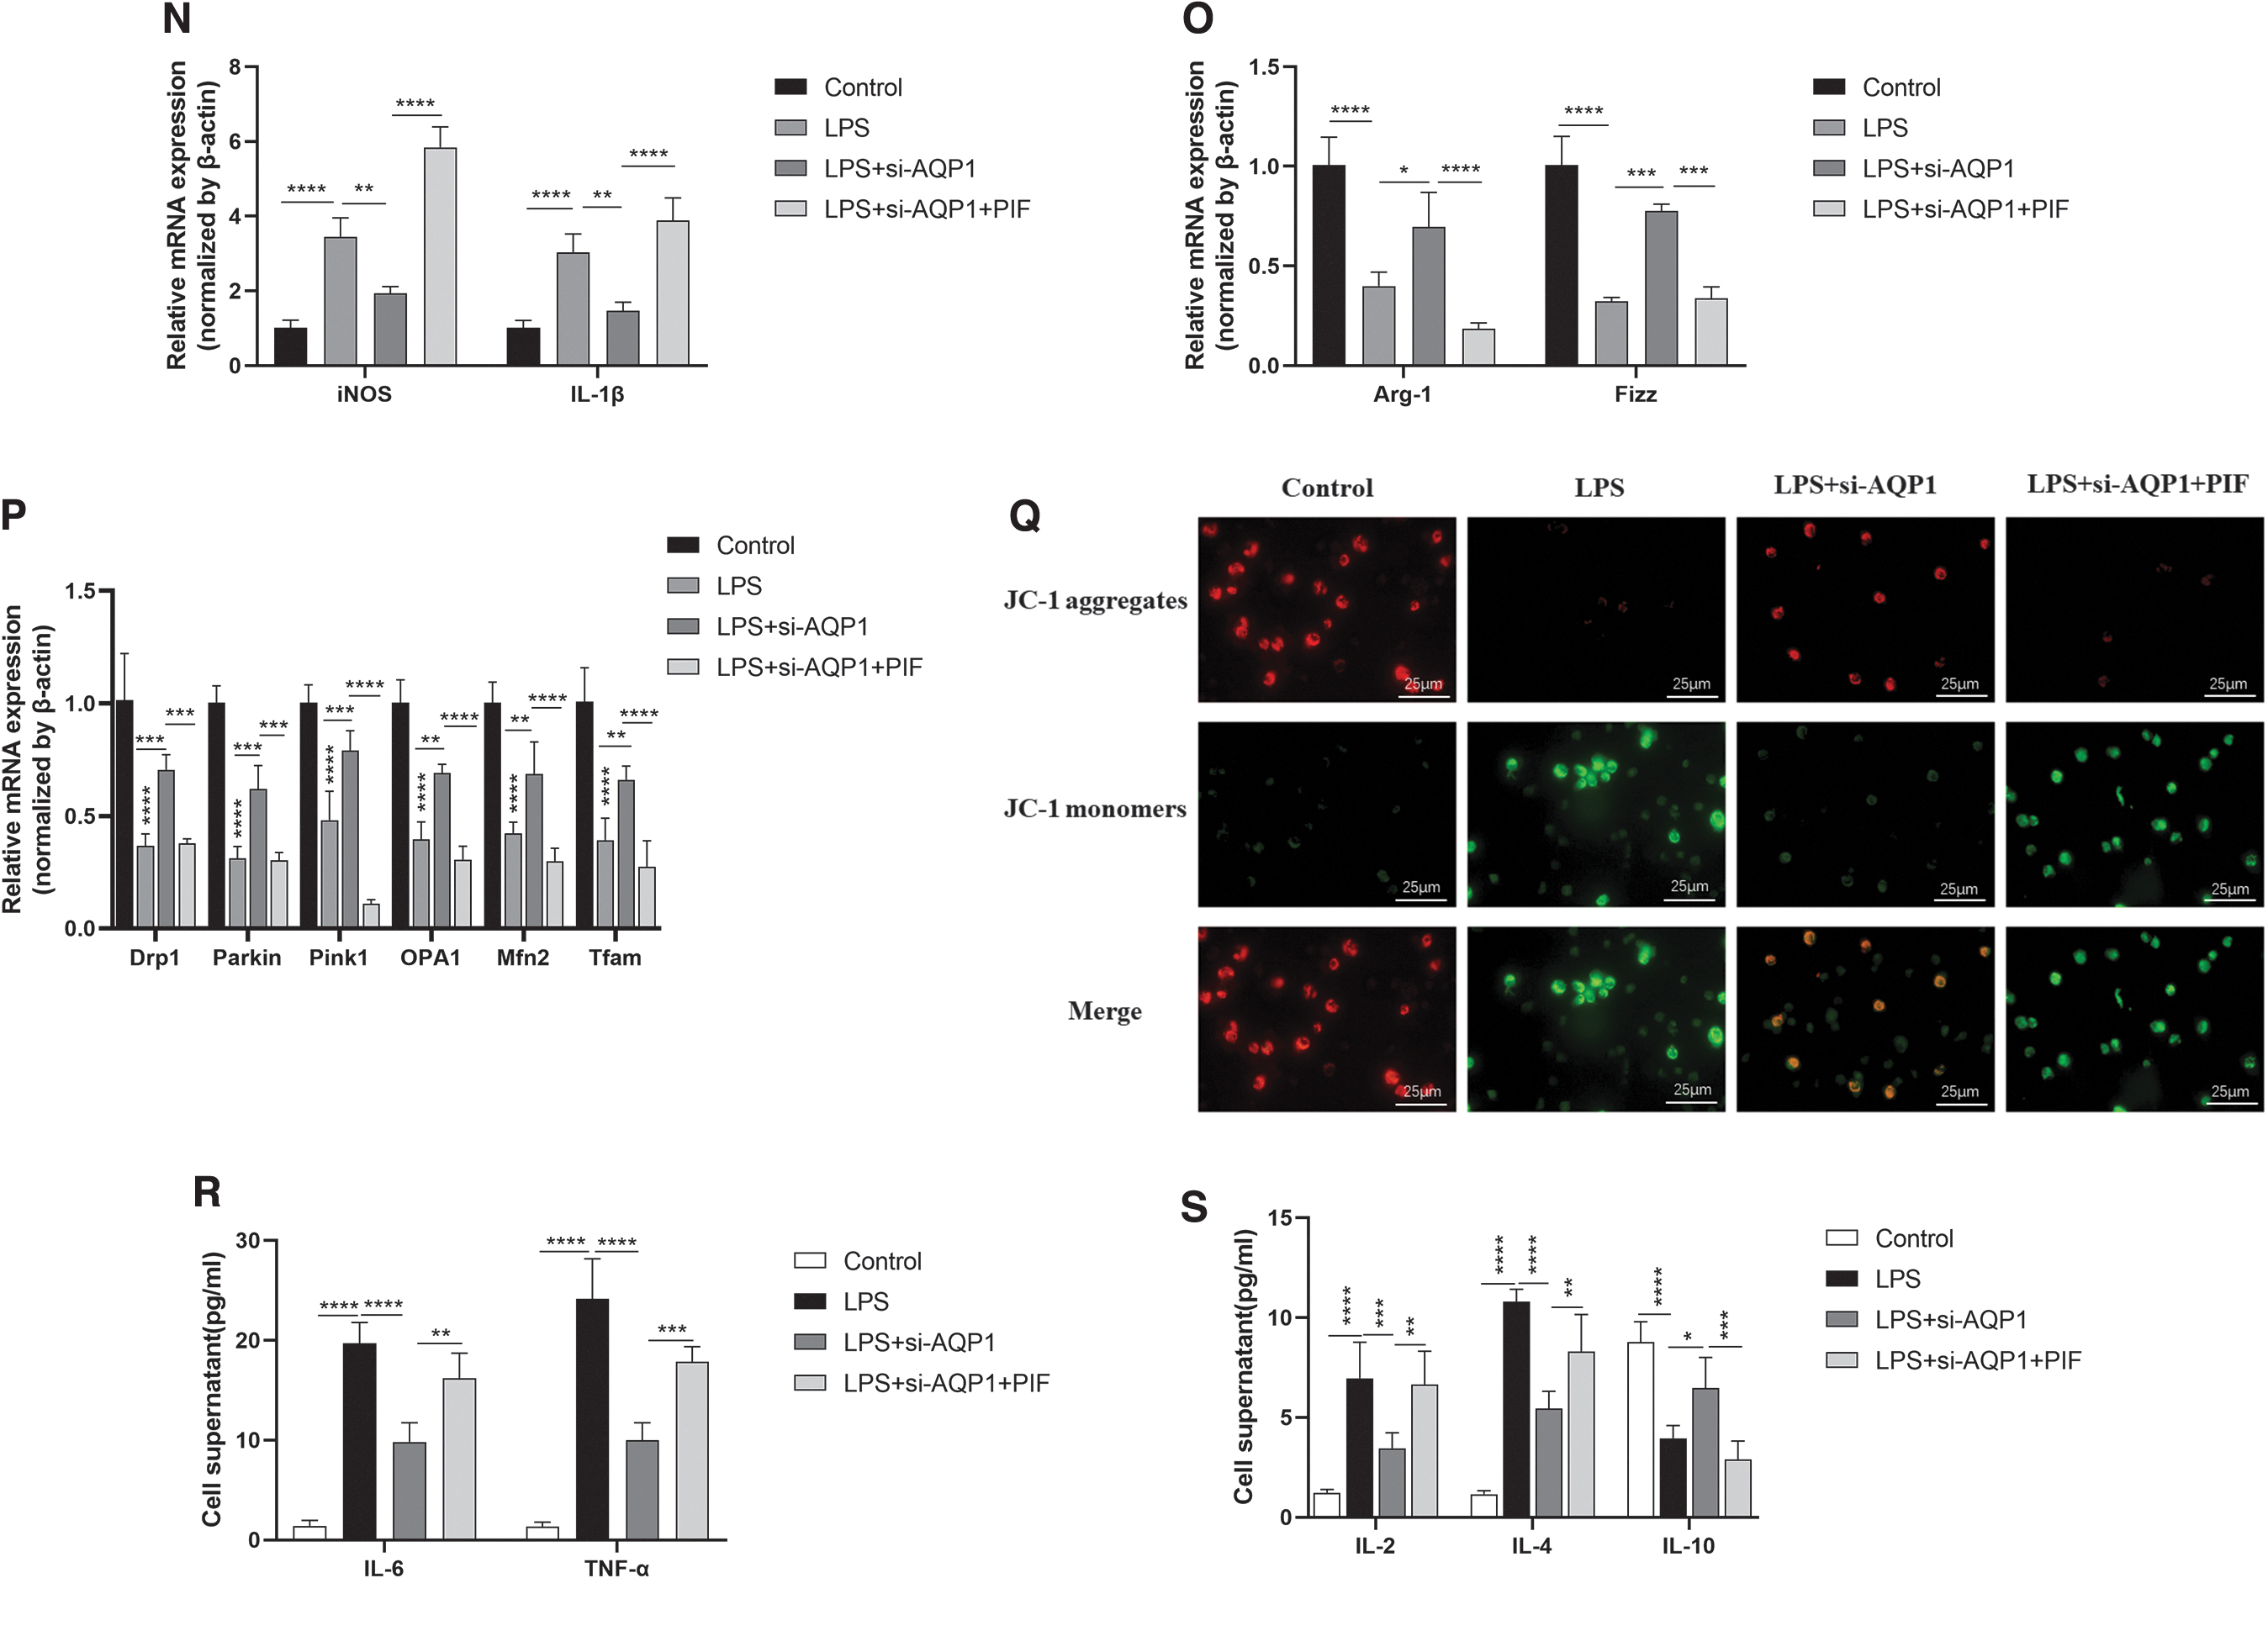
As shown in Figure 9N and O, the mRNA expression of iNOS and IL-1β in the LPS+si-AQP1 group was significantly decreased and the gene expression of Arg-1 and Fizz was significantly increased compared with the LPS group, which was obviously reversed after P53 expression was inhibited by PIF treatment. Concurrently, the levels of IL-6, TNF-α, IL-2, and IL-4 in the LPS+si-AQP1 group were decreased and the expression of IL-10 was increased compared with the LPS group (Fig. 9R, S).
However, inhibition of P53 with PIF on the basis of LPS+si-AQP1 reversed the results (Fig. 9R, S). The WB results showed that the protein expression of PI3K, NF-κB p65, P38, and P-ERK in the LPS+si-AQP1 group was significantly lower than the LPS group, whereas the inhibition of P53 expression significantly reversed this result (Fig. 9A, C, D, H, I). This result suggests that AQP1 promotes M1 polarization of macrophages and exacerbates the inflammatory response by inhibiting P53 expression.
Moreover, the results of RT-qPCR, WB, and fluorescence microscopy showed that mitochondrial biological function genes (Drp1, Parkin1, Pink1, OPA1, Mfn2, Tfam) and PGC-1α protein levels as well as mitochondrial membrane potential levels were increased in the LPS+si-AQP1 group compared with the LPS group, but they were significantly decreased after P53 expression was inhibited with PIF (Fig. 9A, B, P, Q).
Meanwhile, the experimental results showed that the ATP content of LPS+si-AQP1 group was significantly higher than the LPS group, whereas the inhibition of P53 observably reversed these results (Fig. 9M), which was consistent with the changing trend of mitochondrial functional gene expression and mitochondrial membrane potential level. This result suggests that AQP1 promotes mitochondrial dysfunction by reducing P53 expression in LPS-induced RAW264.7 cells.
For another, WB results showed that the expression of P62 was decreased and the expression of LC3I/II was significantly increased in the LPS+si-AQP1 group compared with the LPS group, whereas the inhibition of P53 observably reversed these results (Fig. 9A, E, K). This result suggested that AQP1 aggravated autophagy impairment by down-regulation of the expression of P53 in LPS-induced RAW264.7 cells. Taken together, our data indicate that AQP1-mediated P53 down-regulation contributes to M1 polarization, mitochondrial dysfunction, and autophagy block in LPS-induced RAW264.7 cells.
Discussion
In this study, we demonstrated the role of AQP1 in regulating ferroptosis, M1 polarization, mitochondrial dysfunction, and autophagy block in LPS-stimulated RAW264.7 cells through regulating P53 expression. Our results showed that AQP1 expression was significantly increased and P53 expression was significantly decreased during LPS-induced ferroptosis in RAW264.7 cells. Inhibition of ferroptosis via Fer (15 μM) treatment reversed this result.
This suggests that AQP1 and P53 are involved in the pathophysiological process of ferroptosis in LPS-induced RAW264.7 cells. Meanwhile, M1 polarization, mitochondrial damage, and autophagy blockage were significantly enhanced after LPS stimulation of RAW264.7 cells for 24 h. Then, RAW264.7 cells were treated with PIF, Keve, or si-AQP1 to explore the underlying mechanism of the interaction between AQP1 and P53 in regulating ferroptosis. The results showed that P53 played a protective role and AQP1 promoted ferroptosis, M1 polarization, mitochondrial dysfunction, and autophagy impairment by inhibiting the expression of P53 in LPS-stimulated RAW264.7 cells.
Ferroptosis is a kind of non-programmed cell death caused by lipid peroxidation, in which ROS, iron accumulation, and lipid peroxidation play an indispensable role (Dixon et al., 2012; Stockwell et al., 2017). Thus, inactivation of the intracellular antioxidant system is required for ferroptosis. Cystine (Cys2) is an important raw material for cellular synthesis of the antioxidant system, which promotes GSH synthesis through systemic XC-input and maintains the function of GPX4 (Cao and Dixon, 2016), thereby increasing cellular antioxidant capacity and reducing lipid ROS level.
Intracellular iron accumulation and lipid peroxidation can accelerate GSH depletion and inactivation of phospholipid peroxidase and GPX4 by inhibiting the import of Cys2 (Ursini et al., 1982; Yang et al., 2014). At this point, cellular antioxidant mechanisms are disrupted, as indicated by reduced GSH and GPX4 levels, leading to iron-dependent accumulation of lipid ROS, which are sufficient to kill cells (Dixon et al., 2012).
On the other hand, the accumulation of lipid ROS induces ferroptosis and further aggravates cell death. Moreover, AQP1 plays a crucial and indispensable role in the process of ROS production induced by oxidative stress. Montiel et al. (2020) demonstrated that elevated AQP1 expression in cardiomyocytes can induce oxidative stress and producing abundant ROS by promoting the transmembrane transport of extracellular hydrogen peroxide (H2O2) through its water pores, and eventually lead to irreversible hypertrophy of cardiomyocytes.
However, the authors also found that knockdown of AQP1 or selective blocking of AQP1 water transport channels rescued cardiomyocyte hypertrophy by effectively blocking extracellular H2O2 transport into cardiomyocytes and decreasing oxidative stress and ROS production (Montiel et al., 2020). This is consistent with our results that the levels of AQP1, ROS, MDA, and T-SOD were significantly increased and the expression of GSH, GPX4, and XCT/SLC7A11 was significantly decreased in LPS-stimulated RAW264.7 cells for 24 h.
Among them, it is thought that SOD stress increases to protect against oxidative damage. However, inhibition of ferroptosis with Fer (15 μM) or AQP1 silencing significantly reversed these results in LPS stimulated RAW264.7 cells.
Besides, mitochondria, as energy processing plants, have sophisticated and complex regulatory mechanisms. Mitochondria can regulate fusion and fission processes precisely and steadily through dynamin-like GTPases, including Mfn1/2, OPA1, and Drp1, ultimately mediating mitochondrial quality control and maintaining mitochondrial homeostasis (Youle and van der Bliek, 2012). During mitochondrial senescence or disruption by other mechanisms, putative kinase 1 (Pink1) induced by Parkin and PTEN is activated to timely removing damaged or depolarized mitochondria (Zhang and Lin, 2016), and maintaining the surviving mitochondria to division and provide energy for cells.
In addition, nuclear and mitochondrial encoded proteins can also control mitochondrial homeostasis and number by regulating mitochondrial fusion and regeneration through the biogenesis process, mainly manifested as the activation and up-regulation of nuclear respiratory factor (NRF1), PGC-1α, and Tfam (Braun and Westermann, 2017).
Most importantly, mitochondria have intrinsic antioxidant mechanisms, such as SOD and GSH, which can avoid their damage induced by ROS (Yin et al., 2012). However, continuous stimulation can induce cellular oxidative stress to produce large amounts of ROS, exceeding the ability of mitochondria and cells to resist oxidation or impaired antioxidant capacity will further induce mitochondrial fragmentation and cell death (Yin et al., 2012).
In our experimental results, the mRNA expression of Drp1, Parkin1, Pink1, OPA1, Mfn2, Tfam, and PGC-1α protein expression as well as mitochondrial membrane potential in RAW264.7 cells was significantly decreased after LPS stimulation for 24 h. Concurrently, LPS stimulation promoted the levels of ROS, MDA and T-SOD significantly increased, and GSH significantly decreased in RAW264.7 cells.
Among them, SOD level stress increased against oxidative stress, whereas GSH expression was consumed because of oxidative stress. Therefore, combining these findings with our experimental results, we suggest that the expression of AQP1 in RAW264.7 cells is increased after LPS stimulation for 24 h, inducing cellular oxidative stress to produce a large amount of ROS, and meanwhile, the antioxidant defense mechanism of the cells is activated to combat the injury. However, when the cellular antioxidant mechanism is unable to resist the continuous stimuli of LPS, mitochondria are damaged.
Subsequently, the damaged mitochondria will release plenty of oxidative stress inducing factors into the cytoplasm, which further promotes oxidative stress to produce abundant ROS, forming a perfect closed loop of ROS-mitochondrial damage-ROS, and eventually leading to cell peroxidation damage, namely ferroptosis, which is mainly manifested as increased ROS, MDA, and T-SOD level as well as decreased GSH level, SLC7A11, and GPX4 protein expression. However, silencing AQP1 will block all of these lesions in LPS-induced RAW264.7 cells.
Macrophages are induced to polarization and altered phenotype during stimulation or injury, mainly from M0 to M1 phenotype or M2 phenotype, indicating a shift from promoting inflammation at the beginning of injury to inhibiting inflammation during the repair process after injury (Han et al., 2019). M1 macrophages, known as pro-inflammatory macrophages, aggravate inflammatory responses by releasing pro-inflammatory cytokines (e.g., IL-6, TNF-α) (Han et al., 2019).
In contrast to pro-inflammatory macrophages, M2 macrophages, known as anti-inflammatory macrophages, alleviate inflammation mainly by releasing an anti-inflammatory factor (e.g., IL-10). AQP1, P38, PI3K, and NF-κB p65 are closely related to pro-inflammatory (classically activated/M1) macrophages and inflammatory responses, respectively. Li et al. (2019). demonstrated in LPS-induced acute kidney injury (AKI) that AQP1 mediated the decrease of macrophage M1 polarization phenotype, promoted the increase of M2 phenotype, and reduced the release of inflammatory factors IL-6 and TNF-α by inhibiting the P38 signaling pathway.
In addition, the authors demonstrated that AQP1 attenuates NF-κB activity through p38 signaling in LPS-stimulated RAW264.7 cells (Li et al., 2019). Similarly, Liu et al. (2020) also demonstrated that AQP1 mediated macrophage M2 polarization and reduced inflammatory response through PI3K signaling pathway in a rat model of LPS-induced AKI. Our results showed that AQP1, P38, PI3K, and NF-κB P65 were significantly increased, iNOS mRNA and IL-1β mRNA were increased, and Arg-1 mRNA and Fizz mRNA expression was decreased in LPS-stimulated RAW264.7 cells, indicating that M1 polarization phenotype of macrophages was acquired and M2 polarization phenotype was decreased.
Simultaneously, macrophage secretion of pro-inflammatory cytokines IL-6 and TNF-α were increased and anti-inflammatory cytokine IL-10 was decreased. However, silencing AQP1 significantly reversed these results. IL-2 promotes the differentiation of Th2 cells and stimulates the activation and proliferation of NK cells, CTL and LAK cells to enhance the anti-tumor effect (Robertson et al., 2014). IL-4 promotes Th2 cell proliferation and humoral immune responses (Robertson et al., 2014).
Thus, IL-2 is a proinflammatory cytokine, whereas IL-4 is an anti-inflammatory cytokine. Our results showed that IL-2 expression increased and promoted inflammatory response and IL-4 was also increased because of its anti-inflammatory effect in LPS-induced RAW264.7 cells.
Inflammation can also contribute to altered autophagy. Liu et al. (2015) revealed the regulatory mechanism of macrophage autophagy damage on inflammation in an obese mouse model treated with low-dose LPS. The results of the authors show that upregulation of macrophage autophagy alleviates systemic inflammatory response and complications in obese mice by increasing the proportion of anti-inflammatory macrophages (M2) and inhibiting the secretion of inflammatory factors (Liu et al., 2015).
This result suggests that the inflammatory response and autophagy are antagonistic processes. These findings supported our experimental results. Our data showed that M1 polarization of macrophage aggravated the inflammatory response, and meanwhile, P62 protein expression was increased and LC3I/II protein expression was decreased, indicating that cell autophagy was impaired. However, silencing AQP1 or up-regulating P53 expression reduced the inflammatory response and restored the impaired autophagy.
Ferroptosis involves three core metabolites: iron, lipids, and ROS. Previous studies have reported that P53 is involved in the metabolic regulation of iron, lipids, and ROS (Stockwell et al., 2017). Jiang et al. (2015) found for the first time that P53 can inhibit SLC7A11 expression at the transcriptional level, and it can promote ferroptosis of cells and lead to tumor suppression. The authors further showed that acetylation of P53K101 is essential for the inhibition of SLC7A11 by P53 (Jiang et al., 2015). In 2019, the Chu (Chu et al., 2019) laboratory demonstrated that the P53-SLC7A11 axis can also promote ferroptosis in a GSH-independent manner.
The authors identified the lipid oxidase ALOX12 as a key regulator of the occurrence of p53-dependent ferroptosis (Chu et al., 2019). It is interesting to note that P53 has also been shown to inhibit ferroptosis in some cases. The cell cycle regulatory protein P21, cell cycle-dependent kinase inhibitor, is an important target gene of P53 (Tarangelo et al., 2018). Mechanistically, p53 inhibits cell cycle progression by inducing the increase of p21, thereby converting part of the raw materials used for nucleic acid synthesis to the synthesis of reduced NADPH and GSH, resulting in the reduction of the accumulation of lipid ROS and the inhibition of ferroptosis (Tarangelo et al., 2018).
This is consistent with our experimental results. The results showed that pretreatment with PIF (15 μM) for 24 h promoted T-SOD; MDA and ROS levels significantly increased; and GSH, SLC7A11, and GPX4 protein expression significantly decreased in LPS-induced RAW264.7 cells, suggesting that inhibition of P53 aggravated ferroptosis in LPS-stimulated RAW264.7 cells. However, up-regulation of P53 expression by Keve (a P53 agonist) significantly reduced ferroptosis in LPS-induced RAW264.7 cells. In addition, P53 plays a crucial role in macrophage polarization and inflammatory response.
Sutton et al. (2013) demonstrated that silencing P53 or inhibiting p53 with PIF significantly promoted renal neutrophil and macrophage infiltration in a mouse model of AKI induced by ischemia-reperfusion. Mechanistically, knockout or inhibition of macrophage p53 aggravates the degree and duration of inflammation by increasing the proportion of pro-inflammatory macrophages (M1) and decreasing the proportion of anti-inflammatory macrophages (M2), ultimately leading to aggravated kidney injury (Sutton et al., 2013).
Similarly, Dagher et al. (2012) demonstrated in vitro that inhibition of P53 expression in macrophage cultured with PIF (10 μM) significantly increased macrophage immune activity.
Further, wild-type P53 is also an inhibitor of the inflammatory transcription factor NF-κB p65, but mutant P53 does not (Komarova et al., 2005). This is consistent with our results that the proportion of M1 polarization macrophages was increased and the proportion of M2 polarization macrophages was decreased by using PIF (15 μM) treatment for 24 h in LPS-induced RAW264.7 cells. That promoted the NF-κB p65 expression and secretion of inflammatory cytokines (IL-6, TNF-α, IL-2), and it reduced the expression of anti-inflammatory factor IL-10.
However, treatment with Keve, a P53 agonist, significantly reversed these results. On the other hand, P53 is also involved in the regulation of mitochondrial biological function and autophagy. Zhang et al. (2009). demonstrated that inhibition of P53 expression using PIF alleviates neurodegenerative lesions by ameliorating autophagy activation and cell death mediated by mitochondrial dysfunction in the rat striatum.
However, our results showed that inhibition of P53 expression with PIF aggravated mitochondrial dysfunction and autophagy disorder in LPS-induced RAW264.7 cells, mainly manifested as decreased mRNA expression of Drp1, Parkin1, Pink1, OPA1, Mfn2, and Tfam; the protein expression of PGC-1α and LC3I/II; as well as mitochondrial membrane potential, but P62 protein level was increased. This paradoxical result may be related to differences due to the cell lines and disease models studied.
Taken together, these experimental results suggest that P53 plays a cytoprotective role by attenuating the processes of ferroptosis, M1 polarization, mitochondrial dysfunction, and autophagy block in RAW264.7 cells stimulated by LPS.
We have previously described that AQP1 and P53 play crucial roles in LPS-induced ferroptosis, M1polarization, mitochondrial damage, and impaired autophagy in RAW264.7 cells, respectively. Interestingly, Kandemir et al. (2018). demonstrated that Zingerone (ZO, 25 and 50 mg/kg body weight) can prevent vancomycin-induced AKI, and this process is mainly mediated by down-regulation of P53 expression and up-regulation of AQP1 level in the kidney. In addition, Schuoler et al. (2017) and Liu et al. (2019) found in a mouse model of pulmonary hypertension that increased AQP1 expression in pulmonary artery smooth muscle cells promoted cell proliferation and migration by inhibiting P53 expression.
This is consistent with our findings that LPS stimulation of RAW264.7 cells for 24 h significantly increased AQP1 expression and decreased P53 expression, promoting macrophage ferroptosis, M1 polarization, mitochondrial damage, and impaired autophagy. Next, silencing AQP1 significantly increased the expression of P53 and alleviated the earlier results in LPS-induced RAW264.7 cells.
Subsequently, we continued to inhibit the expression of P53 via PIF (15 μM) on the basis of the LPS+si-AQP1 group, and we found that the biological processes of RAW264.7 cells such as ferroptosis, M1 polarization, mitochondrial damage, and impaired autophagy were aggravated. This further demonstrated that silencing AQP1 alleviated biological changes by up-regulating P53 in LPS-induced RAW264.7 cells.
To sum up, we conclude that AQP1 can affect the ferroptosis, polarization phenotype, mitochondrial biological functions, and autophagy processes of LPS-stimulated RAW264.7 cells by regulating the P53 signaling pathway. This study presents direct evidence that AQP1 or P53 are crucial determiners that can regulate the biologic behaviors of RAW264.7 cells and the inhibition of AQP1 or up-regulation of P53 may be a prospective strategy for the alleviation of ferroptosis, M1 polarization, mitochondrial damage, and autophagy disorder in LPS-stimulated RAW264.7 cells.
Data Availability
The datasets used and/or analyzed during the current study is available from the corresponding author on reasonable request.
Footnotes
Authors' Contributions
W.L. performed the experiments. L.L., D.L., C.L., and L.J. analyzed the data. Y.J. made substantial contributions to conception and design, acquisition of data, analysis and interpretation of data, and acquisition of funding. All authors gave their final approval of the version to be published.
Disclosure Statement
The authors declare that they have no conflict of interest.
Funding Information
This work was supported by the National Key Research and Development Program of China (Grant No. 2022YFC2406505) and the National Key Research and Development Program of China (Grant No. 2019YFF0216502).
Supplementary Material
Supplementary Figure S1
Supplementary Figure S2
Supplementary Figure S3
References
Supplementary Material
Please find the following supplemental material available below.
For Open Access articles published under a Creative Commons License, all supplemental material carries the same license as the article it is associated with.
For non-Open Access articles published, all supplemental material carries a non-exclusive license, and permission requests for re-use of supplemental material or any part of supplemental material shall be sent directly to the copyright owner as specified in the copyright notice associated with the article.