
Abstract
Background:
Continuous glucose monitors (CGM) are increasingly being used to manage diabetes. We evaluated the performance and safety of an investigational 15-day G7 integrated CGM (iCGM; Dexcom) in adults with diabetes.
Methods:
This prospective, multicenter study enrolled adults (age ≥18 years) with type 1 diabetes (T1D) or type 2 diabetes (T2D) at six clinical sites in the United States. Four in-clinic visits were conducted on days 1–3, 4–7, 9–12, and 13–15.5, with frequent arterialized venous blood draws for comparator measurements using a Yellow Springs Instrument (YSI) 2300 Stat Plus glucose analyzer. Participants with T1D or T2D using intensive insulin therapy participated in clinic sessions with deliberate, closely monitored glucose manipulations. Accuracy evaluations included the mean absolute relative difference (MARD), proportion of CGM values within 15 mg/dL of YSI values <70 mg/dL or within 15% of YSI values ≥70 mg/dL (%15/15), as well as %20/20, %30/30, and %40/40 agreement rates. Performance related to iCGM special controls, user experience, and device safety were also assessed.
Results:
The study enrolled 130 adults with diabetes (mean ± standard deviation age 43.0 ± 14.4 years, 53.1% female, 86.9% with T1D) and analyzed 20,310 CGM-YSI matched pairs from 130 15-day G7 CGM devices. The overall MARD was 8.0% and the %15/15, %20/20, %30/30, and %40/40 agreement rates were 87.7%, 94.2%, 98.9%, and 99.8%, respectively. The device exceeded iCGM performance goals, and user experiences were broadly positive. No serious adverse events were reported.
Conclusions:
The 15-day G7 iCGM was accurate and safe in adults with diabetes throughout the 15.5-day wear period.
Clinicaltrials.gov:
NCT05263258.
Introduction
Diabetes mellitus, characterized by elevated glucose levels, imposes substantial health and economic burdens. 1 In the United States, over 125 million people had diabetes or prediabetes in 2021. 2 To achieve glycemic targets and reduce the risk of long-term complications, 3,4 people with diabetes or at risk for diabetes are encouraged to take an active role in their glucose management and their health. 4 –6
Recent innovations in glucose monitoring technologies have led to the development of continuous glucose monitors (CGM). Unlike traditional blood glucose monitoring, which provides only a single point-in-time glucose value, CGM provides a continuous stream (every 1–5 min) of glucose data to users’ handheld receiver or smartphone app. The glucose data are displayed in numerical and graphical format, indicating the current level, recent trends, as well as trend arrows indicating the rate of change of glucose values. As a safeguard, all current CGM systems feature programmable alerts to help users reduce or avoid their time spent with hyperglycemia or hypoglycemia. The clinical benefits of CGM use among people with type 1 diabetes (T1D) or type 2 diabetes (T2D) with respect to hypoglycemia avoidance, A1c reduction, and improved time in range have been widely demonstrated. 7 –12
For a CGM to be approved as an integrated CGM (iCGM), it must meet or exceed the U.S. Food and Drug Administration’s (FDA) special control metrics outlined in 21 CFR 862.1355 Special Control (1)(v). Accuracy of the currently available 10-day G7 CGM (Dexcom, Inc., San Diego, CA, USA) was recently evaluated in adult 13 and pediatric 14 populations. The 15-day G7 CGM system extends sensor wear time and builds upon features present in the 10-day G7 CGM system, a 12-h grace period, and a 27-min warm-up time, which enables the use of CGM glucose data for insulin dosing as soon as warm-up is complete.
This multicenter study evaluated the overall sensor accuracy of the investigational 15-day G7 CGM system. Performance of sensors was evaluated across the 15.5-day wear period, including primary endpoints related to special controls for iCGMs. Device-related adverse events and user experience data were also analyzed.
Methods
Study design and participants
This prospective multicenter study was conducted at six sites in the United States. Demographic information is summarized in Table 1. The protocol and consent forms were approved by local and/or centralized institutional review boards. Informed written consent was obtained from study participants before study initiation. All participants had a screening visit where baseline laboratory tests were conducted and informed signed consent was obtained. Baseline hematocrit values were in the normal range and pregnancy tests where applicable were negative (as per inclusion/exclusion criteria). This study was conducted in accordance with the provisions in applicable regulations and guidelines, including Good Clinical Practice and the Declaration of Helsinki. The study was approved by the FDA through the Investigational Device Exemption process and registered at ClinicalTrials.gov (NCT05263258).
The point estimates achieved by the G7 CGM system for the arm wear location 13 were utilized for the sample size calculation for this study. Assuming a one-sided significance level of 0.05, study power of 80%, study attrition of 15%, and a one-sided z-test of a binomial proportion with a continuity adjustment, the required sample size was 129 participants.
Between January and August 2022, the study enrolled 130 adults (≥18 years of age) with T1D, T2D using intensive insulin therapy (IIT), or T2D on basal insulin therapy. Inclusion criteria included willingness to wear up to two 15-day G7 devices and to avoid injecting insulin or wearing an insulin pump infusion set within 3 inches of the CGM insertion site. Exclusion criteria included pregnancy, anemia, or any condition, per investigator’s discretion, that could place the participant at risk by glucose manipulations. There were no inclusion or exclusion criteria related to race, sex, body mass index (BMI), or current medications or supplements.
Study procedures
Forty participants wore a 15-day G7 sensor on the back of both upper arms, and 90 participants wore one 15-day G7 sensor on the back of one upper arm. The primary CGM (i.e., the CGM used for analyses) was the first-applied CGM. Both the study participants and staff were blinded to the CGM data, and the participants continued to use their own CGM/glucose meter device to manage diabetes during the study. All sensor insertions were asked to be performed at the clinic by participants. Participants applied the overlay patch (over patch) immediately after the sensor was successfully applied.
Participants were scheduled for four in-clinic sessions of up to 13 h each on one day in each of the following ranges: day 1–3 (hours 0 to <72), day 4–7 (hours 72 to <168), day 9–12 (hours 192 to <288), day 13–15.5 (hours 288 to <372). During the clinic session, arterialized venous blood was drawn from an intravenous catheter approximately every 10–15 min (±5 min), and glucose concentrations were obtained using a Yellow Springs Instrument (YSI) 2300 Stat Plus glucose analyzer (YSI, Inc., Yellow Springs, OH, USA). 13 While up to 50 samples of arterialized venous blood were drawn from each participant during in-clinic visits, blood draws did not exceed 3 mL/kg of body weight. Participants with T1D or T2D-IIT underwent glucose manipulations, during which deliberate but closely supervised (by the principal investigator) insulin and glucose challenges were performed to induce hyperglycemia and hypoglycemia to achieve glucose values between 40 and 400 mg/dL as per the protocol. All 15-day G7 investigational device data were blinded from the participants, and the providers used their YSI measurements data for inducing glucose manipulations by higher food intake or increasing the amount of insulin. Participants with T2D using basal insulin therapy attended clinic sessions, but intentional glucose manipulations were not performed. CGM removals were performed on day 15.5 ± a 48-h window for scheduling purposes. There were no calibrations performed on the research devices during the study. During the removal visit, insertion sites and adhesive areas were evaluated by study staff and participants were surveyed about their CGM use history and the 15-day G7’s ease of use during the study.
Data analysis
To obtain CGM-measured glucose data for analysis, raw sensor signals were collected during the study and post-processed using a proprietary algorithm. Blood glucose samples measured using the YSI were matched with the first CGM value in the 5 min immediately after the YSI measurement. Only matched pairs with CGM values in the 40–400 mg/dL reportable range were included in the performance analyses.
To determine whether the 15-day G7 system met the special controls required for iCGM systems, the following seven primary endpoints were analyzed: (1) proportion of dichotomized status of CGM reading in comparison to YSI within 20% to be >87%; (2) for CGM readings <70 mg/dL, proportion of dichotomized status of CGM reading in comparison to YSI within 15 mg/dL to be >85%; (3) for CGM readings <70 mg/dL, proportion of dichotomized status of CGM reading in comparison to YSI within 40 mg/dL to be >98%; (4) for CGM readings 70–180 mg/dL, proportion of dichotomized status of CGM reading in comparison to YSI within 15% to be >70%; (5) for CGM readings 70–180 mg/dL, proportion of dichotomized status of CGM reading in comparison to YSI within 40% to be >99%; (6) for CGM readings >180 mg/dL, proportion of dichotomized status of CGM reading in comparison to YSI within 15% to be >80%; and (7) for CGM readings >180 mg/dL, proportion of dichotomized status of CGM readings in comparison to YSI within 40% to be >99%. Each primary endpoint was tested at a one-sided significance level of 0.05. Point estimates and lower bound from the one-sided 95% confidence interval (CI) for each of the seven primary endpoints were derived from the generalized estimating equations (GEE) method.
For analysis of accuracy across CGM glucose ranges, the absolute difference from the YSI glucose measurement was calculated for CGM readings <70 mg/dL. For CGM readings ≥70 mg/dL, the absolute relative difference (ARD) of the CGM reading compared with the YSI glucose reading was calculated. Sensor heterogeneity was assessed by analyzing each sensor’s mean ARD (MARD) and by determining the proportion of sensors having >80% of their values within ±20 mg/dL of YSI values <70 mg/dL or within 20% of YSI values ≥70 mg/dL (hereafter referred to as %20/20). The related accuracy metrics %15/15, %30/30, and %40/40 were calculated similarly. To align with the International Organization of Standardization guidelines, %15/15, %20/20, %30/30, and %40/40 were also calculated with 100 mg/dL as the dividing glucose concentration (i.e., for %15/15: the proportion of CGM values within ±15 mg/dL of YSI values <100 mg/dL or within 15% of YSI values ≥100 mg/dL). These alternative metrics are presented in Tables 2–8. Performance was assessed across glucose concentration ranges and days of sensor wear. For analysis of accuracy at various CGM rates of glucose concentration change, rate of change (RoC) was calculated as the difference between consecutive glucose values per unit of time (units of milligrams per deciliter per minute). MARD and %20/20 were calculated for the following RoC ranges: <−2, −2 to <−1, −1 to <0, 0 to 1, >1 to 2, and >2. Clinical accuracy was characterized by consensus error grid (CEG) analysis. 15
Baseline Demographic Characteristics
BMI, body mass index; T2D-BIT, type 2 diabetes using basal insulin therapy; T2D-IIT, type 2 diabetes using intensive insulin therapy; SD, standard deviation.
Primary Endpoints of the Special Control Metrics and 15-Day G7 Performance
AD, absolute difference; ARD, absolute relative difference; CGM, continuous glucose monitor; LB, lower bound.
Detection of hypoglycemia and hyperglycemia, recognition of true alert or detection rates, and performance of the Urgent Low Soon alerts were calculated as previously described. 13 Briefly, the true alert rate quantifies the proportion of hypoglycemia or hyperglycemia alerts corroborated by a YSI value at or below (hypoglycemia alert) or at or above (hyperglycemia alert) the threshold setting within ±15 min of the alert. The true detection rate quantifies the proportion of hypoglycemia or hyperglycemia events (defined by the YSI measurement) that were associated with a CGM alert within ±15 min of the event. Urgent Low Soon alert will occur if a user’s glucose level is predicted to fall ≤55 mg/dL within 20 min.
Heterogeneity of accuracy across participant subgroups was analyzed using a GEE model to adjust for intrasubject correlation with a significance level of 0.15. Device safety was assessed by evaluation of all device-related adverse events. Ease of use and satisfaction with CGM use were evaluated via survey questions assessed at insertion and removal. All analyses were performed using SAS software, version 9.4 (SAS Institute, Inc., Cary, NC, USA).
Results
Study population
A total of 130 individuals were enrolled in the study (Table 1). Most participants were female (53.1%), had T1D (86.9%), and were overweight or obese (67.7%). Seven of the 130 participants did not complete all study requirements; 3 missed ≥1 clinic visit, 2 withdrew from the study, and 2 were not able to complete the study because both sensors (one primary and one backup) fell off the body before completion of clinic sessions. The analysis population included all participants with ≥1 CGM-YSI matched pair, which included all 130 participants. From these 130 participants, there were 20,441 valid CGM-YSI matched pairs. After excluding 131 matched pairs that were outside of the CGM’s reportable range of 40–400 mg/dL, there were 20,310 matched pairs used for accuracy analyses.
Accuracy metrics and iCGM performance
The overall MARD for the 15-day G7 CGM system was 8.0%. The overall %15/15, %20/20, %30/30, and %40/40 agreement rates were 87.7%, 94.2%, 98.9%, and 99.8%, respectively. The results for the consensus error grid of CGM versus YSI are presented in Figure 1. Overall, 99.9% of sensor readings are in zones A and B of the CEG.
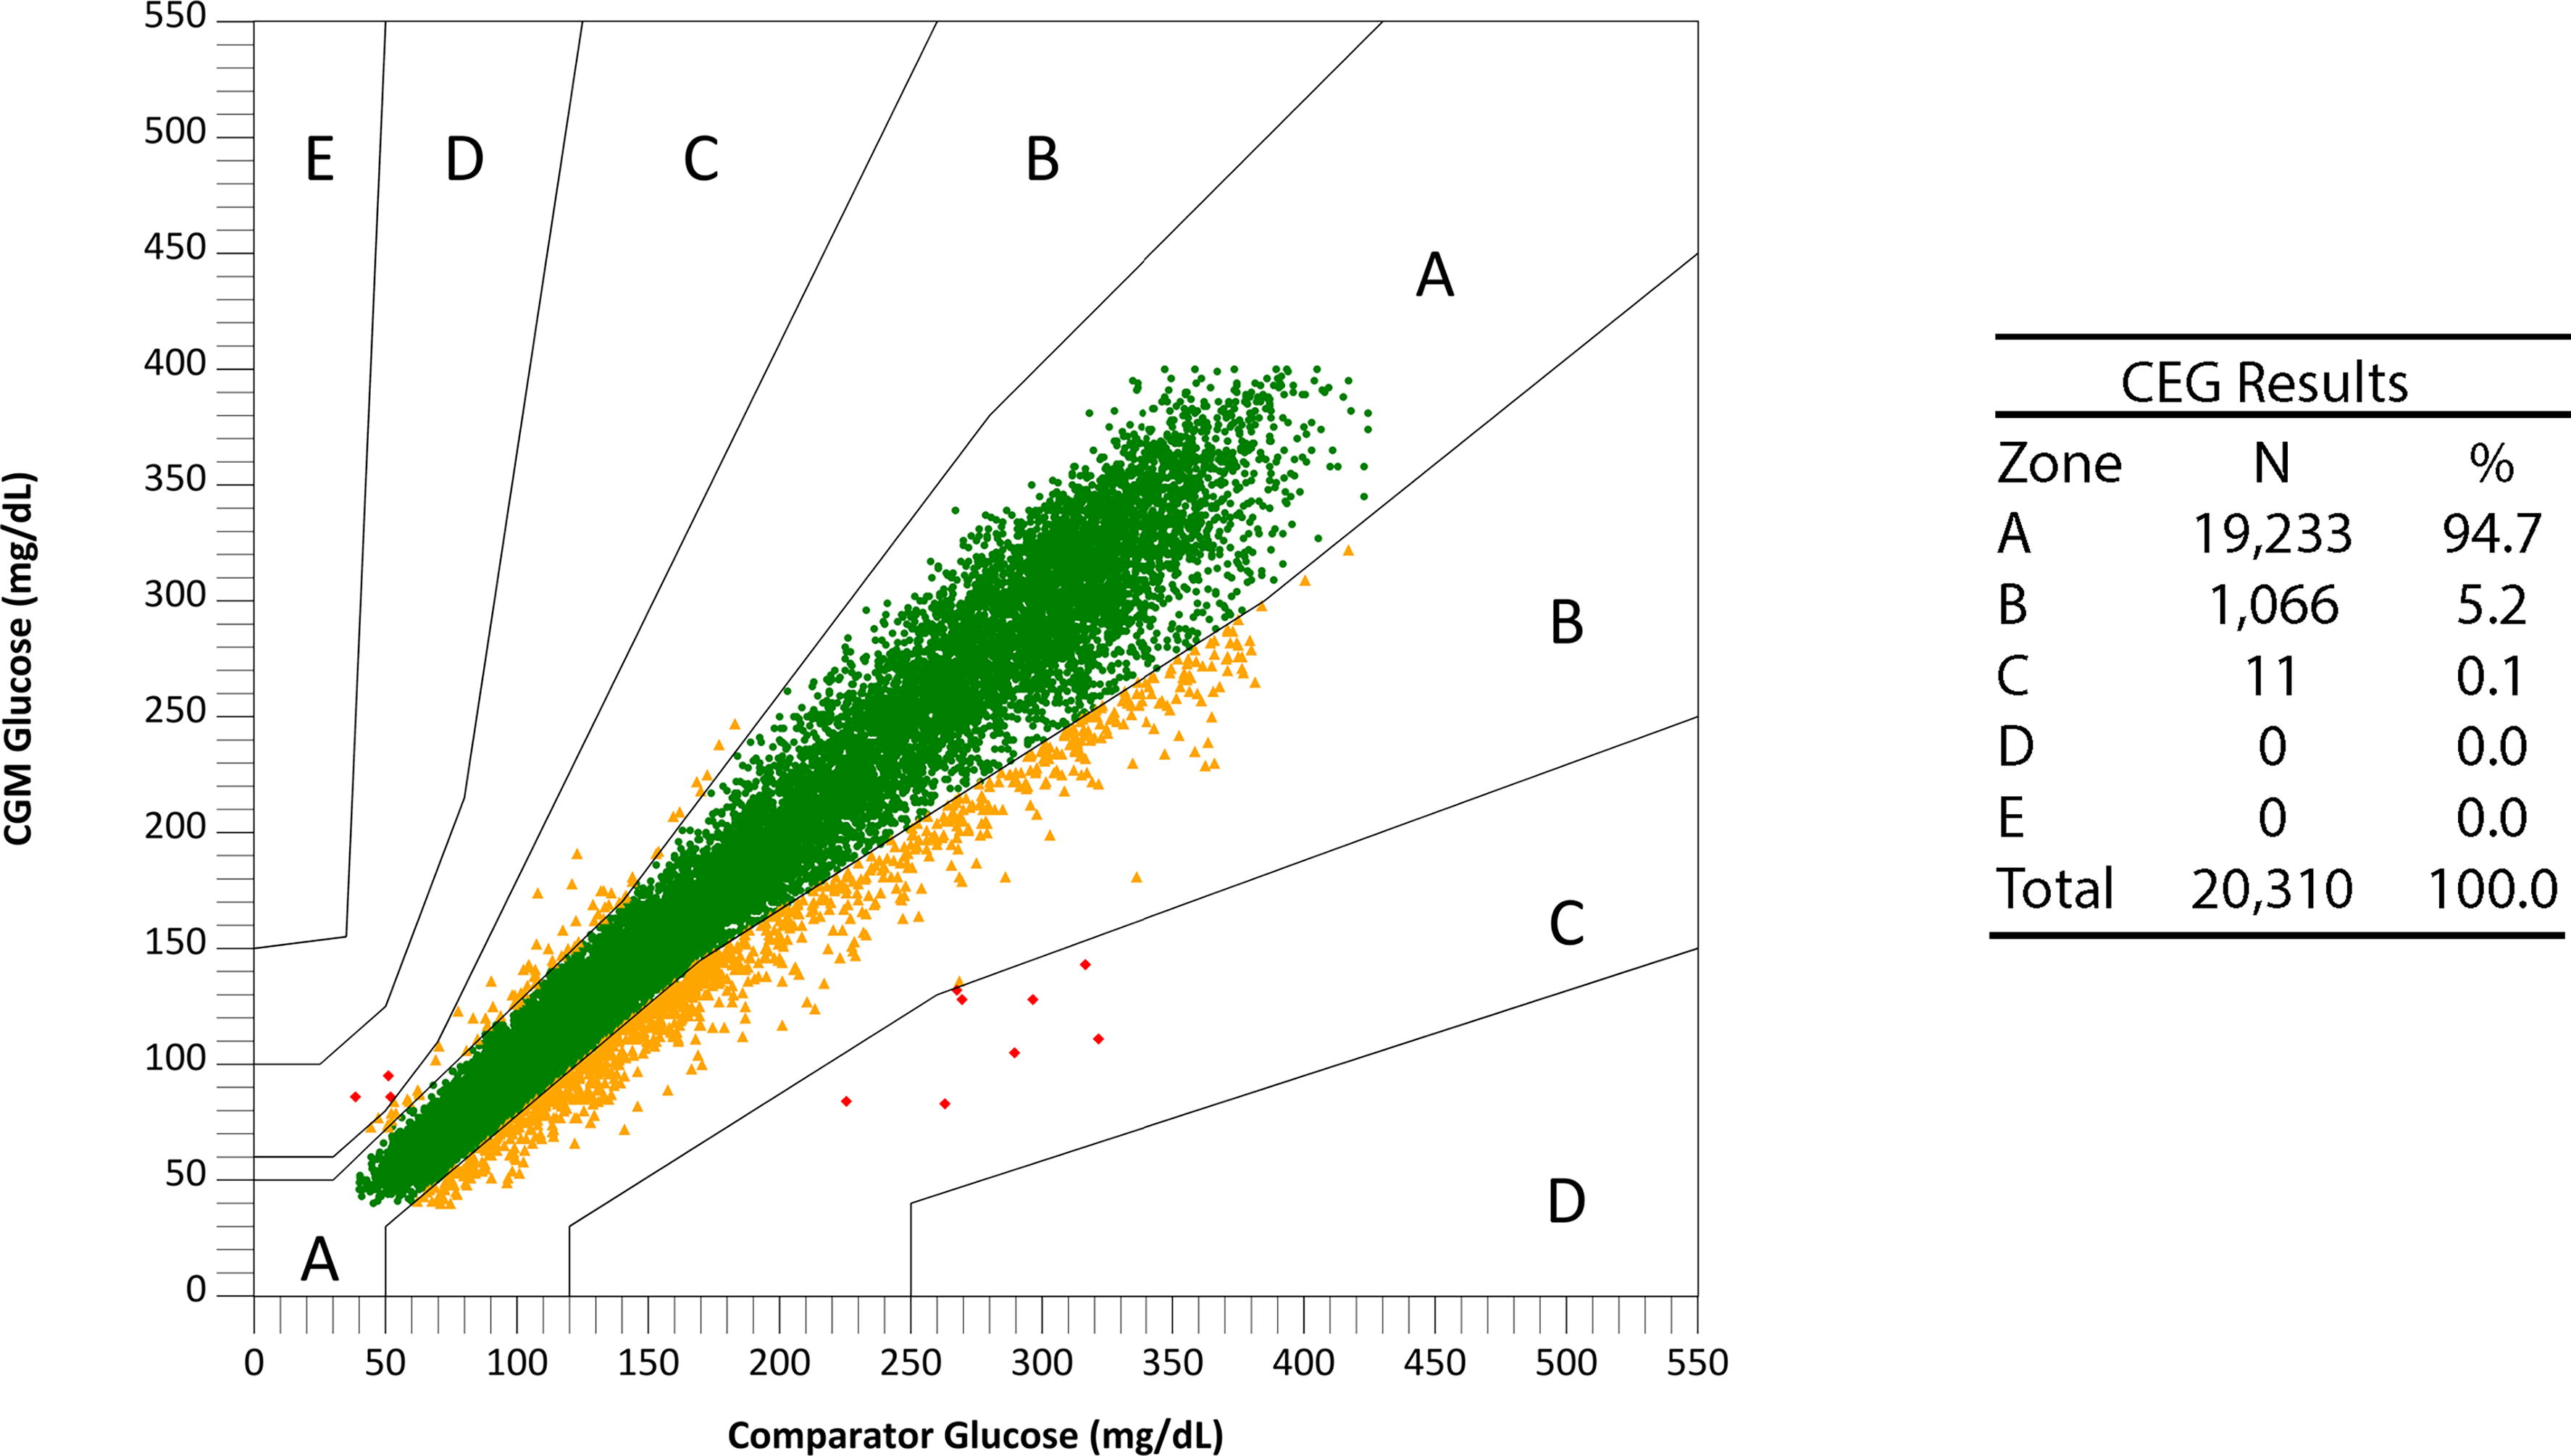
Consensus error grid (CEG) analysis plot for CGM versus YSI comparator glucose values. CGM, continuous glucose monitors; YSI, Yellow Springs Instrument.
Primary endpoints and performance goals for special control metrics (i.e., iCGM metrics) are summarized in Table 2 alongside the endpoints achieved in this study. The 15-day G7 CGM system exceeded all performance goals and met iCGM criteria.
Individual sensor performance is summarized in Figure 2. Among the 130 individual sensors, 122 (93.8%) had >80% of CGM-YSI matched pairs that met %20/20 accuracy.
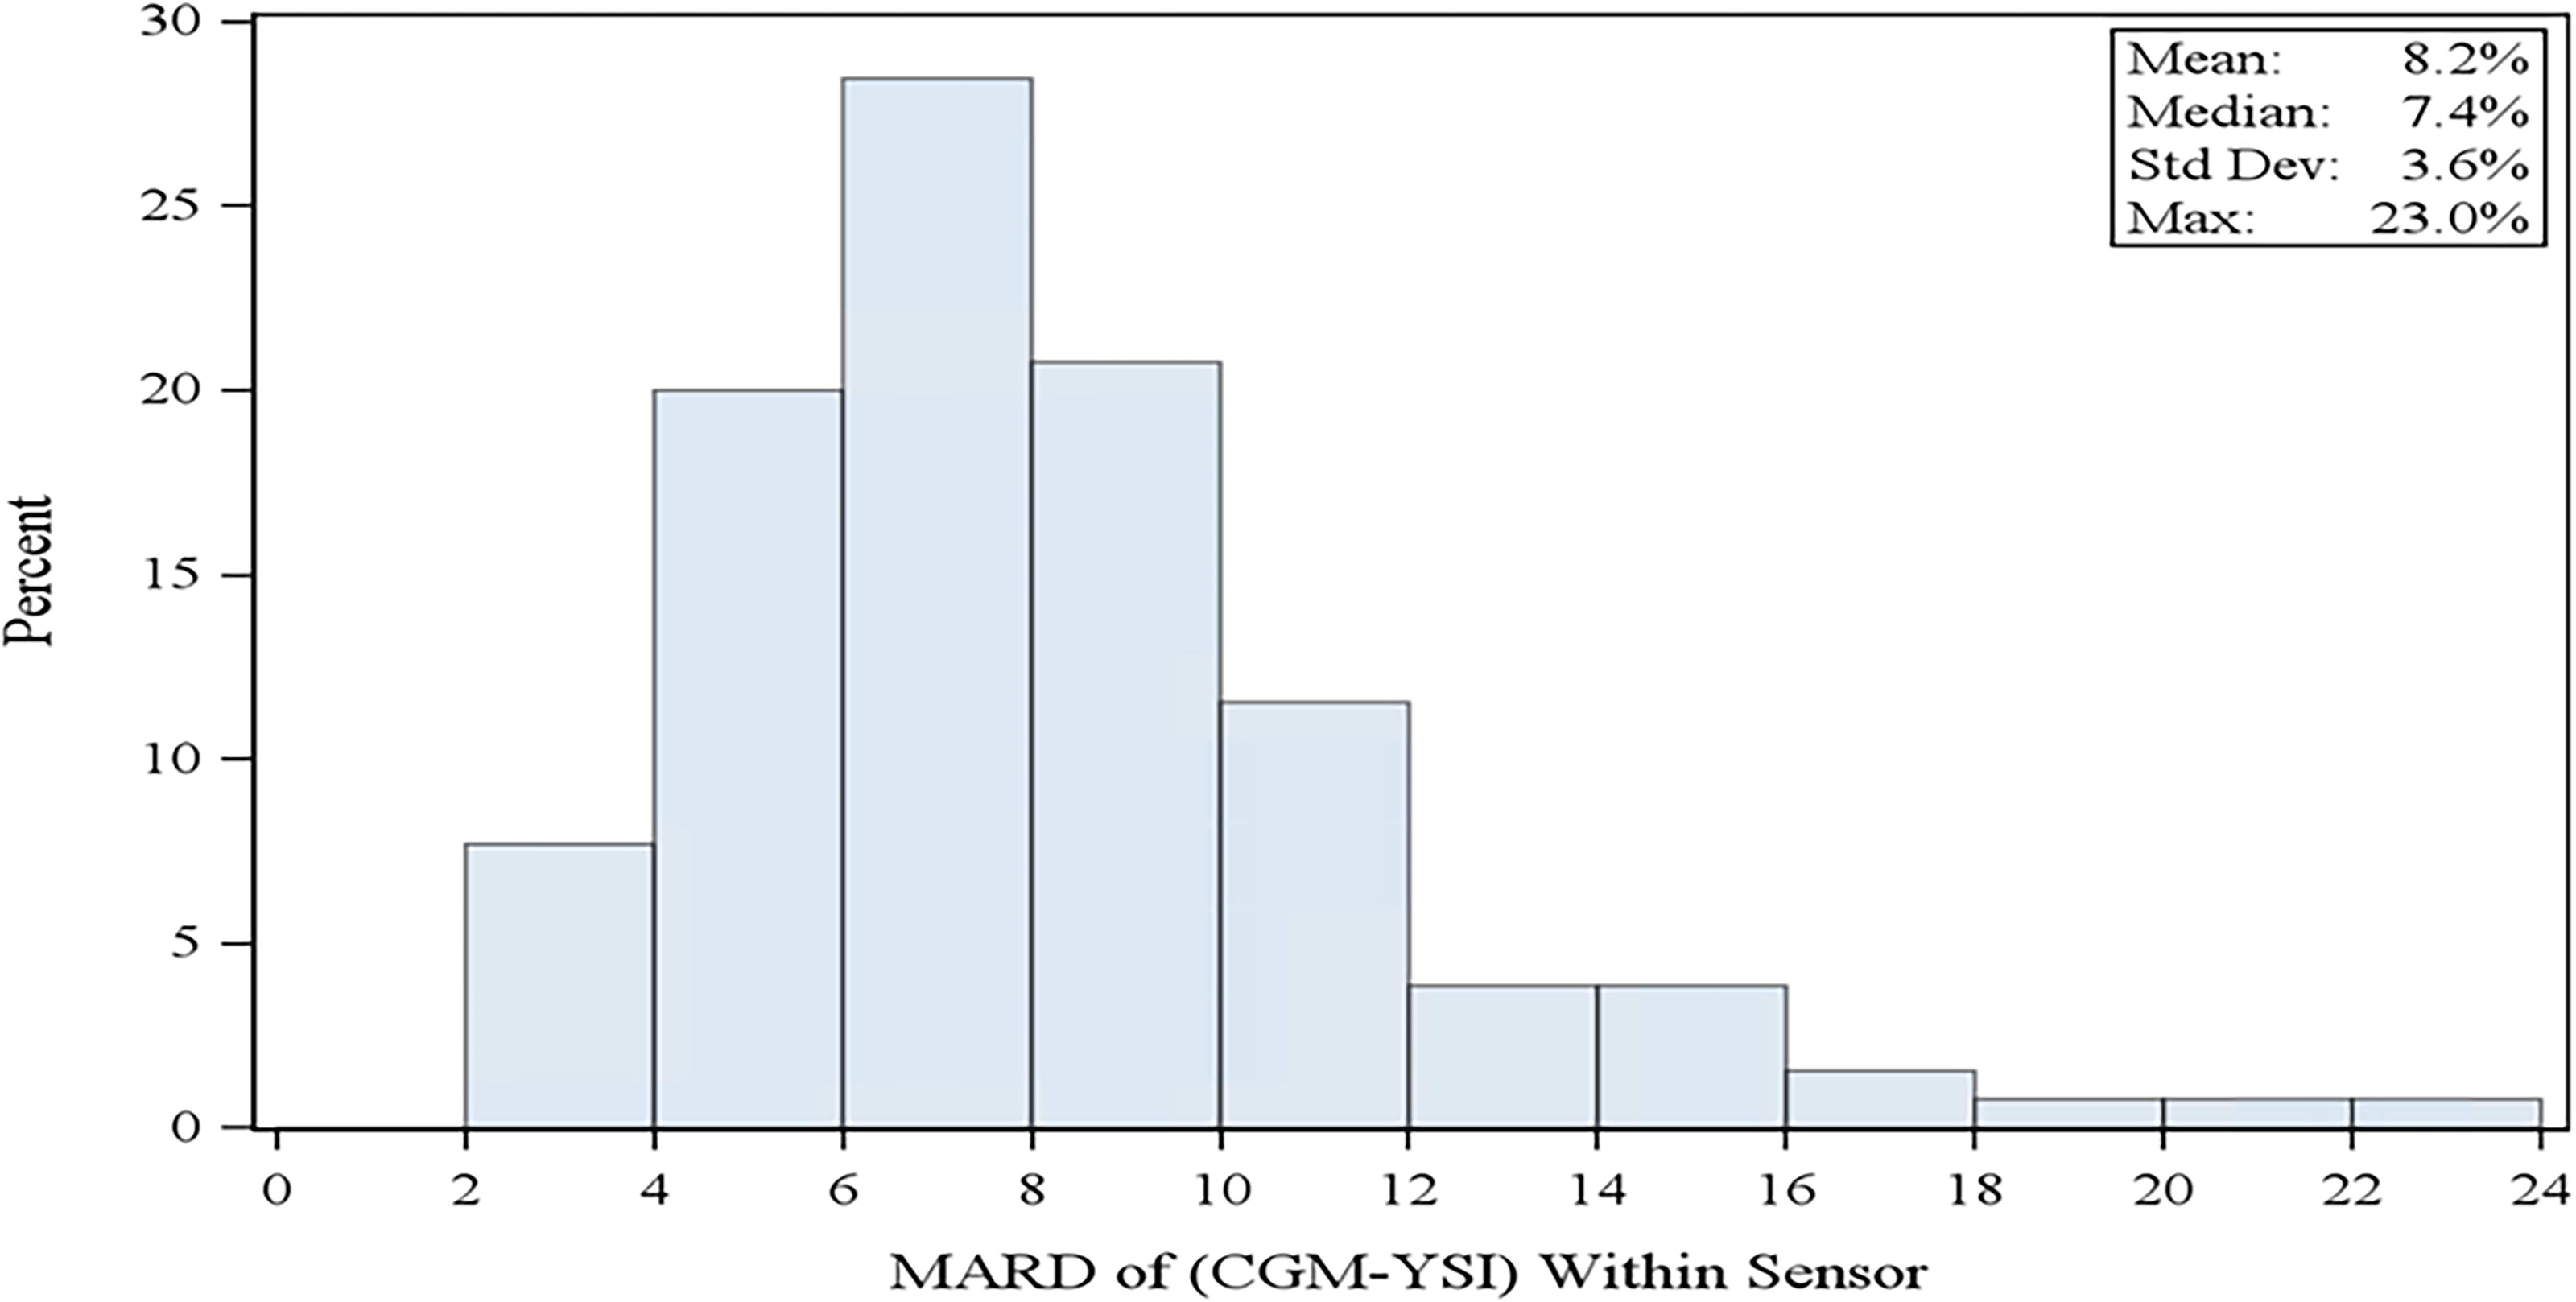
Histogram of all primary sensor MARD values (n = 130 sensors). MARD, mean absolute relative difference.
Accuracy across wear periods, glucose ranges, and participant characteristics
Accuracy across four wear periods throughout the 15.5-day sensor lifetime is summarized in Table 3 and Table 4. Sensor accuracy across the 70–180 mg/dL glycemic range and deliberately induced hypoglycemic and hyperglycemic ranges is summarized in Table 5 and Table 6. Accuracy remained high throughout the sensor life and across glucose ranges. In addition, after the 27-min warm-up, the %20/20 accuracy over the first 12 h and 24 h of wear was 83.4% and 89.4%, respectively.
Sensor Accuracy Across Wear Periods
%XX/XX: proportion of values within ±XX% for YSI values ≥70 mg/dL or within XX mg/dL for YSI values <70 mg/dL.
MAD, mean absolute difference; MARD, mean absolute relative difference; YSI, Yellow Springs Instrument.
Sensor Accuracy Across Wear Periods (100 mg/dL)
%XX/XX: proportion of CGM values within ±XX% for YSI values ≥100 mg/dL or within ±XX mg/dL for YSI values <100 mg/dL.
Sensor Accuracy Across CGM Glucose Ranges
%XX/XX: proportion of CGM values within ±XX% for YSI values ≥70 mg/dL or within ±XX mg/dL for YSI values <70 mg/dL.
Sensor Accuracy Across CGM Glucose Ranges (100 mg/dL)
%XX/XX: proportion of CGM values within ±XX% for YSI values ≥100 mg/dL or within ±XX mg/dL for YSI values <100 mg/dL.
There were no statistically significant differences in accuracy between participant subgroups, including sex, age, diabetes type, baseline A1c, BMI category, or study site.
Accuracy at various rates of glucose concentration change
Sensor accuracy was assessed over six different categories of rates of glucose concentration change (Table 7 and Table 8). Accuracy was highest (i.e., lowest MARDs and highest %20/20 agreement rates) when glucose concentrations were changing by <1 mg/(dL·min). When the glucose RoC was <−2 mg/(dL·min) (n = 269 matched pairs), the %20/20 agreement rate was 85.9%, and when glucose RoC was >2 mg/(dL·min) (n = 767), the %20/20 agreement rate was 92.4%.
Accuracy Across Various Rates of Change
%20/20: proportion of CGM values within ±20% for YSI values ≥70 mg/dL or within ±20 mg/dL for YSI values <70 mg/dL.
Accuracy Across Various Rates of Change (100 mg/dL)
%20/20: proportion of CGM values within ±20% for YSI values ≥100 mg/dL or within ±20 mg/dL for YSI values <100 mg/dL.
Threshold and Urgent Low Soon alert performance
The true alert rate estimates the probability of the user experiencing an event (defined by the YSI measurement based on the alert setting) within ±15 min of the CGM alert. Of the 5019 alerts arising when the hypoglycemia alert threshold was set to 70 mg/dL, 82.0% were true alerts, indicating the CGM value ≤70 mg/dL was corroborated by a YSI value ≤70 mg/dL within ±15 min. Of the 12,496 alerts arising when the hyperglycemia alert threshold was set to 240 mg/dL, 95.4% were true alerts, indicating the CGM value ≥240 mg/dL was corroborated by a YSI value ≥240 mg/dL within ±15 min.
The true detection rate estimates the probability that the CGM provides an alert within ±15 min of the user experiencing an event (defined by the YSI measurement). Of the 2125 events occurring when the hypoglycemia alert threshold was set to 70 mg/dL, 92.2% of the hypoglycemia events were true detections, defined as a YSI value ≤70 mg/dL corroborated by a CGM value ≤70 mg/dL. Of the 5390 hyperglycemia events occurring when the hyperglycemia alert threshold was set to 240 mg/dL, 94.3% were true detections, defined as a YSI value ≥240 mg/dL corroborated by a CGM value ≥240 mg/dL.
An additional analysis was performed to determine how often level 1 hypoglycemia (YSI glucose ≤70 mg/dL) was detected with the hypoglycemia alert threshold set to 55 mg/dL. Of the 1218 alerts arising when the hypoglycemia alert threshold was set to 55 mg/dL, 89.2% were associated with a YSI measurement ≤70 mg/dL within ±15 min.
Of the seven unique Urgent Low Soon alerts occurring during the in-clinic sessions, six (85.7%) were followed by a YSI value ≤70 mg/dL within 30 min.
Adverse events and user experience
There were no serious adverse events related to the study device among enrolled participants. Three participants (2.3%) reported four mild to moderate device-related adverse events. These included two reports of local infection (one moderate and one mild), one report of mild skin irritation (edema, erythema, and medical adhesive-related skin irritation), and one report of moderate pain or discomfort during sensor wear.
Users surveyed at insertion (Table 9) found the insertion process to be easy or very easy (126/128; 98.4%). Most participants (109/128; 85.2%) had used personal CGM systems in the past, with Dexcom G6 as the most frequently used CGM (76/109; 69.7%). Among those with a history of personal CGM use, most (100/109; 91.7%) answered at the time of removal that the 15-day G7 system was about the same or easier to use than their personal CGM system.
User Experience of CGM System at Insertion
Discussion
The investigational 15-day G7 iCGM was accurate and safe in adults with diabetes. Supervised glucose manipulations for hypoglycemic and hyperglycemic ranges and frequent blood glucose sampling confirmed accuracy in specific glucose ranges and during rapid rates of glucose concentration change. There were no safety concerns during the study.
The MARD of 8.0% for the 15-day G7 CGM is the lowest reported MARD in a study designed to meet the FDA’s iCGM criteria. 16 –19 The MARD of the 15-day G7 CGM system improves upon the MARD of the 10-day G7 CGM system (8.2%). 13 The per-sensor MARD of the 15-day G7 CGM (8.2%) also improves upon the per-sensor MARD of the 10-day G7 CGM (8.8%). 13 Importantly, the per-sensor MARD is an average of the MARDs from each primary sensor used in the study. The overall MARD considers all valid matched pairs between the YSI and primary CGM sensor. Both are useful measures of CGM accuracy. The sensor lifetime of 15.5 days is also the longest wear period among transcutaneous CGM devices.
iCGMs are designed to reliably and securely transmit glucose data to connected devices, including automated insulin delivery systems. In addition, FDA-cleared iCGMs allow for non-adjunctive use of the CGM, and because of their important role in diabetes management, they are subject to additional performance scrutiny. 20 The 15-day G7 iCGM described in this study employed rigorous performance testing among people with insulin-requiring diabetes (over 85% of whom had T1D), generating a large dataset of over 20,000 YSI-CGM matched pairs. The sample was also powered to meet the lower bound of the 95% CIs of the iCGM performance metrics, and the 15-day G7 CGM exceeded all seven iCGM performance goals. This study did not evaluate the integrated aspect of the device regarding integration with insulin pumps.
The glucose data from CGM systems are increasingly being used by endocrinologists, primary care providers, and other health care providers to titrate medications such as insulin and noninsulin treatments such as glucagon-like peptide-1 receptor agonists. 21 –23 The 15.5-day sensor lifetime could enhance user adherence and provide longer-term data for medication management and therapy optimization. Consistent use of iCGM could also help users learn about their diabetes. Retrospective analysis of CGM data alongside notes entered into the app on meals, exercise, sleep, and stress could support behavior modification 24 and help users improve self-care practices. 25,26
Because the 15-day G7 CGM system maintains the features of earlier Dexcom CGM systems and improves upon their accuracy, favorable clinical outcomes found in studies using the G5, G6, or G7 CGM systems are anticipated for users of the 15-day G7 CGM system. The clinical outcomes include HbA1c reduction, time in range improvements, and hypoglycemia reduction. 7 –9,11,27 Individuals who transition from other CGM systems may also experience or maintain these glycemic benefits. 28
Strengths of this study included the large number of YSI-CGM matched pairs generated across multiple sites and the rigorous supervised in-clinic glucose manipulations that emulated real-world glycemic excursions. Limitations of this study include the all-adult population living in the United States, most of whom were using intensive insulin therapy.
Conclusions
We conclude that the Dexcom 15-day G7 CGM is accurate and safe for use up to 15.5 days in adults with diabetes. The high accuracy, longer sensor lifetime, and continued inclusion of all features present in the 10-day G7 CGM system, including the 27-min warm-up, could increase CGM adoption and adherence and reduce user barriers.
Footnotes
Acknowledgments
The authors thank the individuals who participated in the study and the research staff at the investigational sites. The authors also thank Dexcom employees Abdulrahman Jbaily and Qianqian Deng for their help with data analysis, Karen Elkind-Hirsch for her advice and initial drafting, and Courtney R. Green for her medical writing support. The investigational device used in this study was not cleared by the FDA at the time of article submission.
Authors’ Contributions
S.K.G.: Principal investigator (PI), conducting the study, and writing, reviewing, and editing the article. H.K.A.: Writing, reviewing and editing. T.S.B., K.C., M.P.C., D.R.L., and H.S.: Local site PIs and writing, reviewing and editing. S.G.: Formal analysis, methodology, validation, visualization, and writing—review and editing. M.L.J.: Conceptualization, methodology, supervision, and writing—review and editing. S.E.B.: Conceptualization, funding acquisition, methodology, supervision, and writing—review and editing.
Author Disclosure Statement
S.K.G. has served on advisory boards and received consulting fees from Medtronic, Eli Lilly, Abbott Diabetes Care, and Novo Nordisk. Through the University of Colorado, he has received research grants from Eli Lilly, Medtronic, Dario, Diasome, Lexicon, and Dexcom. H.K.A. reports research support and honorarium through the University of Colorado from Medtronic, Dexcom, Roche, and Tandem Diabetes Care. K.C. receives research support provided to her institution from Dexcom, Abbott, Medtronic, Eli Lilly, MannKind, and Insulet and receives consulting fees from Dexcom, MannKind, and Insulet. T.S.B.: Research Support: Abbott Rapid Diagnostics, Biolinq, Corcept, Dexcom, Eli Lilly, Medtronic, Medtrum, Novo Nordisk, Senseonics, and vTv Therapeutics; Consulting Honoraria: Abbott Diabetes, Abbott Rapid Diagnostics, ACON, CeQur, HagarTech, i-sense, Eye Sense, Mannkind, Medtronic, Novo, Perspirion, Sanofi, Sequel Med Tech, and Ypsomed; Speaking Honoraria: None. M.P.C.: Research funding from Amgen, AstraZeneca, biolinq, Dexcom, Lilly, Medtronic, Novo Nordisk, Merck, Pfizer, Senseonics, Luna Health, Abbott POC, Roche, SanVita, and SinoCare. D.R.L. and H.S. received research funding from Dexcom for this study. S.G., M.L.J., and S.E.B. are employees of Dexcom, Inc.
Funding Information
This study was sponsored by Dexcom, Inc.