
Abstract
Background:
ONWARDS 9 explored, for the first time, the effect of continuous glucose monitoring (CGM)-based titration of once-weekly insulin icodec (icodec) on glycemic control and safety outcomes in individuals with type 2 diabetes (T2D).
Methods:
In this 26-week, multicenter, single-arm, treat-to-target, phase 3b trial, insulin-naive adults with T2D (glycated hemoglobin [HbA1c] 7.0%–11.0%) initiated icodec at a starting dose of 70 U/week. Participants were provided with an intermittently scanned CGM device, and icodec doses were titrated weekly based on pre-breakfast CGM values (target: 80–130 mg/dL). The primary endpoint was change in HbA1c from week 0 to week 26. Exploratory endpoints included the percentage of time in range (TIR; 70–180 mg/dL), time above range (TAR; >180 mg/dL), and time below range (TBR; <54 mg/dL) from week 22 to week 26. Safety outcomes, including the number of hypoglycemia episodes, were assessed.
Results:
Of 58 participants screened, 51 received icodec treatment. HbA1c decreased from an observed mean of 8.18% at week 0 to an estimated mean of 7.00% at week 26. There was a statistically significant reduction in HbA1c of −1.17%-points (95% confidence interval: −1.36; −0.99, P < 0.0001). From week −2 to 0 to week 22–26, a concomitant clinically meaningful increase in TIR (54.4% to 76.4%) and decrease in TAR (45.2% to 22.9%) was observed; TBR remained low throughout the trial (week −2 to 0: 0.03%; week 22–26: 0.04%). No severe hypoglycemic episodes were reported during the trial, and no new safety concerns for icodec were identified.
Conclusion:
After 26 weeks of treatment with icodec titrated based on CGM data, there was a statistically significant reduction in HbA1c from baseline, and the internationally recommended CGM targets for TIR, TAR >180 mg/dL, and TBR <54 mg/dL were achieved. These findings suggest that CGM-based titration of icodec is a feasible method for initiating insulin therapy in T2D.
Trial registration:
ClinicalTrials.gov identifiers: NCT05823948.
Introduction
Type 2 diabetes (T2D) is a progressive condition, in many cases requiring treatment with basal insulin to maintain glycemic control. 1 Traditionally, individuals living with T2D use self-measured blood glucose (SMBG) data to inform insulin dose adjustments. However, continuous glucose monitoring (CGM) provides real-time interstitial glucose measurements 2 and offers many benefits compared with SMBG and is now recommended by the American Diabetes Association and the European Association for the Study of Diabetes for all individuals with diabetes receiving insulin therapy to assist them with achieving glycemic targets. 3 –6
CGM allows individuals to easily track their glycemic control, without the need for repeated finger pricking and manual recording of measurements, and provides comprehensive information to both the individuals living with T2D and their clinicians to inform treatment adjustments/decisions. 7,8 In addition, CGM can help individuals to better understand the impact their diet, lifestyle, and treatment have on achieving glycemic control and minimizing hypoglycemia. 3 Given these advantages, together with the guideline recommendations for use, understanding the utility of CGM for titrating novel insulin formulations is of great interest.
Insulin icodec (icodec) is a basal insulin analog suitable for once-weekly administration. 9 A global, phase 3a clinical development program (ONWARDS 1–6) has demonstrated the efficacy and safety of icodec across a range of populations, trial designs, and comparator treatments. 10 –16 CGM sensors were worn by participants during prespecified periods in three of the ONWARDS trials in T2D (ONWARDS 1, 2, and 4). The CGM data in these trials were blinded to both participants and physicians; therefore, icodec dose titration was based on pre-breakfast SMBG measurements. 10 –12,14
CGM-based titration, combined with the use of a once-weekly basal insulin such as icodec, could improve the convenience and reduce the treatment burden of basal insulin therapy for individuals with T2D by combining fewer insulin injections with a reduction in the number of finger pricks needed for manual SMBG testing. Here, we describe the results of the ONWARDS 9 trial, which explored the effect on glycemic control and safety outcomes of CGM-based titration of once-weekly icodec in combination with non-insulin glucose-lowering medications in insulin-naive individuals with T2D. To our knowledge, this is the first trial to evaluate CGM-based titration of a once-weekly insulin in T2D.
Materials and Methods
Study design and participants
ONWARDS 9 was a 26-week, multicenter, single-arm, treat-to-target, phase 3b trial conducted between April 11, 2023, and March 6, 2024, at nine sites in the United States. The overall trial duration was 35 weeks, which comprised a 2-week screening period, a 2-week run-in period with open CGM before initiating icodec to ensure participants were familiar with the CGM device, a 26-week treatment period with icodec and open CGM, and a 5-week follow-up period with open CGM and standard of care. The trial design is presented in Supplementary Figure S1.
Eligible participants were insulin-naive adults (aged ≥18 years) with a diagnosis of T2D who had a glycated hemoglobin (HbA1c) level in the range 7.0%–11.0% (53.0–96.7 mmol/mol) and a body mass index of ≤40.0 kg/m2 at screening. Full inclusion and exclusion criteria are presented in Supplementary Table S1.
Stable daily doses of certain non-insulin glucose-lowering medications or combination regimens were allowed (details are included in Supplementary Table S1), although treatment with sulfonylureas (SU) and glinides was discontinued at the initiation visit (week 0).
Study treatment
Participants administered icodec (700 U/mL; Novo Nordisk A/S) by subcutaneous injection using a provided pre-filled pen injector (PDS290); the starting dose was 70 U/week (Supplementary Table S2). Doses were adjusted weekly based on three pre-breakfast CGM values, recorded on the 2 days before titration and on the day of titration, to achieve a fasting sensor glucose target of 80–130 mg/dL (4.4–7.2 mmol/L). All available information, including CGM-based metrics and ambulatory glucose profiles, was to be considered alongside the titration guidelines when adjusting the icodec dose. Investigators could deviate from the dosage adjustment recommended by the titration algorithm if it was deemed in the best interest of the participant.
Antibody samples were not collected systematically for all participants. Anti-insulin icodec antibodies were only to be assessed in case of suspicion of systemic hypersensitivity reactions, in parallel with additional immunological analyses. No such events occurred during the course of this trial.
Participants were provided with an intermittently scanned CGM device (FreeStyle Libre 2 sensor), with the FreeStyle Libre 2 mobile app on a provisioned trial phone, a blood glucose meter to measure blood glucose measurements, and a paper diary to record SMBG-based hypoglycemia.
Participants were instructed to scan their CGM sensor at least four times a day (before breakfast, before lunch, before dinner, and before bedtime) from screening (week −2) until the end of the trial (week 31). For assurance of safety, it was recommended that participants take blood glucose measurements if they experienced any symptoms of hypoglycemia and during the first 12 h of wearing the provided CGM device. Training in the directions for use of the CGM device and/or blood glucose meter or the manufacturer’s user guide was given to participants verbally and in writing, and it was repeated if needed to ensure correct use of the trial interventions.
Outcomes
The primary endpoint was the change in HbA1c from week 0 to week 26. Exploratory endpoints included the percentage of time in range (TIR; 70–180 mg/dL [3.9–10.0 mmol/L]), percentage of time above range (TAR; >180 mg/dL [>10.0 mmol/L]), and percentage of time below range (TBR; <54 mg/dL [<3.0 mmol/L]) from week 22 to week 26 and the achievement of HbA1c <7.0% at week 26. Baseline HbA1c was measured at week 0, whereas baseline CGM measurements were taken at week −2 to 0. Both time points will be referred to as “baseline” throughout the article.
Additional endpoints included the number of severe hypoglycemic episodes from week 0 to week 26, the number of combined clinically significant or severe hypoglycemic episodes from week 0 to week 26, and the mean weekly insulin dose from week 24 to week 26.
Additional assessments
Prespecified analyses included the achievement of HbA1c <7.0% without clinically significant hypoglycemia (blood glucose level <54 mg/dL [<3.0 mmol/L], confirmed by blood glucose meter) or severe hypoglycemia (hypoglycemia associated with severe cognitive impairment requiring external assistance for recovery) in the previous 12 weeks, the number of severe hypoglycemic episodes from week 0 to week 31, and the number of combined clinically significant or severe hypoglycemic episodes from week 0 to week 31. Additionally, the number of adverse events was recorded from baseline to week 31.
Additional post hoc exploratory analyses were the achievement of HbA1c <8.0% at week 26, the estimated treatment change in TIR, the observed CGM-based metrics for 7 days following the icodec injection, the ambulatory glucose profile, the mean glycemic variability (coefficient of variation percent [CV%]), the achievement of glycemic variability (CV% ≤36%) and composite assessment (>70% TIR and <4% TBR <70 mg/dL [<3.9 mmol/L] or >70% TIR and <1% TBR <54 mg/dL [<3.0 mmol/L]) targets at the start (week −2 to 0) and end (week 22–26) of treatment, and the observed CGM-based metrics across 2- or 4-week periods (week −2 to 26). A subgroup analysis of those treated with SU at baseline was also performed, and the percentages of TIR and TAR by week from week 0 to week 26 were summarized.
Trial oversight
The trial was conducted in accordance with the principles of the Declaration of Helsinki and in accordance with Good Clinical Practice Guidelines of the International Council for Harmonisation. The trial protocol and informed consent forms were reviewed and approved by an independent ethics committee or institutional review board before the trial was initiated. Participant informed consent was obtained before any trial-related activity.
Statistical analysis
Based on previous icodec trials, which used the same titration algorithm (albeit based on SMBG measurements rather than CGM measurements), the standard deviation (SD) of change in HbA1c from baseline of the present trial was expected to be 0.8%-points. With 50 participants contributing to the analysis and an SD of 0.8, the width of the 95% confidence interval (CI) for change in HbA1c from baseline that could be obtained with at least 80% probability was 0.5%-points. A precision of 0.5%-points was considered sufficient for this trial; hence, a sample size of 50 participants was chosen.
Efficacy endpoints were analyzed using the full analysis set (all participants assigned to icodec), whereas safety endpoints were analyzed using the safety analysis set (all participants assigned to icodec who received at least one dose of trial treatment).
The primary endpoint and post hoc assessment of change in TIR from baseline to the last 4 weeks of treatment (week 22–26) were analyzed using a mixed model for repeated measurements with an unstructured covariance matrix. The model included visit as a fixed factor and baseline HbA1c or TIR as a covariate. Interactions between visit and baseline HbA1c or TIR were also included in the model. All available recorded CGM data were included in the analysis. All other endpoints were summarized descriptively.
All statistical analyses were conducted using SAS version 8.4. Tests were two-sided with a significance level set to 5%.
Results
Participants
Of 58 participants screened, 51 received treatment. Fifty participants (98.0%) completed the week 26 visit while still receiving icodec; one participant (2.0%) was lost to follow-up. At baseline, participant mean age was 61.3 years, mean diabetes duration was 12.8 years, mean HbA1c level was 8.18%, and the mean body mass index was 31.4 kg/m2. In total, 31 participants (60.8%) were receiving treatment with SU at baseline; no participants were receiving treatment with glinides. Participant demographics and baseline characteristics are summarized in Table 1.
Participant Demographics and Baseline Characteristics
Arithmetic mean ± standard deviation.
Participants may have been receiving multiple non-insulin glucose-lowering medications at screening. SU/glinides were discontinued at baseline.
DPP-4i, dipeptidyl peptidase-4 inhibitors; GLP-1 RA, glucagon-like peptide-1 receptor agonists; HbA1c, glycated hemoglobin; SGLT2i, sodium-glucose co-transporter-2 inhibitors; SU, sulfonylureas.
Primary endpoint
HbA1c decreased from an observed mean of 8.18% at baseline to an estimated mean of 7.00% at week 26. There was a statistically significant reduction in HbA1c of −1.17%-points (95% CI: −1.36; −0.99, P < 0.0001) in participants receiving icodec (Fig. 1).
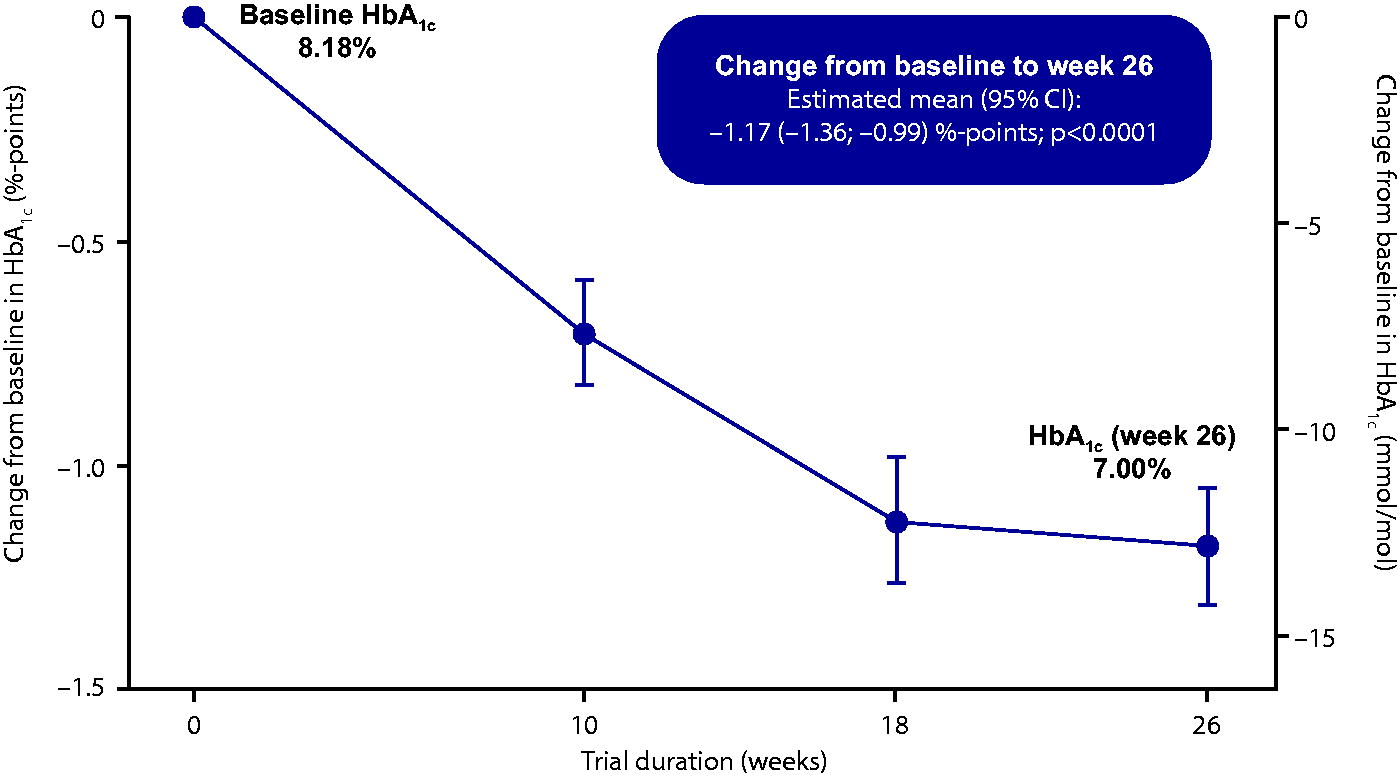
Mean change in HbA1c from baseline to week 26. Full analysis set. Graph shows mean observed data (symbols) ± standard error of the mean (error bars). CI, confidence interval; HbA1c, glycated hemoglobin.
Exploratory outcomes
From week −2 to week 0, all participants had ≥70% of CGM measurements available; from week 22 to week 26, 42 of 50 participants (84.0%) had these data available. Observed mean TIR increased from 54.4% at baseline (week −2 to 0) to 76.4% in the last 4 weeks of treatment (week 22–26) (Fig. 2). The estimated mean (95% CI) change in TIR from baseline was 21.6%-points (16.8; 26.3), representing a statistically significant (P < 0.0001 [post hoc statistical analysis]) increase that was equivalent to approximately 5 h and 11 min more time spent in range per day. A concomitant reduction in observed mean TAR (>180 mg/dL [>10.0 mmol/L]) from 45.2% at baseline (week −2 to 0) to 22.9% during the last 4 weeks of treatment (week 22–26) was seen, equivalent to a reduction from approximately 10 h and 50 min to approximately 5 h and 30 min spent above range per day. The observed mean TBR (<54 mg/dL [<3.0 mmol/L]) remained very low and consistent throughout the trial, at 0.03% at baseline and 0.04% in the last 4 weeks of treatment (each equivalent to approximately <1 min per day). The core CGM metrics of the study cohort at baseline (week −2 to 0) and during the last 4 weeks of treatment (week 22–26) are summarized in Supplementary Table S3.
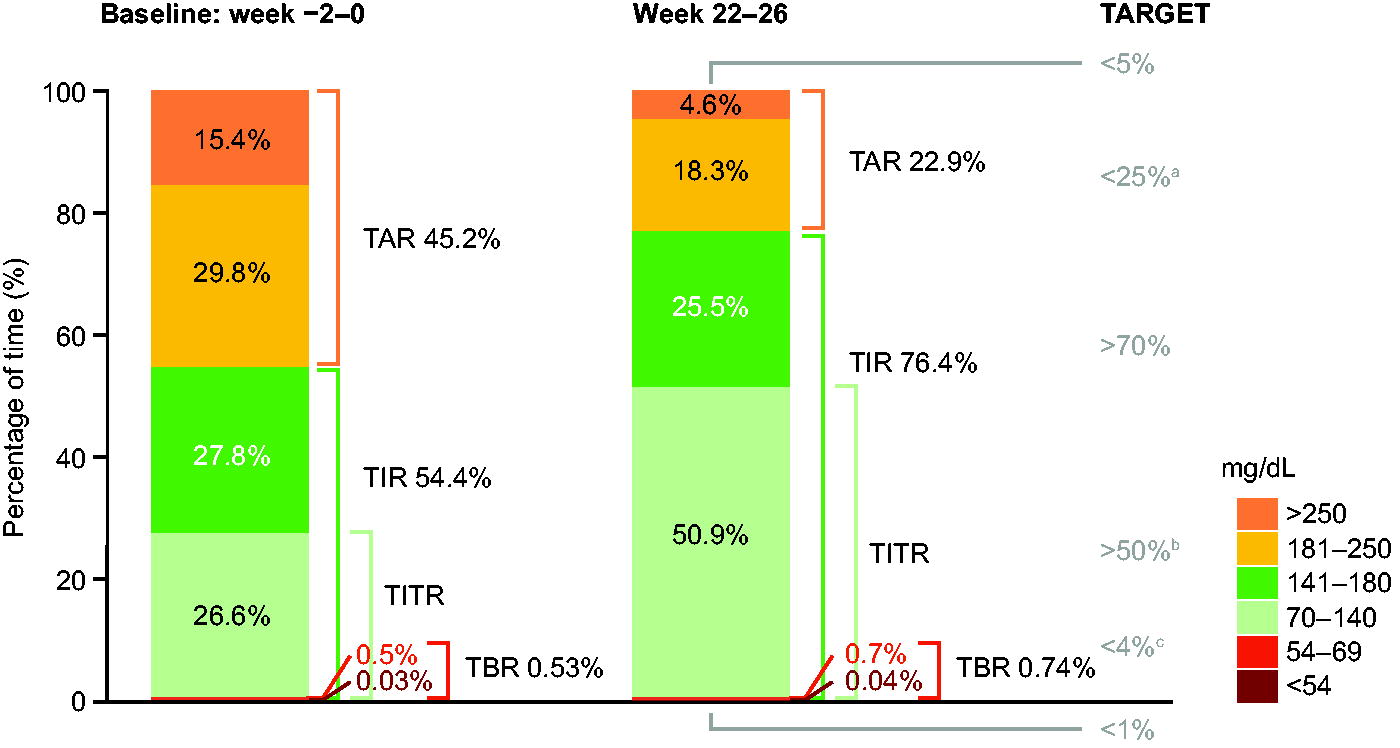
Observed CGM metrics at baseline (week −2 to 0) and during the last 4 weeks of treatment (week 22–26). aIncludes TAR >250 mg/dL. bCurrent suggested target for TITR (70–140 mg/dL), 17 pending consensus. cIncludes TBR <54 mg/dL. Full analysis set. Graph shows CGM metrics assessed as observed means. The percentage of time is defined as 100 times the number of recorded measurements in a given range, divided by the total number of recorded measurements. CGM, continuous glucose monitoring; TAR, time above range; TBR, time below range; TIR, time in range; TITR, time in tight range.
At week 26, 46 participants (92.0%) achieved HbA1c <8.0%, 23 participants (46.0%) achieved HbA1c <7.0%, while 21 participants (42.0%) achieved HbA1c <7.0% without clinically significant or severe hypoglycemia in the previous 12 weeks.
The numbers and rates of hypoglycemic episodes are presented in Table 2. Overall, no severe hypoglycemic episodes were reported during the trial. From week 0 until week 26, 13 clinically significant or severe hypoglycemic episodes in 10 participants (19.6%) were reported (all were clinically significant hypoglycemic episodes), equating to a rate of 0.51 episodes per patient-year of exposure in a period. When evaluated over 31 weeks, no additional clinically significant or severe hypoglycemic episodes occurred, equating to a rate of 0.43 episodes per patient-year of observation.
Hypoglycemia and Adverse Events
Rates shown are the number of adverse events per 1 patient-year of exposure (PYE; 1 PYE = 365.25 days) or the number of adverse events per 1 patient-year of observation (PYO; 1 PYO = 365.25 days). Hypoglycemia alert value: plasma glucose value of <70 mg/dL (<3.9 mmol/L) and ≥54 mg/dL (≥3.0 mmol/L), confirmed by blood glucose meter. Clinically significant hypoglycemia: plasma glucose value of <54 mg/dL (<3.0 mmol/L), confirmed by blood glucose meter. Severe hypoglycemia: hypoglycemia with severe cognitive impairment requiring external assistance for recovery. One participant reported one adverse event (medical device site bruise), possibly caused by the CGM sensor.
CGM, continuous glucose monitoring; N/A, not applicable; PYE, patient-year of exposure; PYO, patient-year of observation.
In the last 2 weeks of treatment (week 24–26), the mean weekly insulin dose was 208 U, equivalent to a daily insulin dose of approximately 30 U (Fig. 3). When adjusted for body weight, the mean weekly insulin dose was 2.17 U/kg, equivalent to approximately 0.31 U/kg/day.
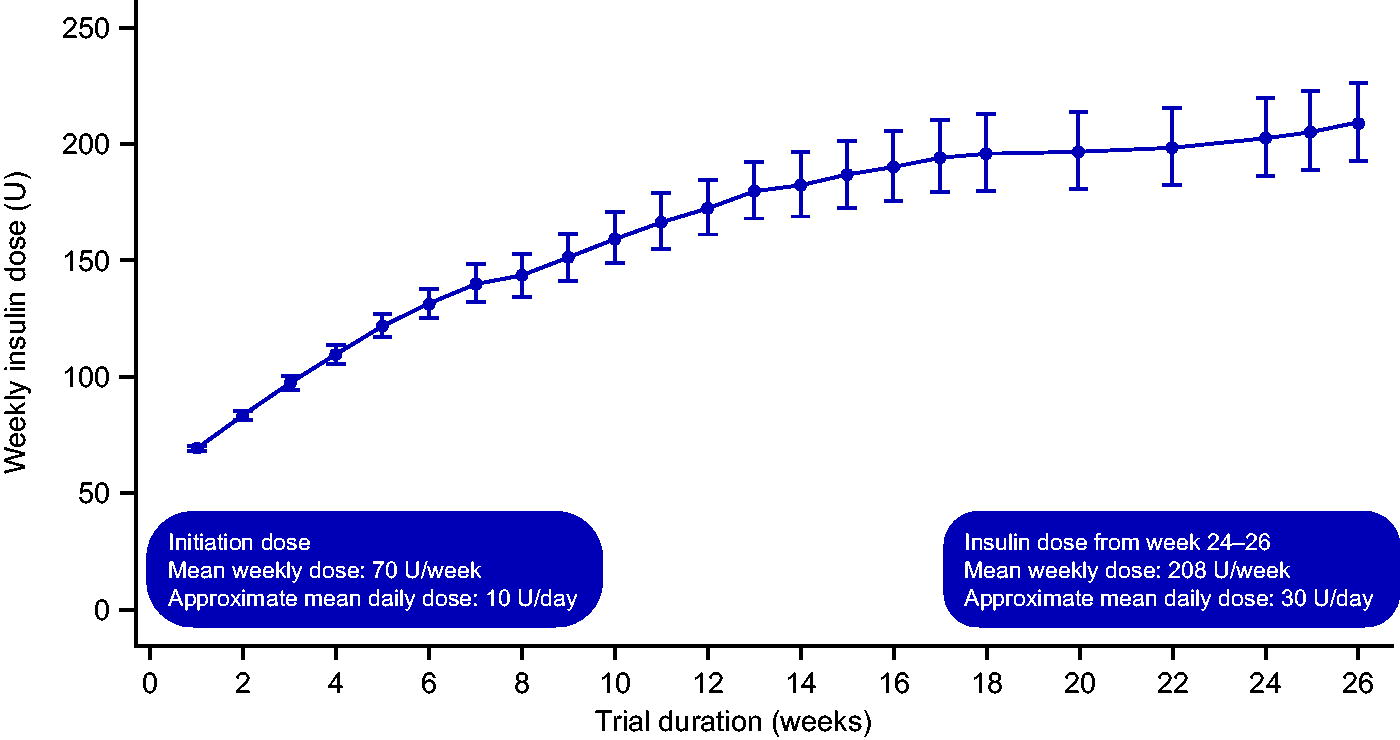
Observed weekly insulin dose from week 0 to week 26. Observed data from the safety analysis set. Graph shows geometric mean (symbols) ± standard error of the mean on a back-transformed log scale (error bars). U, units.
Additional assessments
Adverse events
From baseline to week 31, 113 adverse events (AEs) occurred in 42 participants (82.4%) (Table 2). The majority of AEs were non-serious, mild or moderate in severity, and were determined by the investigator as unlikely to be related to treatment with icodec. AEs experienced by ≥5% of participants are presented in Supplementary Table S4.
In total, 10 AEs in 10 participants (19.6%) were reported by study investigators as probably or possibly related to treatment with icodec. These events were dizziness (two participants; 3.9%), headache (two participants; 3.9%), diabetic retinopathy (two participants; 3.9%), injection site bruising (one participant; 2.0%), injection site mass (one participant; 2.0%), hypertonic bladder (one participant; 2.0%), and hyperhidrosis (one participant; 2.0%). The cases of diabetic retinopathy were reported as non-serious, mild in severity, with the outcome reported as “not recovered/not resolved.” No AEs led to participant withdrawal from the trial. In addition to AEs probably or possibly related to treatment with icodec, one participant (2.0%) reported one AE as medical device site bruise, possibly caused by the CGM sensor.
Two serious adverse events (SAEs) occurred in two participants (3.9%): one was reported as snake bite, and the other was reported as nephrolithiasis. Both SAEs were deemed unlikely to be related to icodec by the investigator, with the outcome reported as “recovered/resolved.”
Three hypersensitivity events (two moderate severity and one mild severity) were experienced by two participants (3.9%); two events were reported as dermatitis contact, and one event was reported as eye allergy; all three events were deemed unlikely to be related to treatment with icodec by the investigator and were reported as “recovered/resolved.” Injection site reactions were experienced by two participants (3.9%) (two events), with one reported as injection site bruising and one reported as injection site mass; both events were reported as mild in severity, deemed to be probably related to treatment with icodec by the investigator, and were reported as “recovered/resolved.”
Post hoc exploratory analyses
The CGM-based metrics by treatment day during week 0–2 and week 24–26 are summarized in Figure 4. The mean percentages of TIR, TAR, and TBR remained relatively stable across the treatment week during week 0–2. From week 24 to week 26, the percentage of TIR was marginally higher and the percentage of TAR was marginally lower on days 2, 3, and 4 after icodec injection. The percentage of TBR <54 mg/dL (<3.0 mmol/L) remained stable throughout the treatment week, while the percentage of TBR <70 mg/dL (<3.9 mmol/L) was slightly increased on days 3 and 4 after treatment administration. For both time periods, TBR values remained well below the internationally recommended targets across all 7 days.
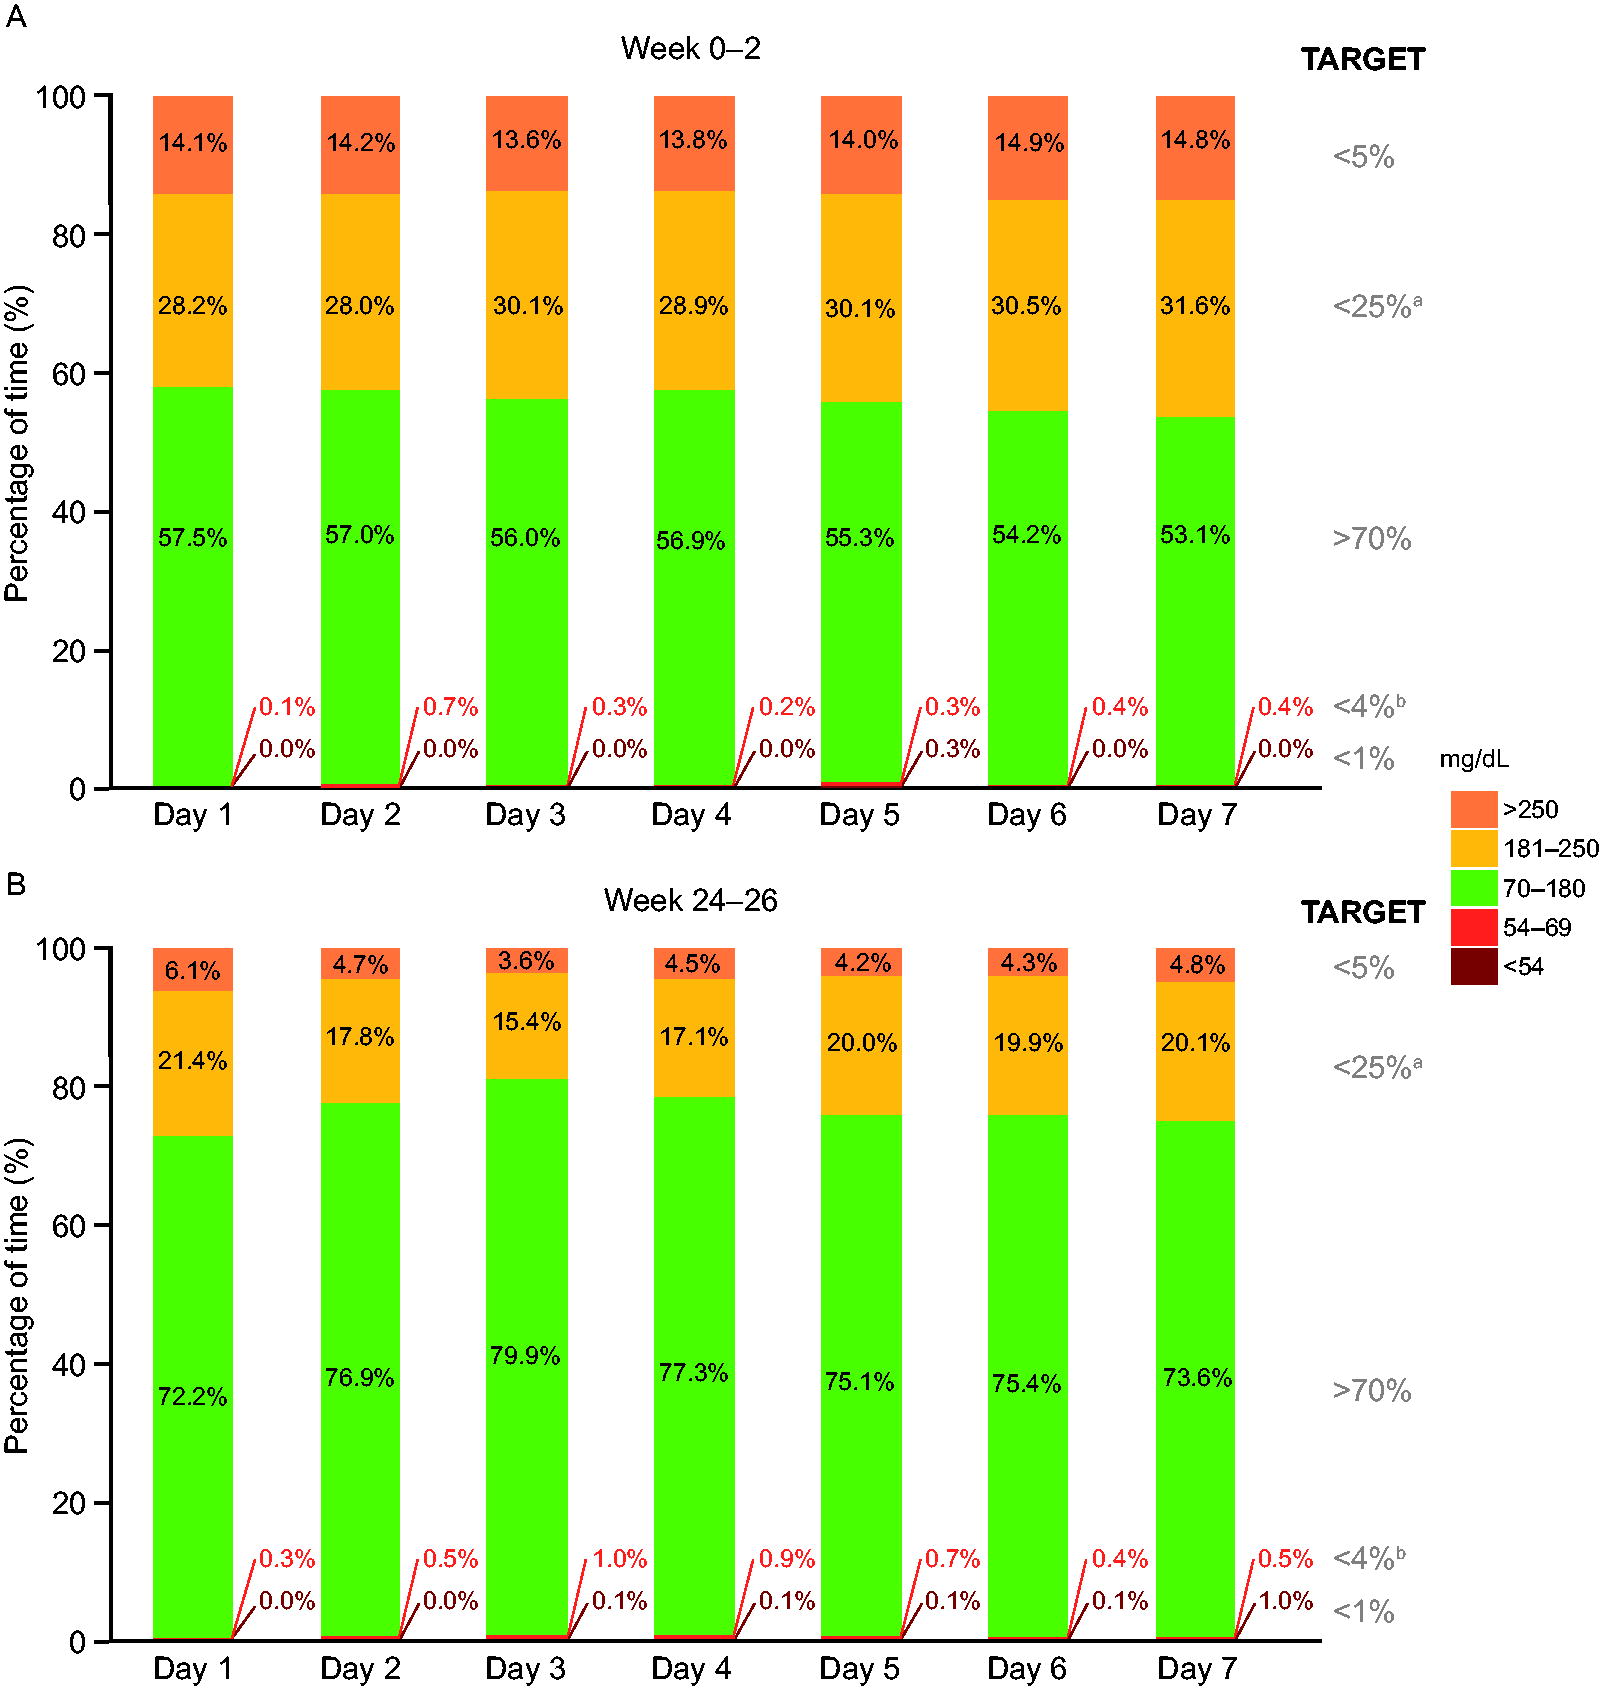
CGM-based metrics by treatment day during week 0–2
Summary ambulatory glucose profiles of CGM measurements for week −2 to 0 and week 24–26 are shown in Supplementary Figure S2. During week −2 to 0, the median glucose level was above the target range (>180 mg/dL [>10.0 mmol/L]) for several hours throughout the day; in contrast, during week 24–26, the median glucose level remained within range (70–180 mg/dL [3.9–10.0 mmol/L]) throughout the day.
Mean glycemic variability (CV%) was 25.52% during week −2 to 0, which increased slightly to 27.96% during week 22–26. Throughout the trial, the within-participant glycemic variability was ≤36% for most participants, with 96.1% of participants achieving this target at baseline (week −2 to 0) and 92.0% at week 22–26 (Supplementary Table S5). At baseline (week −2 to 0), fewer than half of the participants achieved the composite targets of >70% TIR and <1% TBR <54 mg/dL (<3.0 mmol/L) and >70% TIR and <4% TBR <70 mg/dL (<3.9 mmol/L) (43.1% and 41.2% of participants, respectively), whereas from week 22 to week 26, 76.0% of participants achieved the composite target of >70% TIR and <1% TBR <54 mg/dL (<3.0 mmol/L), and 74.0% of participants achieved the target of >70% TIR and <4% TBR <70 mg/dL (<3.9 mmol/L) (Supplementary Table S5).
CGM-based metrics across 2- or 4-week periods show that the internationally recommended target of TIR >70% was achieved at week 6–10 and was maintained throughout the trial. Furthermore, the percentage of TIR steadily increased, while the percentage of TAR steadily decreased from week −2 to 18, after which point both remained relatively stable through to the end of treatment (Fig. 5). The percentages of TBR <70 mg/dL (<3.9 mmol/L) and TBR <54 mg/dL (<3.0 mmol/L) remained relatively stable throughout the trial and were well below the internationally recommended targets of <4% and <1%, respectively.
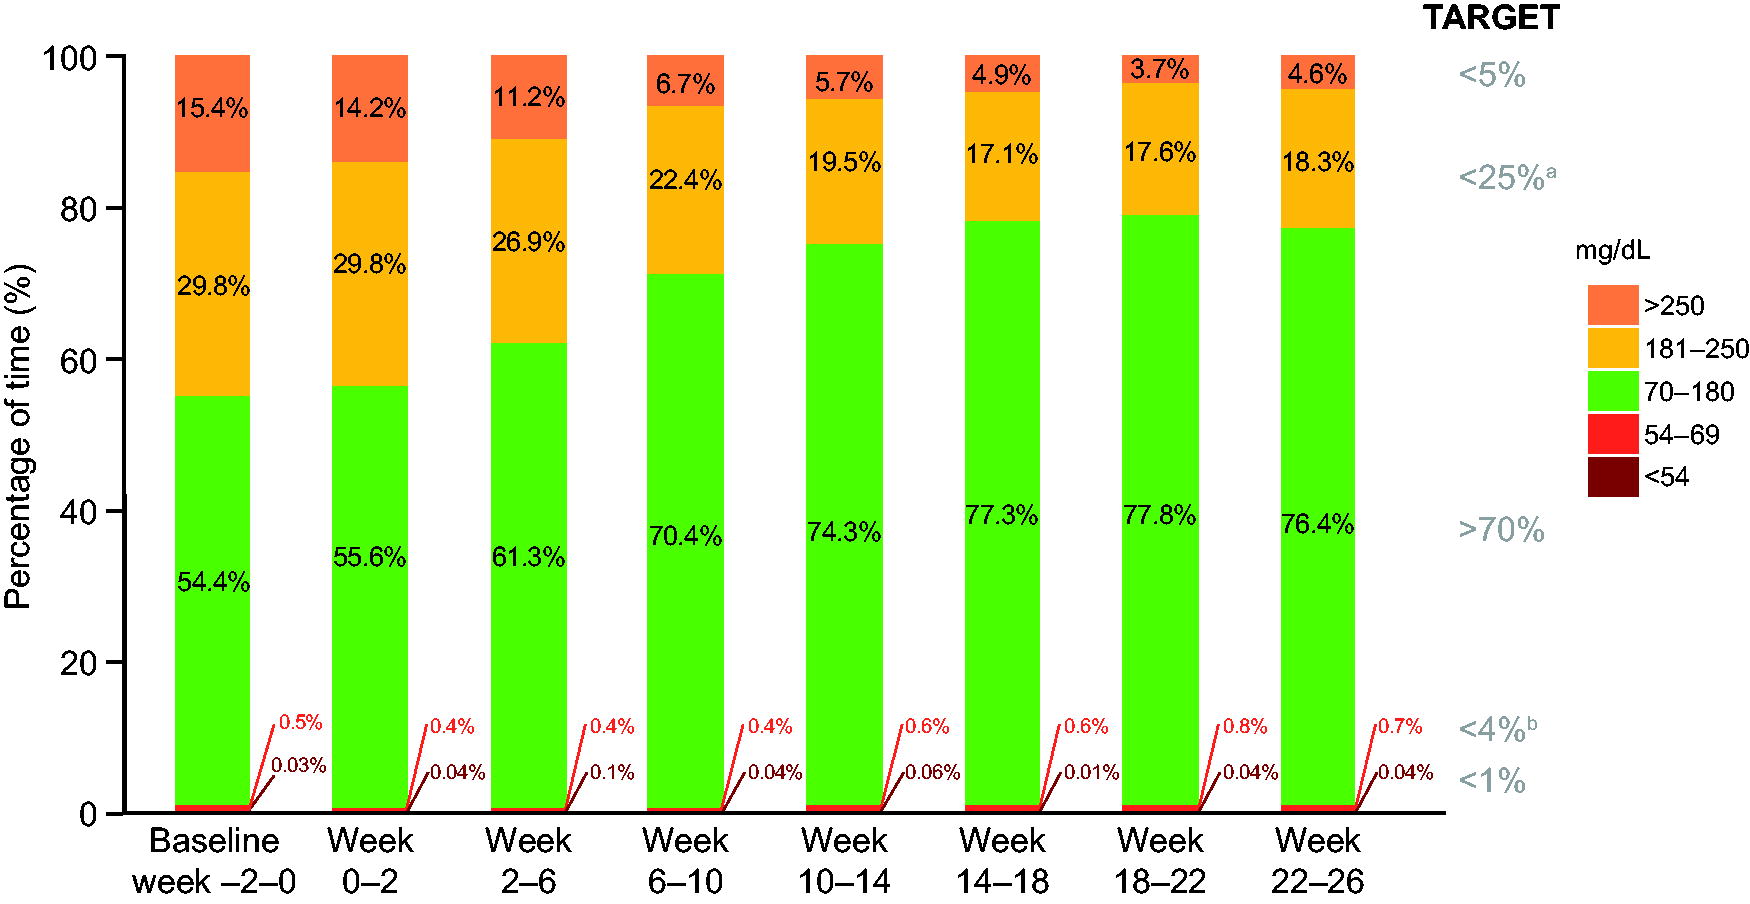
Observed CGM metrics across 2- or 4-week periods at week −2 to 26. aIncludes TAR >250 mg/dL. bIncludes TBR <54 mg/dL. Full analysis set. Graph shows CGM metrics assessed as observed means. Time spent is defined as 100 times the number of recorded measurements in a given range, divided by the total number of recorded measurements.
For those participants who had been using SU at screening (60.8%, n = 31), there was a slight, transient decrease in the percentage of TIR and an increase in the percentage of TAR compared with baseline values during the initial weeks of the trial (Supplementary Fig. S3A, B). The percentages of TIR and TAR between those participants who were using SU and those who were not reached similar levels after 10 weeks but did not reach matching levels until week 18.
Discussion
This 26-week, single-arm, phase 3b trial investigated the effect of CGM-based titration of once-weekly icodec on glycemic control and safety outcomes in insulin-naive adults with T2D.
The primary endpoint was met, and there was a statistically significant reduction in HbA1c from baseline to week 26. Additionally, there was a concomitant increase in the percentage of TIR, mainly due to a reduction in the percentage of TAR, since the percentage of TBR remained very low throughout the trial. Notably, the estimated mean change in percentage of TIR of 21.6%-points (approximately 5 h and 11 min of additional time spent in glycemic range per day) from baseline to week 22–26 is considerable, given that a change from baseline of 3%-points for a treatment group is considered clinically meaningful in a clinical trial setting. 18
The internationally recommended CGM targets 18 for TIR, TAR >180 mg/dL, TAR >250 mg/dL, TBR <70 mg/dL, and TBR <54 mg/dL were all achieved, with the targets for percentage of TIR and TAR being met during week 6–10 and maintained throughout the trial and the targets for percentage of TBR being met throughout the trial. Most participants achieved CV% ≤36%, indicating stable glucose levels following the initiation of icodec treatment, although the proportion of participants achieving this target decreased slightly from week −2 to 0 to week 22–26. Additionally, over two-thirds of participants achieved the composite targets of >70% TIR and <1% TBR <54 mg/dL (<3.0 mmol/L) and >70% TIR and <4% TBR <70 mg/dL (<3.9 mmol/L) at week 22–26. Furthermore, CGM-based metrics remained relatively stable throughout the week at baseline and during week 24–26, with a marginal increase in the percentage of TBR <70 mg/dL (<3.9 mmol/L) on days 3 and 4 after icodec injection during week 24–26, which was also observed in ONWARDS 1, 2, and 4. In the ONWARDS 1 trial, which also recruited adults with insulin-naive T2D, 4-week periods of double-blinded CGM data (Dexcom G6) were collected periodically throughout the trial. 19 A peak in percentage of TIR of 73.4% with icodec treatment was recorded during week 22–26 in ONWARDS 1, whereas the percentage of TIR was 76.4% during week 22–26 in the current trial. The percentages of TBR <54 mg/dL (<3.0 mmol/L) values with icodec treatment were below the internationally recommended target in both studies (ONWARDS 1: 0.3% during week 22–26, week 48–52, and week 74–78; ONWARDS 9: 0.04% during week 22–26). 11 However, in ONWARDS 1, icodec was titrated using pre-breakfast SMBG values, and, as CGM data were blinded, these could not be used to guide titration or lifestyle changes. Moreover, in contrast to the present study, the alarm functionality of the CGM device to signal low blood glucose levels was not used in ONWARDS 1. Taken together, these factors may have contributed to the somewhat more favorable results in ONWARDS 9 but with the caveat that it is difficult to compare across trials.
Overall, there were no observed severe hypoglycemic episodes throughout the trial, and no new safety issues were identified in relation to icodec treatment. The rate of combined clinically significant or severe hypoglycemia was low (below 1 episode per patient-year of exposure in a period); this rate was comparable with that observed in ONWARDS 1 and 3 and slightly higher than that observed in ONWARDS 5 (the three phase 3a ONWARDS trials in insulin-naive adults with T2D). 11,13,15 For all the ONWARDS phase 3a trials, hypoglycemic episodes were registered based on participant-recorded SMBG measurements (except for severe hypoglycemic episodes), and for the basal insulin only trials (ONWARDS 1–3 and 5), participants were required to record their daily pre-breakfast SMBG only. Conversely, the open CGM used in the current trial was accompanied by an alarm sounding when glucose levels decreased to <55 mg/dL (<3.1 mmol/L), and participants were instructed to scan at least four times a day to secure a complete dataset. Consequently, participants had more available information to help them to identify hypoglycemic episodes, which may have resulted in a slightly higher incidence of recorded hypoglycemic episodes. Taken together, these findings suggest that CGM-based titration of icodec is feasible in adults with T2D.
The strengths of this trial included the recording of CGM metrics throughout the duration of the trial and the inclusion of all CGM data in the analysis. Finally, CGM readings were open to both participants and investigators, which, paired with the recommended titration guidelines, allowed for more individualized treatment adjustments to be made in the current trial.
However, this trial also had several limitations that should be considered when interpreting the results. First, the small cohort of 51 participants from a single country may limit the generalizability of results to other countries/regions or populations. Moreover, because this was a single-arm trial, it is not possible to directly compare icodec titration with CGM versus SMBG or against CGM titration with another treatment product.
Second, a subgroup analysis of those treated with SU at baseline revealed some transient differences in CGM-based metrics compared with participants who had not been using SU. These differences could also have affected fasting glucose measurements and, as a result, icodec dose titration.
Finally, patient-reported outcomes were not assessed in this trial; therefore, the possible benefits of CGM from the participants’ perspectives were not quantified.
In addition, it is worth considering the potential variability in the timing of when participants measured their pre-breakfast fasting CGM values to inform the titration of icodec. For example, participants could have taken a measurement immediately when they woke up, or just before they ate breakfast (which could have been several hours later), and these values could vary considerably.
Daily insulin injections, combined with the inconvenience of SMBG measurements, add to the treatment burden faced by individuals with T2D, especially if they are required multiple times per day. This, in turn, can lead to reduced treatment adherence and the reluctance of individuals to titrate basal insulin or perform SMBG. 20,21 The combined use of once-weekly icodec and CGM-based titration would reduce the insulin injection burden by approximately 300 injections per year and would remove the need for finger pricks. These factors could increase the convenience of basal insulin therapy for individuals with T2D.
Conclusions
In this 26-week, single-arm, phase 3b trial of insulin-naive individuals with T2D, CGM-based titration of once-weekly icodec resulted in a statistically significant reduction in HbA1c from baseline to week 26. Moreover, the internationally recommended CGM targets for TIR, TAR >180 mg/dL, and TBR <54 mg/dL were all achieved, without severe hypoglycemia. Taken together, these findings suggest that CGM-based titration of icodec is feasible in adults with T2D. Additional data, analyses, or studies exploring other approaches to using CGM to guide weekly insulin titration would be of interest.
Footnotes
Acknowledgments
The authors thank all trial participants and trial site staff. Medical writing support was provided by Adam Hargreaves, PhD, and Erin Aldera, PhD, of Oxford PharmaGenesis, Oxford, UK.
Authors’ Contributions
A combination of academic authors and authors who are employees of Novo Nordisk (the trial sponsor) participated in developing the trial concept and design and in collecting the data. All the authors were involved in the analysis and interpretation of data, participated in preparing the article, and approved the final article that was submitted.
Author Disclosure Statement
R.M.B. has received research support or honoraria for participation in advisory boards or for consulting from Abbott Diabetes Care, Ascensia, Bigfoot Biomedical, CeQur, Dexcom, Eversense, Hygieia, Insulet, Eli Lilly and Company, Medtronic, Novo Nordisk, Onduo, Roche Diabetes Care, Sanofi, Tandem Diabetes Care, United Healthcare, Vertex Pharmaceutical, and Zealand Pharma. His technology research is funded in part by the National Institute of Diabetes and Digestive and Kidney Diseases and Helmsley Charitable Trust. R.M.B.’s employer, the nonprofit HealthPartners Institute, contracts for his services, and no personal income from any of these activities goes directly to him. B.Á., T.J.B., and S.H. are employees of Novo Nordisk A/S. Y.W. has received consulting fees and/or honoraria for participation in advisory boards or speaking for Novo Nordisk. C.W. has received research support or honoraria for participation in advisory boards, consulting or speaking from Abbott Diabetes Care, AbbVie, Bayer, Biomea, Eli Lilly, MannKind, and Novo Nordisk.
Funding Information
This trial was funded by Novo Nordisk A/S.
Supplementary Material
Supplementary Data S1
Supplementary Data S2
Supplementary Figure S1
Supplementary Figure S2
Supplementary Figure S3
Supplementary Table S1
Supplementary Table S2
Supplementary Table S3
Supplementary Table S4
Supplementary Table S5