
Abstract
Introduction:
Integrating mobile health (mHealth) apps into daily diabetes management allows users to monitor and track their health data, creating a comprehensive system for managing daily diabetes activities and generating valuable real-world data. This analysis investigates the impact of transitioning from traditional self-monitoring of blood glucose (SMBG) to real-time continuous glucose monitoring (rtCGM), alongside the use of a mHealth app, on users’ glycemic control.
Methods:
Data were collected from 1271 diabetes type 1 and type 2 users of the mySugr® app who made a minimum of 50 SMBG logs 1 month before transitioning to rtCGM and then used rtCGM for at least 6 months. The mean and coefficient of variation of glucose, along with the proportions of glycemic measurements in and out of range, were compared between baseline and 1, 2, 3, and 6 months of rtCGM use. A mixed-effects linear regression model was built to quantify the specific effects of transitioning to a rtCGM sensor in different subsamples. A novel validation analysis ensured that the aggregated metrics from SMBG and rtCGM were comparable.
Results:
Transitioning to a rtCGM sensor significantly improved glycemic control in the entire cohort, particularly among new users of the mySugr app. Additionally, the sustainability of the change in glucose in the entire cohort was confirmed throughout the observation period. People with type 1 and type 2 diabetes exhibited distinct variations, with type 1 experiencing a greater reduction in glycemic variance, while type 2 displayed a relatively larger decrease in monthly averages.
Introduction
Diabetes is recognized globally as a serious disease, not only because it is challenging to manage but also because it may cause short- and long-term complications. 1 –10 These complications also weigh on people living with diabetes and their health care systems. 11,12 For this reason, many governments around the world have brought diabetes to the forefront of public health discussions and, in some cases, have implemented action plans, recommendations, and established guidelines to ensure that patients have the right access to care, medications, devices, education, 13,14 and other tools to best help prevent, treat, and manage the disease. 15 –18
In 2022, the World Health Organization member states established global diabetes targets for the first time to reduce the risk of diabetes and move toward a world where all people who are diagnosed with diabetes have access to equitable, comprehensive, affordable, and quality treatment and care. 19 The second target is that 80% of people diagnosed with diabetes have good glycemic control. 19 Good control is often defined as an HbA1c level <7%, which correlates with an average blood glucose (BG) level of 154 mg/dL. 20,21
Understanding glucose levels and overall glycemic control, regardless of the diabetes type, is an integral component of diabetes management. Approaches to optimizing glycemic control and managing diabetes are different for every patient and may change over time, thus suggesting a more personalized approach to care. 22 Therapies are often tailored to the individual with medication, various devices, medical nutrition therapy, or a combination thereof. 23
Moreover, software plays a role in the management of diabetes through advanced technologies that enable closed-loop insulin pump systems 24 or platforms 25,26 that allow for the collection and visualization of data to make treatment decisions. All these aspects come together to help support the management of the disease and aim to support a high quality of life for people with diabetes while simultaneously reducing the burden on people living with diabetes, health care providers, and health care systems.
Digital platforms, mobile applications, and algorithms are advancing at an accelerated pace compared with traditional medication therapies, thereby offering people with diabetes innovative ways to manage their disease, as well as ways to share their data with their health care providers and caregivers. 25,27 –29 Digital health technologies have proven beneficial for people with diabetes. 30 The American Diabetes Association’s Standards of Care 2024 highlights the use of diabetes technology with recommendations on device principles and glucose monitoring, both with self-monitoring of BG (SMBG) and continuous glucose monitoring (CGM). Furthermore, it highlights the importance of the standards of the International Organization for Standardization (ISO) and the Food and Drug Administration (FDA) standards. 31
Worldwide, standards of care are based on clinical studies, demonstrating the safety and efficacy of the intervention. Real-world data analyses, covering factors such as costs, utilization, and lab results, further support and enhance evidence. 32 –36 Such findings inform health care professionals, policymakers, payers, and people with diabetes and their caregivers.
The mySugr® real-world database offers a unique and global opportunity to dive deeper into how people with diabetes use the mySugr app to visualize their glucose values and manage their disease. The mySugr app has received ISO certification, and the European Union 37 classifies its logbook as a class IIa medical device. It is an exempt device under FDA regulations in the United States. It is a tool intended for all people with diabetes aged 16 and older who measure their glucose, whether by SMBG or CGM. Glucose data can be entered either manually or automatically uploaded to the electronic logbook from a connected glucose meter by a person with diabetes or through a direct connection with third-party applications (such as the Apple Health Kit or Google Fit). In addition to visualizing glucose data and adding contextual information, the mySugr logbook provides high usability and satisfaction for people with diabetes to manage their disease. The app has also been associated with increased engagement, a significant reduction in severe hyperglycemic and hypoglycemic glucose measurements, and a reduction in diabetes distress. 38
The mySugr app is available in over 80 countries and has more than 5 million downloads. Through its logbook, as well as the bolus calculator and pump control products, mySugr provides users with a comprehensive ecosystem of diabetes-related health data, which stores and overviews glucose measurements, insulin, exercise, mood tags (user-indicated event), carbohydrate intake, and meal image data, among others. Given the breadth of the mySugr database in terms of global reach and the availability of data on diabetes type, therapy, glucose values from blood glucose monitoring (BGM) and CGM, and other data features, there was an opportunity to further investigate the differences in glycemic control between different types of users. More specifically, the primary research question was to determine how the transition from SMBG to real-time CGM (rtCGM) affected glycemic control in people with diabetes who were active users of the mySugr app.
Methods
This retrospective data analysis was performed on a global database of people with diabetes using the mySugr app to log their glucose data and support their daily management of the disease. The population analyzed contained all data collected from mySugr users from November 2015 to January 2024, who signed the electronic consent for data processing. The period includes data captured from the first rtCGMs in the market until today, thereby investigating the general effect of transitioning from SMBG to a rtCGM.
Inclusion criteria
The inclusion criteria were all users with type 1 or type 2 diabetes currently using any rtCGM sensor and who had used the mySugr app for SMBG with a BG meter for at least 1 month before transitioning to a rtCGM. Furthermore, the same users had to have made at least 50 SMBG logs with the mySugr app in the last month of SMBG use (baseline month, represented as −1 in graphs). After the transition to rtCGM, users were required to continue using the glucose sensor for at least 6 months. Finally, people who transitioned to rtCGM needed to meet the minimum data sufficiency requirements, which was the wear time of their rtCGM for at least 70% of the time in each rtCGM measured month, which was in alignment with the guidance set by the ambulatory glucose profile. 20,39 –41
Real-world data statistical analysis plan
The dependent variables of the mean and glycemic coefficient of variation (CV), as well as the proportion of glycemic measurements below, in, and above range, were aggregated for every month and compared between the baseline and subsequent rtCGM months. Based on the earlier validation analysis (see Supplementary Appendix SA2), it was concluded that the monthly aggregates from SMBG users with at least 50 measurements per month were comparable with the monthly aggregates from rtCGM.
A repeated-measures analysis of variance (ANOVA) was conducted to examine changes in glycemic metrics over all months. Post-hoc analyses were based on paired-sample t-tests for pairwise comparisons, which assessed the significance of the changes between the baseline and subsequent rtCGM months. This also helped to assess the sustainability of the sensor’s effect on glycemic metrics in the months following the transition.
Mixed-effects linear regression model
To quantify the effects of transitioning to a rtCGM sensor using the mySugr app, as well as their joint effect on glycemic metrics, a mixed-effects linear regression model was built on the transition time between SMBG and rtCGM (months −1 to 1). Mixed-effects models are particularly suited for assessing differences in a matched cohort with measures gathered at different times. Transition time, diabetes type, and a binary variable representing whether the user is new to mySugr (≤3 months of use) were included as predictors of glycemic metrics.
All glycemic variables were modeled with the same model form on the data from month −1 to month 1 (Supplementary Appendix SA1, Tables S2 and S3):
X1, the cgm_onset, corresponds to treatment onset, that is, rtCGM versus SMBG, where 0 indicates SMBG and 1 indicates rtCGM.
X2, the new_to_mysugr, is a binary variable indicating whether the user is a new mySugr mobile application user, that is, the user began using the rtCGM within 3 months of beginning to use mySugr (1, otherwise 0). This was done to control for the confounder of improved glycemic control from mySugr use onset and to study its potential interaction with beginning to use a rtCGM.
X3 indicates diabetes type, where type 2 = 0, and type 1 = 1.
Lastly, two interaction terms were added (
The length of mySugr use was particularly important to separate from transitioning to a rtCGM because already published evidence indicated that early use of the mySugr app was associated with a positive effect on glycemic control. 42 It was an important factor to separate from the effect of the rtCGM, as users who were new to mySugr could overinflate the effect of the rtCGM on glycemic metrics. Thus, a “new user” was defined as a user who transitioned to a rtCGM within 3 months of starting to use mySugr (while having at least 1 month of SMBG use before transitioning to the rtCGM). Moreover, this made it possible to assess whether the transition to a sensor in the early days of mySugr use yielded an additional benefit to glycemic control.
Results
Statistical analysis plan results
This analysis utilized data collected from mySugr users across 46 countries distributed across Africa (3), the Americas (5), the Eastern Mediterranean (3), Europe (27), Southeast Asia (2), and the Western Pacific (6). Those users who met the inclusion criteria for this analysis totaled 1271 mySugr users, of whom the majority were people with type 1 diabetes (n = 945). Type 2 diabetes accounted for 25.6% of the users (n = 326). The additional descriptive statistics are presented in Table 1.
Demographic Information of the Users Included in this Analysis, with an Overall Sample of 1271 Users
Of 1271 users, 74.4% had type 1 diabetes and 25.6% had type 2 diabetes. This analysis included users on multiple therapies who used both self-monitoring of blood glucose and real-time continuous glucose monitoring using a sensor device.
IQR, interquartile range; SD, standard deviation.
Improvement of mean glucose after transitioning to rtCGM
Figure 1 shows three graphical cohorts of the mean glucose distributed from the baseline (SMBG month, −1) to the subsequent months (1, 2, 3, and 6). The reduction in mean glucose after transitioning to the rtCGM sensor was statistically significant for the entire sample (Fig. 1A) and for users with type 2 diabetes (Fig. 1C) at all time points (repeated-measures ANOVA, P < 0.001 in the whole sample and in the type 2 subsample separately; paired samples t-tests for contrasts −1 vs. 1, −1 vs. 2, −1 vs. 3, and −1 vs. 6 with the Bonferroni correction applied; all P < 0.01). The reduction in the type 1 sample was also significant (repeated-measures ANOVA, P < 0.001) albeit without the sustainability effect observed in the 6th month (paired samples t-tests for contrasts −1 vs. 1, −1 vs. 2, and 1 vs. 3 with the Bonferroni correction applied P < 0.01; −1 vs. 6, P = 0.42) (Fig. 1B).
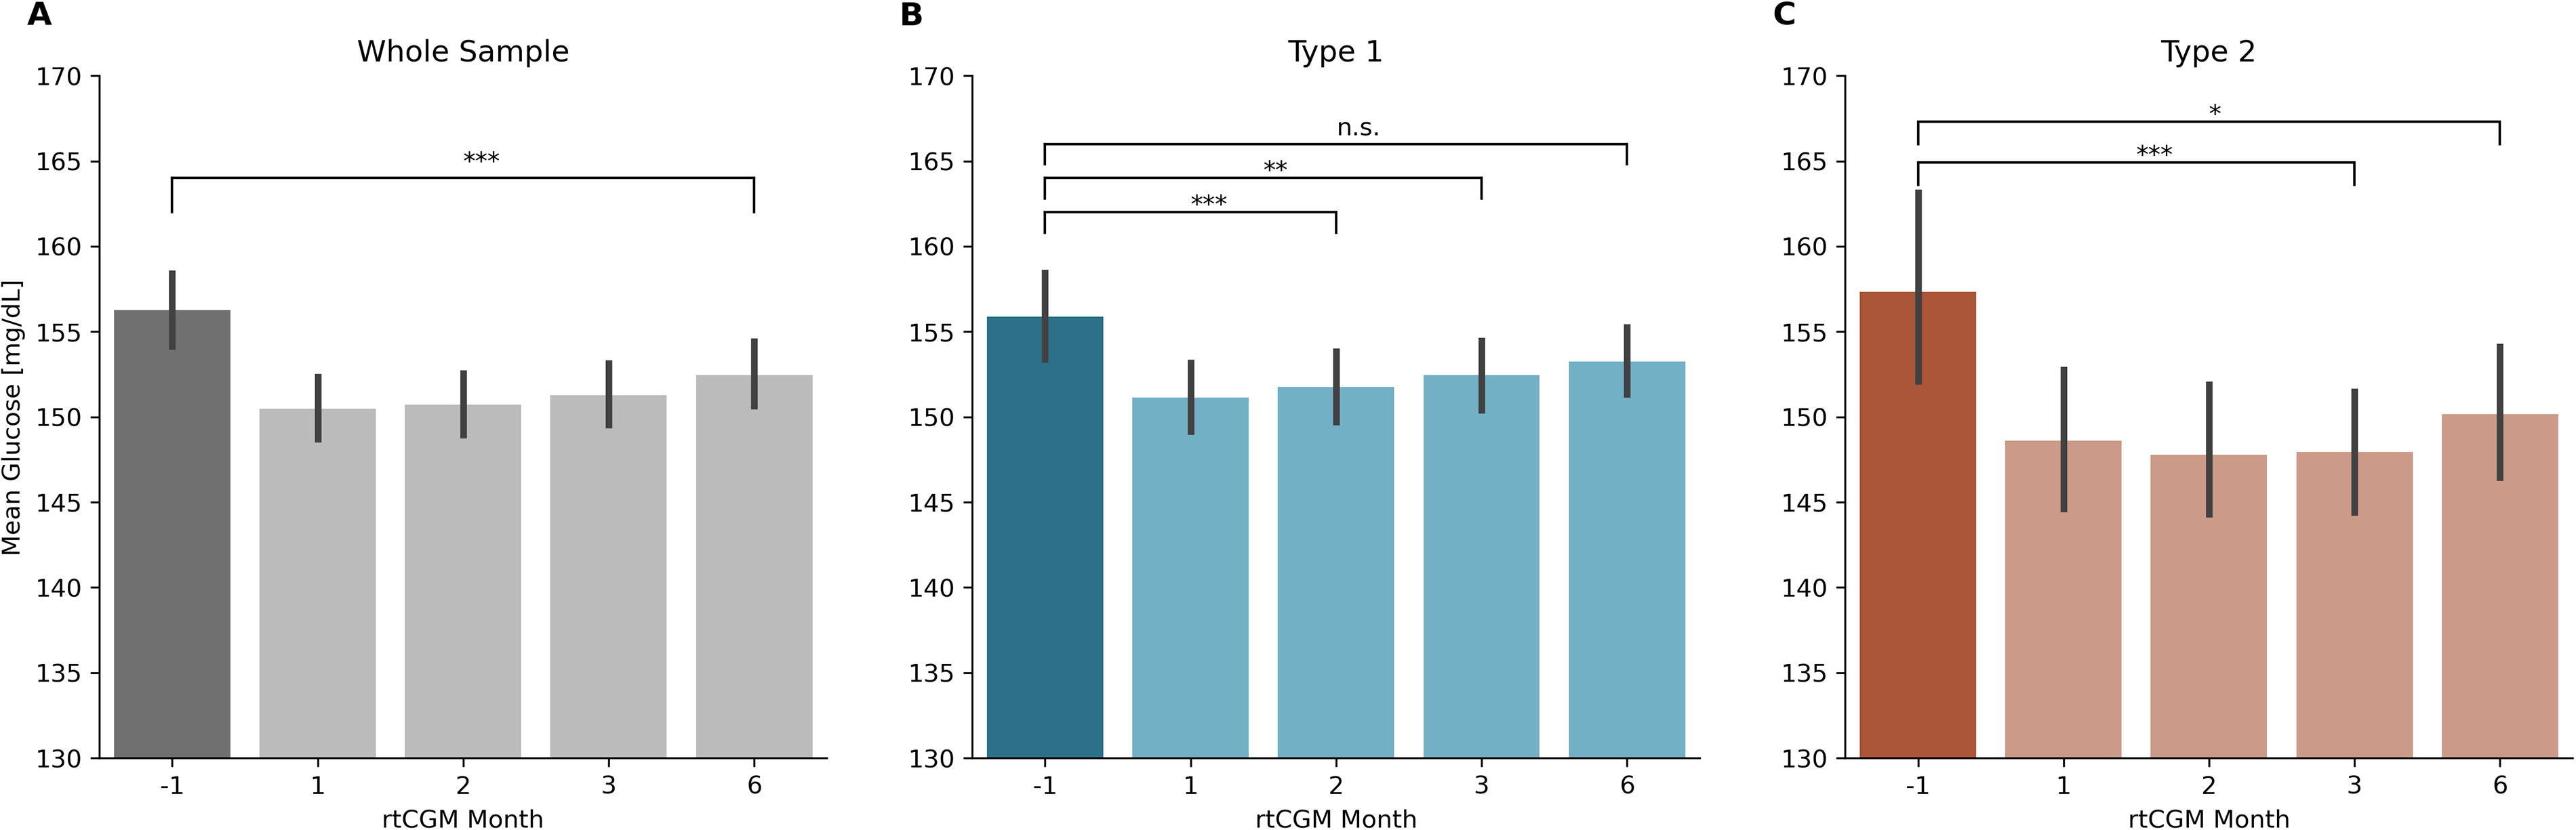
Mean glucose at baseline (month −1) and months 1, 2, 3, and 6 of rtCGM use in the whole sample
Figure 2 shows the change in mean glucose in the first month of rtCGM use as a function of binned baseline mean glucose, separated by diabetes type where the directions and magnitudes of changes in the first month fluctuated differently depending on the baseline mean glucose, such that relatively lower baseline values were observed to have a slight increase in mean glucose in the first month, while those with relatively larger baseline values were observed to have decreased upon transitioning to a rtCGM (Spearman rank correlation coefficient between non-binned baseline mean glucose value and change in mean glucose in the first month for type 1: ρ = −0.51, P < 0.001; for type 2: ρ = −0.55, P < 0.001).
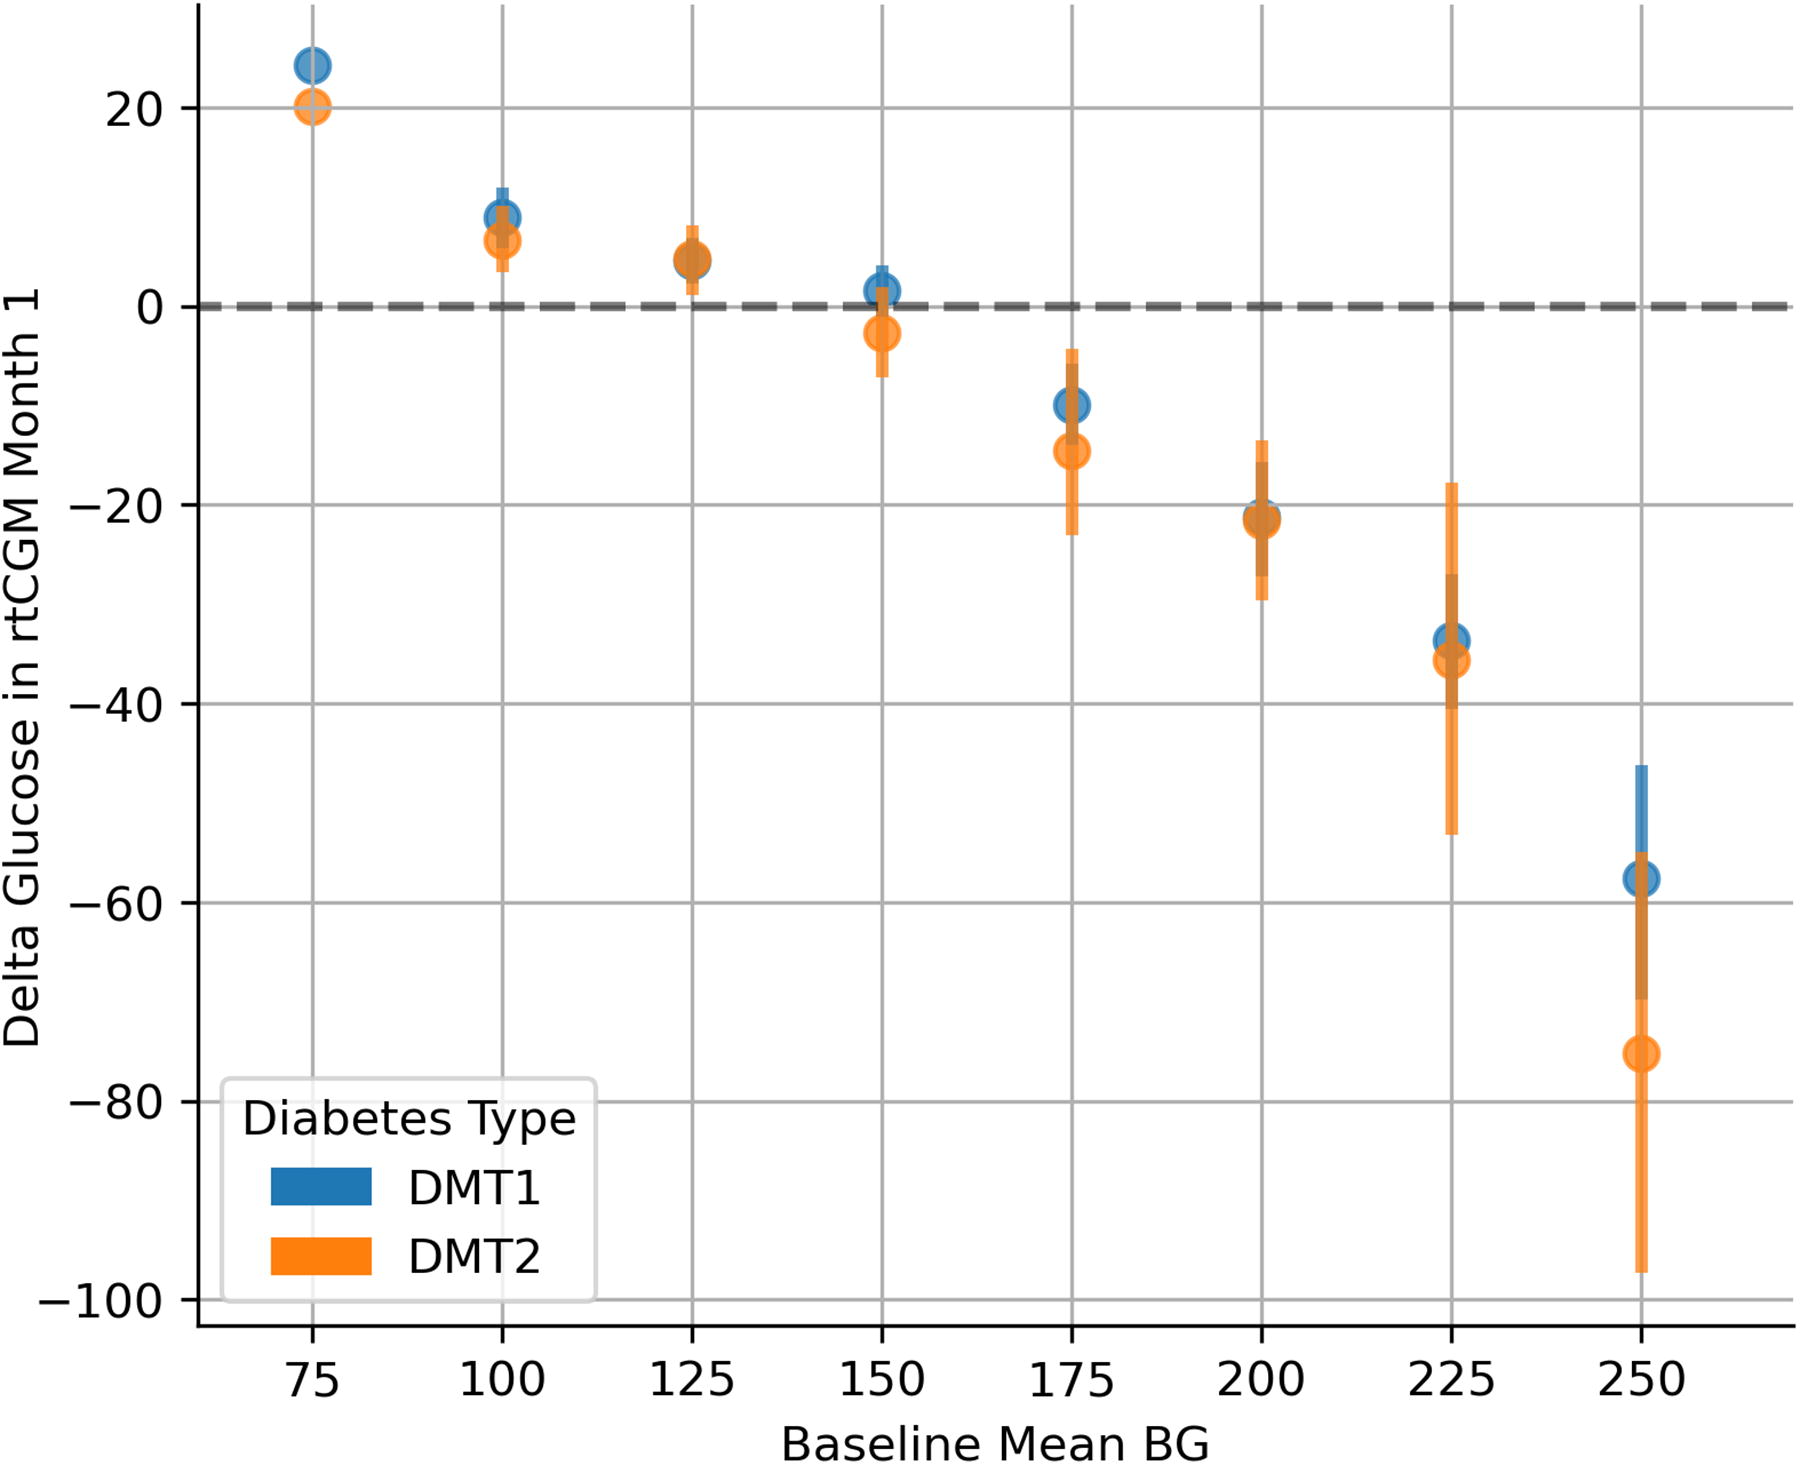
Change in mean glucose in the first month of rtCGM use as a function of baseline glucose value, binned in 25 mg/dL bins, stratified by diabetes type. An increase in mean glucose was noted for those with relatively lower baselines, and larger decreases were noted for those with relatively higher baselines (Spearman’s rank correlation ρ = −0.51; P < 0.001 and ρ = −0.55; P < 0.001, between non-binned baseline glucose value and delta glucose value in the first month for the type 1 and type 2 subsamples, respectively).
Coefficient of variation
Figure 3 represents the CV of glucose distributed from the baseline (SMBG month, −1) to the subsequent months (1, 2, 3, and 6) in the sample stratified by diabetes type. The reduction in CV after transitioning to the rtCGM sensor was statistically significant for the entire sample (Fig. 3A) and type 1 users (Fig. 3B) at all time points. For type 2 (Fig. 3C), the reduction was statistically significant in the second month of rtCGM use and remained significant at months 3 and 6 (P < 0.01).
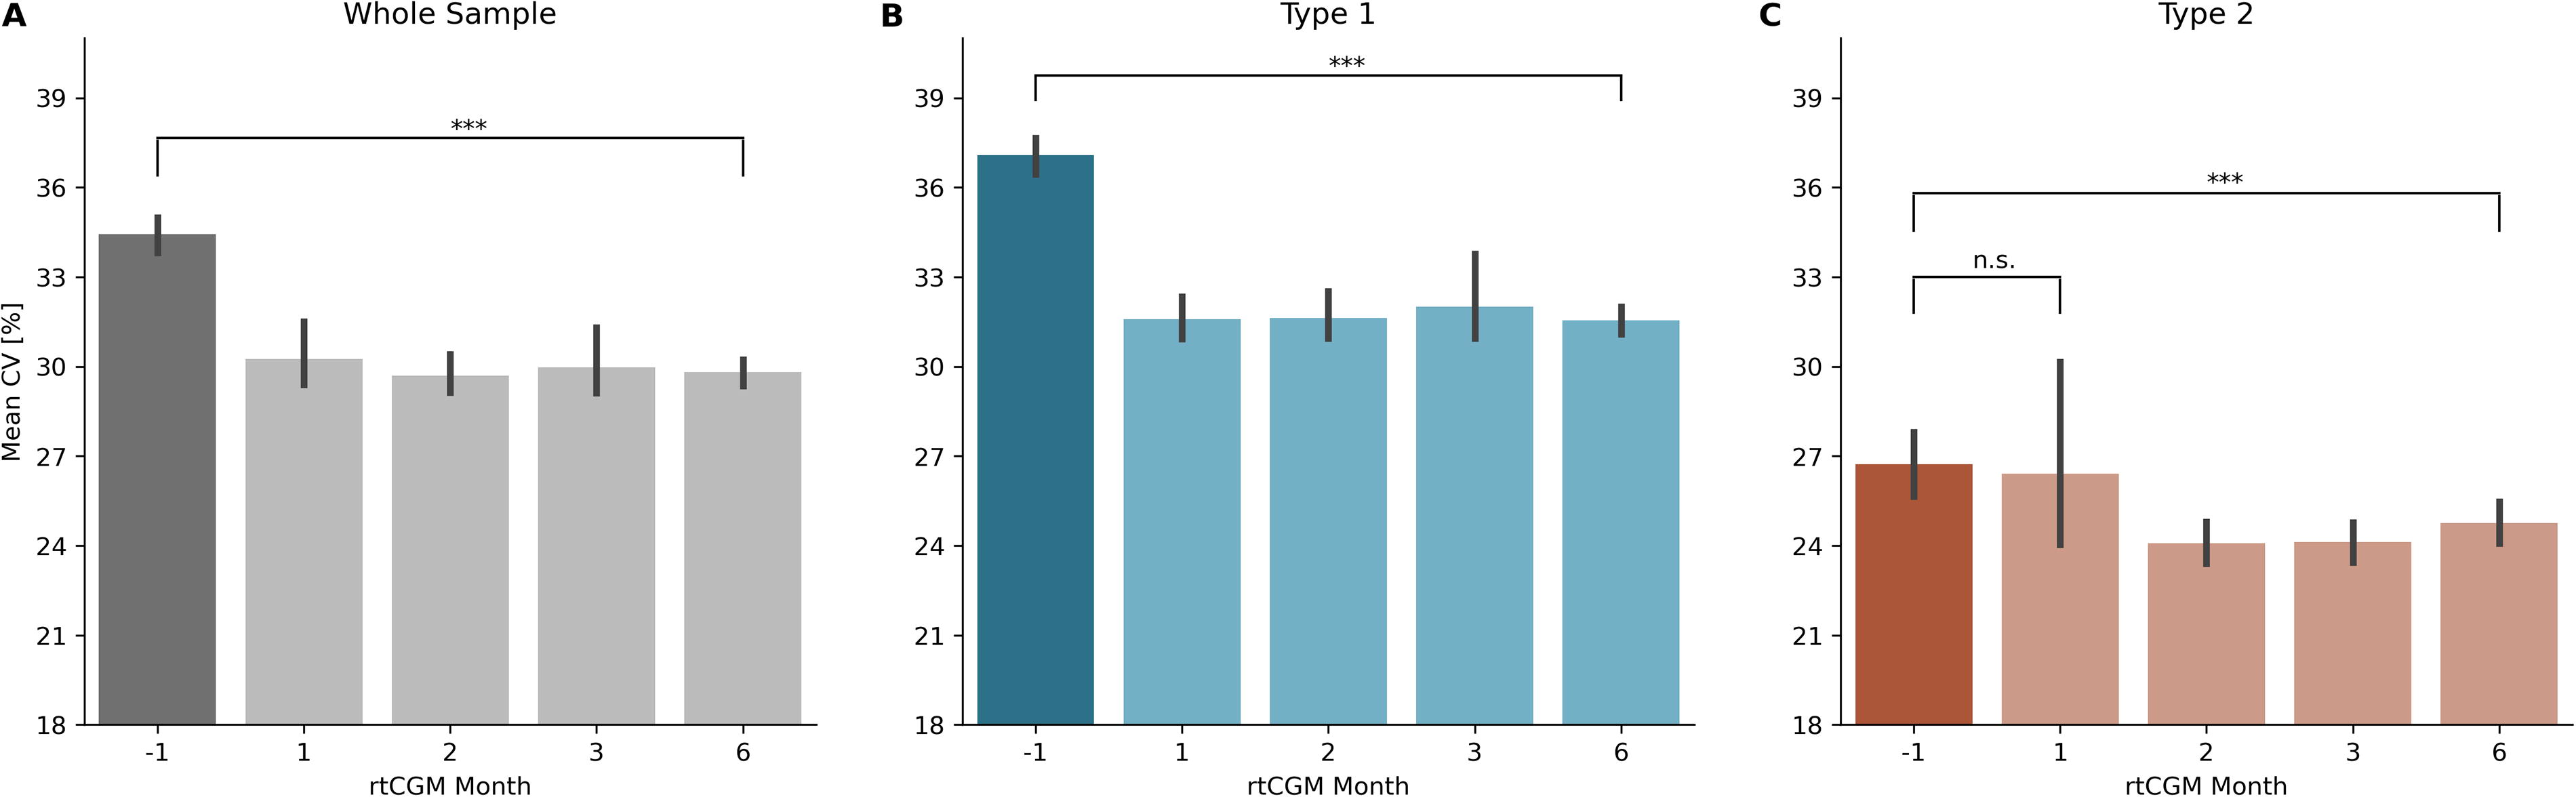
Coefficient of variation of glucose at baseline (month −1) and months 1, 2, 3, and 6 of rtCGM use in the whole sample
Similar to the fluctuation in mean glucose, the monthly CV changes also depended on the value in the baseline month (Fig. 4), where differences in direction and magnitude were observable for users with different baselines, such that relatively lower baseline values were observed to have a slight increase in the CV of glucose in the first month, while those with relatively larger baseline values were observed to have decreased upon transitioning to a rtCGM (Spearman rank correlation coefficient between non-binned baseline CV of glucose value and change of CV in the first month for type 1: ρ = −0.65, P < 0.001; for type 2: ρ = −0.69, P < 0.001).
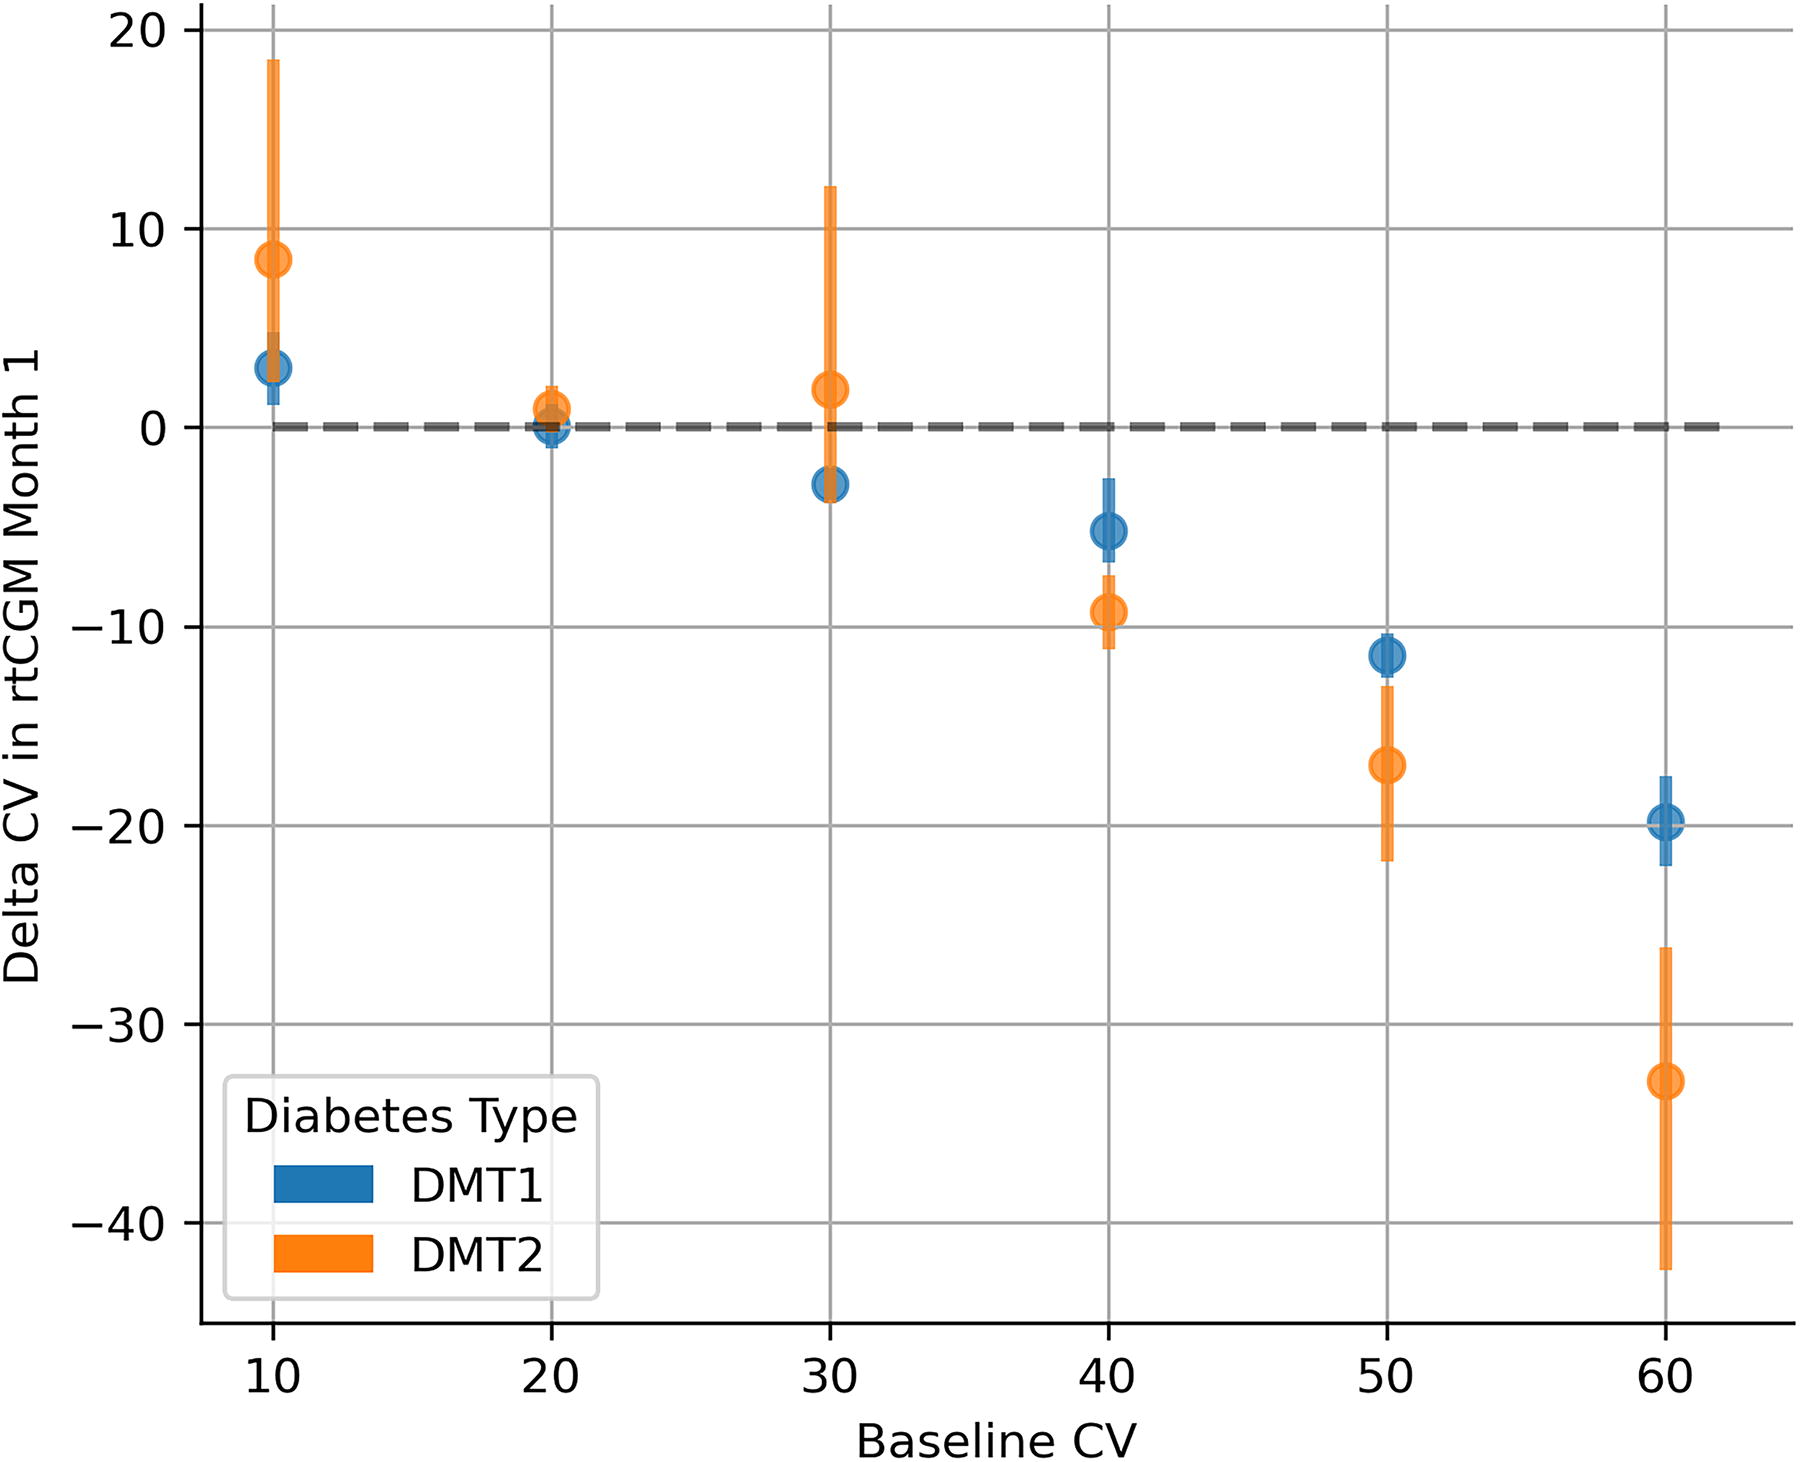
Change in the glycemic coefficient of variation in the first month of rtCGM use as a function of baseline CV of glucose value, binned in 10 mg/dL bins, stratified by diabetes type. An increase in the glycemic coefficient of variation was noted for those with relatively lower baselines, and larger decreases were noted for those with relatively higher baselines (Spearman’s rank correlation ρ = −0.65; P < 0.001 and ρ = −0.69; P < 0.001 between non-binned baseline CV and delta CV in the first month for type 1 and type 2 subsamples, respectively).
Proportions of glucose measurements in and out of range
Figure 5 shows how the proportions of measurements in and out of range (range defined between 70 and 180 mg/dL 40 ) change across the transition time. A marked, statistically significant increase in the proportion of time in range is observed (repeated-measures ANOVA in the whole sample and type 1 diabetes and type 2 diabetes subsamples, paired samples t-tests between month −1 and CGM months; all P < 0.01), accompanied by decreases in time below and time above range, for the whole sample (Fig. 5A) and for type 1 (Fig. 5B) and type 2 (Fig. 5C).
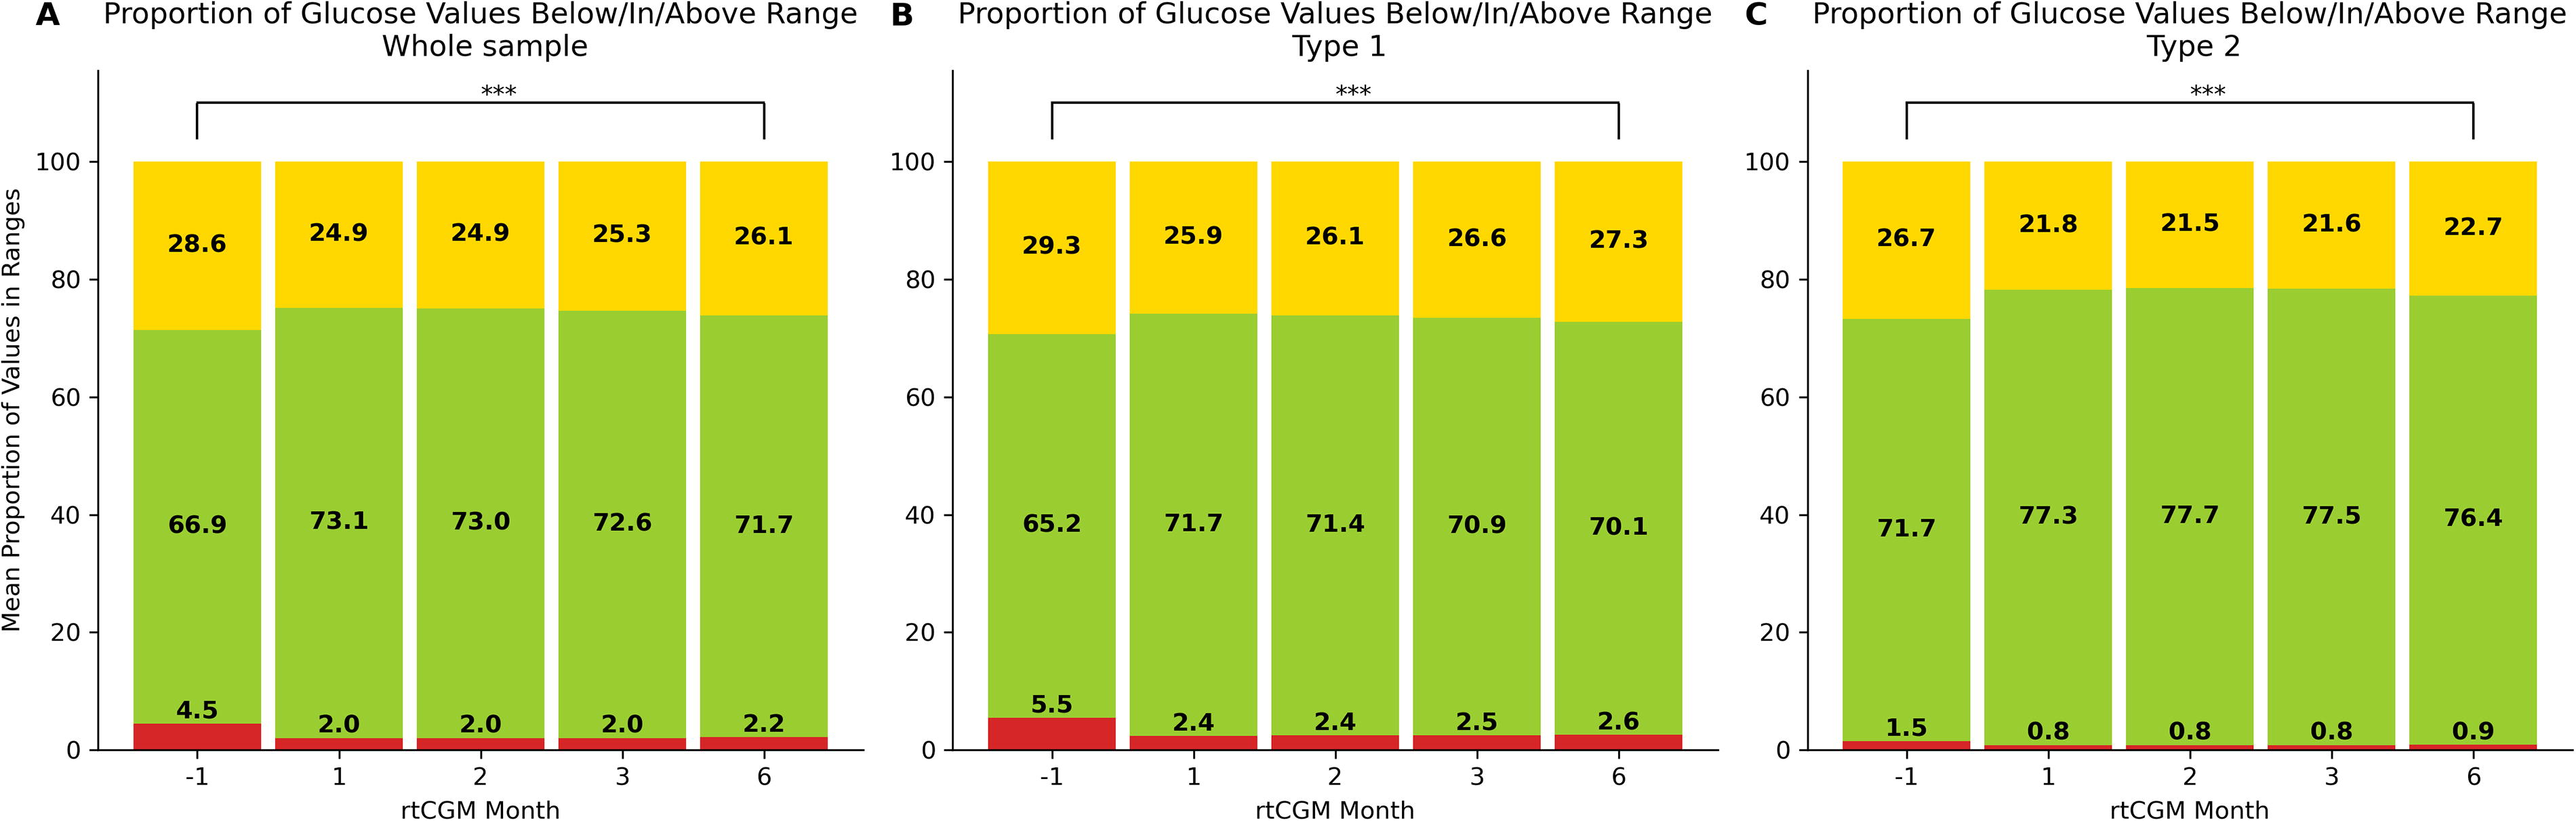
Proportions of glycemic measurements in and outside of range (70–180 mg/dL) at baseline (month −1) and months 1, 2, 3, and 6 of rtCGM use in the whole sample
Furthermore, upon transition to the sensor, the proportion of the users that achieved 70% of measurements in range increased from 48.7% to 61.5% in the first rtCGM month in the whole sample, and this proportion holds at 58.8% in the sixth month. In the Type 1 diabetes subsample, this proportion increases from 44.5% to 58.2% in the first month and decreases to 55.3% in the sixth month (pairwise comparisons between baseline and rtCGM months; all P < 0.01), while in the Type 2 diabetes subsample, the proportion changes from 60.7% to 71.1% in the first month to 69% in the sixth month (pairwise comparisons between baseline and rtCGM months; all P < 0.01).
Mixed-effects linear regression model results
Mean glucose
The model output suggests significant main effects of both the rtCGM and mySugr use onset factors, suggesting that in the overall sample (Supplementary Appendix SA1, Table S1), transitioning to a rtCGM sensor reduces the monthly mean glucose by ∼7.37 mg/dL (95% confidence interval or CI [−10.29, −4.45], P < 0.001) and the beginning of mySugr use by ∼4.94 mg/dL (95% CI [−9.35, −0.53]; P = 0.028). Importantly, transitioning to the sensor at the beginning of mySugr use contributes to an additional reduction of 4.79 mg/dL (95% CI [−7.81, −1.77]; P < 0.01). An interaction effect between diabetes type and rtCGM use onset was also observed, suggesting that the reduction in monthly mean glucose is larger in type 2 users than in type 1 users.
Coefficient of variation
On average, users who were new to mySugr had a CV of −1.76% lower than more experienced users of mySugr (95% CI [−3.52, −0.01]) in the baseline month, which was statistically significant (P = 0.048) (Supplementary Appendix SA1, Table S2). The model suggests that the main effect of transitioning to the sensor was not significant (−0.17%; P = 0.88); however, the interaction effect between diabetes type and the effect of the rtCGM sensor indicates that users with type 1 diabetes had a significant reduction of −5.14% (95% CI [−7.54, −2.74]; P < 0.001) upon transitioning to the sensor. These users also had a significantly higher CV at baseline (+10.46%; 95% CI [8.58, 12.34]; P < 0.001) than users with type 2 diabetes. Therefore, a significant reduction in the glycemic variance in the first month of rtCGM use was noted only for people with type 1 diabetes.
Proportions of glycemic measurements in range
For monthly proportions of glycemic measurements in range, the model suggests a mean improvement of 4.9% (95% CI [3.2%, 6.5%]; P < 0.01) associated with the transition to the rtCGM sensor and a 5% improvement (95% CI [2.5%, 7.4%]; P < 0.01) associated with the use of the mySugr app, with an additional 2.6% interaction effect (95% CI [0.8%, 4.3%]; P < 0.01) among those who began to use both at the same time. The nonsignificant interaction term between diabetes type and rtCGM use onset suggests that the proportion of values in range changes equally for both diabetes types.
Discussion
Numerous studies conducted across various populations have consistently shown the benefits of BG monitoring in enhancing glycemic control and reducing the risk of complications for people with both type 1 and type 2 diabetes. CGM has transformed glucose tracking by providing continuous automated updates of glucose levels. This evolution in glucose technology has ushered in other innovative devices and digital solutions, empowering people with diabetes and their health care providers to better manage the disease.
Furthermore, mHealth apps support connections with various devices, such as glucometers, smartwatches, weight scales, and insulin pumps, allowing for the fast collection and sharing of large quantities of health data. These data provide new evidence and insights from real-world data (RWD) sources that complement traditional clinical trials and epidemiological studies. While it is important to acknowledge potential confounders, such as data quality and completeness, evidence generated with RWD remains crucial for gaining short- and long-term insights into the effectiveness of medical devices at the local and global levels. RWD can inform health care professionals and policymakers about the use of a specific product in broad populations without the constraints applied in traditional clinical trials. This evidence derived from the RWD analysis may improve clinical guidelines, support regulatory decisions, and facilitate product access through financial and reimbursement discussions. Finally, the longitudinal nature of RWD offers an opportunity to examine long-term patient adherence and engagement, product or medication utilization, and specific cohorts of people who may have transitioned from one product or therapy over time.
This analysis leveraged the available rtCGM data from the sample of engaged mySugr users to take a closer look at mySugr users who transitioned from SMBG to a rtCGM and the associated effects of that transition. Glycemic control changed substantially with transition time, and differential effects were found depending on the diabetes type, baseline control, and duration of mySugr use. A regression model was used to quantify the effects of different elements on monthly glycemic metrics as well as to quantify their combined effects.
Notably, the sample of mySugr users in this analysis was already well controlled before the transition, with a mean glucose of ∼155 mg/dL (Fig. 1) and a CV of 34.4% (Fig. 3) at baseline. Nonetheless, an overall reduction in the monthly mean glucose and CV was observed, as well as a decrease in the proportion of glycemic measurements out of range in favor of values in range. These improvements are largely driven by the subsample of users whose baseline mean and CV values were high, which, depending on the exact baseline values, achieved reductions of up to 60 mg/dL in the mean glucose (Fig. 2; Supplementary Appendix SA1, Fig. S1) and up to 30% in CV (Fig. 4) in the first month of transition. Moreover, the effects were sustained over the entire observation period, with both the mean glucose and CV remaining significantly lower throughout the entire cohort, along with a sustained decrease of values below and above range, and a mean of more than 70% of values in range.
Interestingly, a smaller effect was observed in people with type 1 diabetes, where the difference in mean glucose was no longer significant at the 6-month endpoint; however, type 1 users with a high baseline (>180 mg/dL) achieved a sustained reduction throughout the observation period (Supplementary Appendix SA1, Fig. S1). These results support the evidence found in similar RWD analyses conducted in people with type 1 and type 2 diabetes. Manov and colleagues found a reduction in average glucose from 286 to 158 mg/dL in people with type 1 and type 2 diabetes transitioning from SMBG to rtCGM 43 ; however, there were limitations in the analysis due to a small sample size, potential selection bias, and short duration.
Of particular note was the opposite effect for users whose baseline was abnormally low and whose mean glucose and CV slightly increased in the first month (Fig. 2, Fig. 4), suggesting that the sensor helps these users avoid hypoglycemic events more effectively. Furthermore, differential effects of transitioning to a rtCGM sensor in individuals with type 1 and 2 diabetes were observed. People with type 1 diabetes had a relatively larger reduction in the glycemic variance, such that the mean of the type 1 subsample decreased well below 36% (often quoted as a threshold for good glycemic control 44–45 ) but had a relatively smaller reduction in mean glucose. The converse was true for people with type 2 diabetes, for whom the reduction in mean glucose was relatively larger than the reduction in the glycemic variance (Fig. 1, Fig. 3). This suggests that transitioning to a rtCGM sensor affects people with type 1 and type 2 diabetes differently. For instance, in people with type 2 diabetes, it helps to keep the overall level of glucose lower while having a smaller effect on the variability of glucose, whereas for people with type 1 diabetes, the bulk of the benefit was in decreasing glucose variability and aiding in stabilizing the oscillations in glucose, thus potentially helping them to avoid the extremes.
In summary, this work highlights how digitally enabled medical technologies, where advanced measurement methods coupled with the use of digital health solutions and platforms for tracking health data can facilitate more effective self-management of diabetes. Using digitally enabled medical technologies encourages a patient-centric approach to diabetes management while allowing for personalization based on individual patient needs and abilities. It is important to recognize that everyone is in a unique situation to manage the disease and to ensure that the right monitoring solution, whether SMBG, CGM, or any combination thereof, is available. In addition to monitoring, digital tools are becoming increasingly essential to facilitate effective diabetes management. The evolution of health care technologies continues to demonstrate additional benefits for people with diabetes and health care providers and has even transformed health care systems, resulting in economic and resource efficiency.
Limitations
Because this was a real-world data sample, it was impossible to review the data of people who had other comorbidities or had taken specific medications that could interfere with or influence glucose levels. Furthermore, these data are subject to potential bias, as they represent active users of the mySugr app aged 16 years or older rather than a broader population who may be less engaged in using diabetes tools or technologies for diabetes management. This bias is also evident in the excellent baseline glycemic control before transitioning to rtCGM. The collection of rtCGM data over 9 years delivers a lot of data; however, it may include a bias as technology use changed over this time, specifically around the use of different technologies for diabetes management. Additionally, it is essential to consider the maximum duration of the analysis to be 6 months. An extended follow-up period may further substantiate these results. Moreover, the sample size of people with type 2 diabetes was small compared with that of people with type 1 diabetes. The probable reasons for this are linked to the limited accessibility and reimbursement of rtCGM for this cohort and the testing frequencies required for SMBG to be included in the analysis. It is also important to consider the potential presence of regression to the mean in the analysis of change in glycemic values in the first month of rtCGM use as a function of baseline glycemic control (Fig. 2, Fig. 4; Supplementary Appendix SA1, Fig. S3). While it is possible that a portion of the observed change can be attributed to this statistical phenomenon, the observed effect sizes in the first month together with domain knowledge that users with different baseline glycemic control likely come from different patient distributions suggest that the impact of this is expected to be minimal.
Finally, SMBG and rtCGM are two different data sources, where rtCGM offers continuous, unbiased coverage of glucose levels, while manual measurements from SMBG carry the inherent risk of representing biased measurements conducted when the user suspects being out of range. Their distinct nature requires assessments of the validity of the comparisons, both for the aggregate measures of mean monthly BG and glycemic variance, and particularly so for the mean proportions of glycemic measurements in and out of range. Supplementary Appendix SA2 offers a supplementary analysis, concluding that including users with a minimum of 50 BG measurements in the SMBG month is sufficient to yield valid comparisons of all metrics from the two data sources.
Conclusions
This RWD analysis found an associated improvement in glycemic control, as measured by the mean monthly glucose, glycemic CV, and proportions of glycemic measurements in range, when users of the mySugr app with type 1 and type 2 diabetes transitioned from SMBG to rtCGM. In addition, using the mySugr app in conjunction with rtCGM yielded additional improvements in glycemic control, playing an essential role in diabetes management.
Footnotes
Acknowledgments
The authors thank Elizabeth Johnston-Young, an independent medical writer, for her review and refinement of the article. They thank Jörg Weissmann, MD, Brian Ulmer, MD, and Stephan Silbermann, MD, PhD, for their medical review. In addition, they thank Valerie Eichinger, MSc, and Ezgi Cinar, MSc, for the conceptual discussions, and a special thanks to Guy Bogaarts, PhD, for his statistical review and insights.
Authors’ Contributions
H.M., W.M.-H., and D.T. formulated the initial idea for the real-world data study design. J.Z. and M.M. performed the analysis, developed the linear model, designed the figures, and developed the validation analysis of comparability between SMBG and CGM measurements. D.T. and J.K. advised the refinement of the analyses and the appropriate sample choices for both the main and validation analyses. All authors wrote the article, contributed to the data interpretation, and read and critically reviewed the article.
Author Disclosure Statement
All authors declare financial competing interests and are employees of Roche at the time of writing the article. All authors declare that there are no nonfinancial competing interests.
Funding Information
This work was supported by
Supplementary Material
Supplementary Appendix SA1
Supplementary Appendix SA2
References
Supplementary Material
Please find the following supplemental material available below.
For Open Access articles published under a Creative Commons License, all supplemental material carries the same license as the article it is associated with.
For non-Open Access articles published, all supplemental material carries a non-exclusive license, and permission requests for re-use of supplemental material or any part of supplemental material shall be sent directly to the copyright owner as specified in the copyright notice associated with the article.