
Abstract
Optimizing postprandial glucose control in persons with type 1 diabetes (T1D) is challenging. We hypothesized that in free-living individuals, meal composition (high and low glycemic index [HGI and LGI], high and low fat [HF and LF]) may impact insulin requirements. Adults (N = 25) with T1D using open-loop insulin and continuous glucose monitoring were provided a meal-tagging app and prepackaged meals with defined macronutrient content. Data from 463 meals were analyzed. LGI meals required significantly more insulin than HGI meals (P = 0.01). Furthermore, the mean (±standard deviation) carbohydrate-to-insulin ratio (CIR) was significantly different overall among the LGI-LF (5.5 ± 3.4), LGI-HF (4.5 ± 3.8), HGI-LF (7.6 ± 5.1), and HGI-HF (8.7 ± 5.8) meals (P = 0.001). The risk of nocturnal hypoglycemia is associated with daytime hypoglycemia and amount of insulin administered prior to the evening and exercise. This exploratory study designed to examine the impact of different meal types on insulin dosing requirements in free-living adults with T1D emphasizes the need for individualized adjustment of the CIR depending on meal composition.
Introduction
In people with type 1 diabetes (T1D), intensive glycemic control significantly reduces microvascular and macrovascular diabetes complications. 1 However, achieving optimal postprandial glucose control in people with T1D still remains a great challenge. 2 Treatment of T1D relies on complex insulin replacement therapy to achieve glycemic goals. 3 Previous studies in controlled environment have shown that meal composition (high and low glycemic index [HGI and LGI], high fat and low fat [HF and LF]) can impact the postprandial glycemic pattern in people with T1D. 4 –6 Furthermore, it is well known that exercise can impact glycemic pattern and increase the risk of hypoglycemia. 7,8 Most of the data on glycemic pattern and their relationship with meal type or exercise have been collected in a controlled environment. 9 –13 With the exception of the T1D Exercise Initiative, 14 where detailed information on exercise was available, and for a subgroup of participants, food intake was recorded using the Remote Food Photography Method. 15 Therefore, there is a paucity of data on glycemic patterns and insulin requirements in response to different meal compositions in free-living conditions. In this exploratory study, we assessed postprandial glycemic excursion in relation to meal composition—HGI and LGI, and HF and LF—and insulin dosing along with dosing time to mitigate postprandial hyperglycemia as well as the risk of nocturnal hypoglycemia and its relationship with exercise in adults with T1D under free-living conditions.
Methods
Study design and data collection
This was an 18-week prospective, exploratory, single-arm, single-center study that enrolled adults with T1D from the Joslin Clinic in Boston, MA. Inclusion criteria were age 18–80 years, T1D for >3 years, glycated hemoglobin (HbA1c) of 6.0%–9.5%, and using continuous glucose monitor (CGM) and insulin pump therapy for at least 6 months prior to the start of the study. Exclusion criteria included dietary restrictions, pregnancy, gastric motility disorders, and the use of hybrid closed-loop systems. The protocol was approved by the Institutional Review Board of the Joslin Clinic.
The study consisted of a 2-week run-in phase followed by a 16-week data collection phase. During the run-in period, participants kept a food diary to help identify the most common meals that they had and learned how to use the fitness tracker to collect physical activity data (Whoop).
At the start of the data collection phase, participants downloaded the “meal-tagging” app and the Tidepool app on their phones. They were instructed how to use the “meal-tagging” app to record meal episodes (meal name, time, picture, and notes) and wear a fitness tracker (Whoop).
Test meals, chosen by participants among a list of prepackaged meals, included meals with HGI and LGI and HF (fat ≥30 g/meal, HF) or LF (fat ≤10 g/meal, LF) as follows: high GI, high fat [HGI-HF]; high GI, low fat [HGI-LF]; low GI, high fat [LGI-HF]; and low GI, low fat [LGI-LF]. Participants were asked to choose a combination of fat and glycemic index meals as follows: at least one LF and LGI, one LF and HGI meal, one HF and HGI, and one HF and LGI meal, and eat each of them at least three times throughout the 16-week period. Participants were asked to eat the test meals whenever it was convenient for them throughout the data collection period. Participants were instructed to document hypoglycemia (defined as a glucose level that required treatment) if it occurred 2 h prior to the test meal and to not consume the test meal if the BG prior to the test meal was ≥160 mg/dL. Participants calculated their insulin doses based on their personal carbohydrate (CHO)-to-insulin ratio (CIR). The purpose of the test meals was to evaluate the effect of the participant’s personal CIR on meals with different macronutrient contents. Participants were asked to log hypoglycemic episodes and the treatment required, if the episode occurred 2 h prior to or following one of the test meals. Meal, CGM, and insulin dosing data were reviewed weekly by the study team and investigator. Dose optimization as dose and timing of insulin delivery (bolus versus extended bolus) recommendations based on the postmeal glucose pattern observed at the specific meal were provided to participants. The impact of new insulin recommendations on a glycemic excursion for a specific meal was reviewed, and new insulin recommendations were generated to improve the glycemic excursion and the meal was repeated at least three times. Insulin dosing and timing were communicated to the participant via phone call as deemed appropriate by the physician.
Data Analysis
Insulin data were downloaded from the Tidepool database. The dose and distribution of insulin bolus taken around test meals were also analyzed. The time window to capture the dose around meals was from 2 h prior to meal consumption to 6 h postmeal consumption or 2 h prior to the next meal, whichever was first. In addition, to check the dosing time and dose size (in units) time, the mean cumulative size of the bolus doses taken around meals was also estimated.
Exercise time and intensity were measured based on accelerometer data (from the Whoop sensors). Data were summarized based on exercise intensity, meals, bolus dosing, and basal rate according to the following time frames: morning: 5 AM up to 12 PM
Statistical analysis
The generalized estimating equation approach was applied to account for the correlation between repeated observations from each subject by using an R package geepack. 16 Different cluster weights based on the number of observations of each subject were applied to ensure all subjects had equal weights in the estimating equation. Multiple imputations using chained equations were applied by using R package mice 17 for missing observations, analyses were performed on 10 imputed datasets, and estimates were pooled by Rubin’s rules. Variable selection by univariate screening was performed, and joint models were developed based on the screening results. Hypothesis tests were performed for the difference in the mean cumulative dose sizes per gram of CHO between the LGI and HGI meals by two-sample pseudoscore tests 18 with linear weights using R package reda. 19 Baseline characteristics were calculated and presented as summary statistics. The postprandial glycemic metric index meals were estimated as follows and are presented as the mean (standard deviation [SD]): LGI and HGI meals had 16–56 g and 15–70 g of CHO, respectively, and were identified as LGI or HGI by study dietician; LF and HF meals had 2–10 g and 30–82 g of fat, respectively; postprandial time-in-range (TIR) was estimated in 6 h from meal to 1 h prior to the next meal; postprandial hyperglycemic area under the curve (AUC) was estimated by AUC per 5 min; P value was estimated by using Kruskal–Wallis rank sum test. CIR, TIR, and time above range (TAR) in response to different types of meals were calculated by descriptive statistics and presented as a box plot; the mean cumulative dose size of bolus doses taken was calculated and presented as a line graph showing the mean cumulative dose size across time points (from 2 h prior to 6 h post meal, depending on meal composition) adjusted by the CHO content of the meal (unit of insulin per gram of CHO; U/g).
Results
Study participants
In total, 25 adults with T1D [age, mean (SD) 53.1 (15.4) years, HbA1c (mean ± SD) 7.1 ± 0.7%; 40% female] using an insulin pump and CGM were enrolled. The baseline characteristics are presented in Supplementary Table S1.
Mealtime insulin dosing
All participants provided insulin pump, CGM data, and “meal-tag” data from 463 meals eaten in free-living conditions.
As shown in Table 1, each test meal was consumed at least 4.5 times during the study period. Premeal glucose average (mean ± SD) was similar among meals (LGI: LF = 124 ± 21 mg/dL, HF = 124 ± 25 mg/dL, P = 0.81; HGI: LF = 127 ± 24 mg/dL, HF = 125 ± 21 mg/dL, P = 0.97). LGI meals required significantly more insulin than HGI meals, reflected by the lower CIR (P = 0.01) (Table 1).
Postprandial Glycemic Metrics for Low and High Glycemic Index Meals in Participants with T1D in Free-Living Situation
Data are mean ± SD and range.
Low GI meals had 16–56 g of CHO and were identified as low GI by the study dietician.
High GI meals had 15–70 g of CHO and were identified as high GI by study dietician.
Low fat meals had 2–10 g of fat.
High fat meals had 30–82 g of fat.
In 6 h from meal to 1 h prior to the next meal.
Hyperglycemic area under the curve in every 5 min.
By using the Kruskal–Wallis rank sum test.
LGI meals required significantly more insulin than HGI meals.
CHO-to-insulin ratio was significantly different overall among the LGI-LF, LGI-HF, HGI-LF, and HGI-HF meals.
AUC, area under the curve; CHO, carbohydrate; GI, glycemic index; HF, high fat; n, number of patients in each category; SD, standard deviation; TIR, time in range.
For LGI-HF, significantly more insulin per gram of CHO was used (mean CIR = 4.5 for LGI-HF vs. 8.7 for HGI-HF, vs. 7.6 for HGI-LF, and vs. 5.5 for LGI-LF; P = 0.02) compared with other meal types (Fig. 1). Postprandial TIR (defined as 6 h from the meal to 1 hour prior to the next meal) was >70% for all test meal types and did not differ among test meal types (P = 0.72). The TAR (>180 mg/dL) was similar for all meal types (P > 0.05 for both).
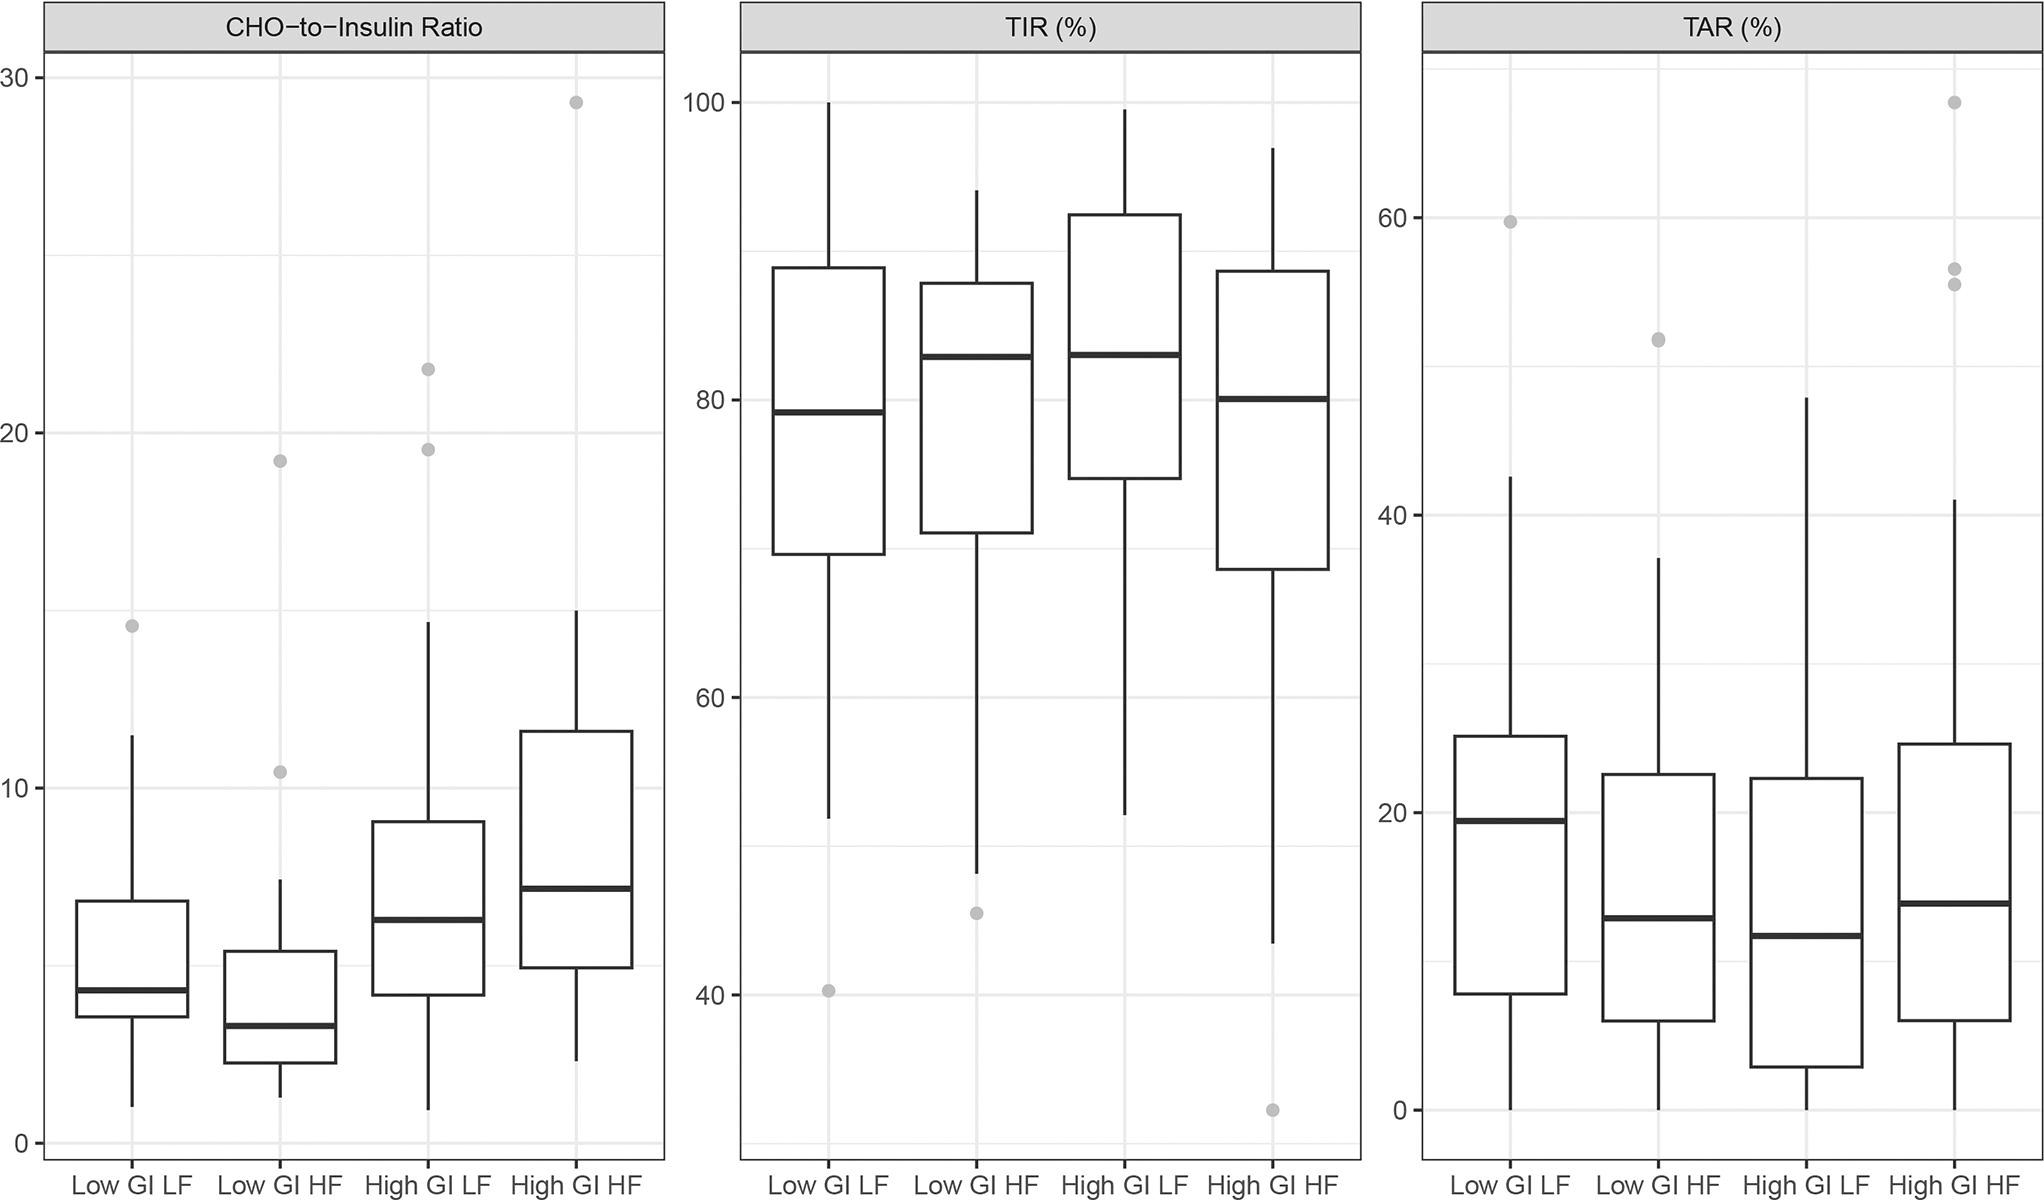
Carbohydrate-insulin ratio, TIR, and TAR in response to different types of meals in participants with T1D in free-living situation. CHO, carbohydrate; GI, glycemic index; HF, high fat; LF, low fat; TAR, time above range; TIR, time in range; T1D, type 1 diabetes.
Dose distribution around meals
The distribution of insulin dosing time corrected by CHO content from meal consumption is presented in Supplementary Figure S1A, which reveals a bimodal pattern. Most insulin doses were taken around the meal consumption time (i.e., time 0). We estimated the mean cumulative insulin dosing units per gram of CHO using the Nelson–Aalen estimator, which takes into account the insulin dosing distribution over time and provides an estimation of the mean cumulative size of the insulin dose size per gram of CHO. The insulin dosing distribution showed, for HGI meals compared with LGI meals, a small difference between the insulin dose units per CHO 2 h prior to the meal consumption and greater insulin dose units per CHO over the 6 h postmeals (Supplementary Fig. S2). The estimation of the mean cumulative size of insulin doses taken peri-mealtime showed a greater amount of insulin per CHO (approximately 0.13 units of bolus per gram) was taken within 30 min around LGI-HF meals compared with 0.11 units of bolus per gram within 30 min for LGI-LF and HGI-HF and 0.9 units of bolus within 30 min for HGI-LF, respectively. The cumulative dose sizes per gram of CHO for LGI and HGI meals and LF and HF meals are presented in Supplementary Figure S1 (panel A presents the overall comparison of mean cumulative dose size per CHO across all meal types). For the HF meals, more dose units were given for LGI meals compared with HGI meals (P = 0.002).
For the LGI meals, the difference in dose units per CHO given for the LF meals compared with the HF meals was insignificant (P = 0.44). Similarly, for the HGI meals, the dose units per CHO given for the HF meals did not differ significantly (P = 0.98). Furthermore, for the LF meals, there was not much difference between the dose units given for LGI and HGI meals (P = 0.07).
Nocturnal hypoglycemia and exercise
The chance of experiencing subsequent nocturnal hypoglycemia was significantly greater when the participant experienced daytime hypoglycemia (P = 0.002) and was positively associated with more insulin bolus units taken between 9 PM and 12 AM (P = 0.022). Moreover, among those participants who experienced hypoglycemia during the preceding day from 5 AM to 6 PM, the chance of experiencing subsequent nocturnal hypoglycemia was significantly greater in those participants who did more exercise (with MET at least 1.5) in the evening from 6 PM to 12 AM (P = 0.044).
Discussion
This exploratory study was designed to examine the impact of meal composition on insulin dosing requirements in free-living individuals with T1D. The study results showed that higher-fat meals containing lower GI CHO require more insulin coverage than higher-fat meals containing high GI CHO, despite similar CHO content. Moreover, we also observed that the risk for overnight hypoglycemia increased with the presence of hypoglycemia during the preceding day, exercising in the evening, and a larger amount of insulin bolus taken at dinner time. Overall, these findings highlight the complexity of maintaining euglycemia throughout 24 h in persons with T1D while considering meal composition, mealtime insulin dosing and distribution, and time of exercise.
Previously, carefully designed controlled trials have provided evidence that identical CHO content, but different fat content, requires markedly different insulin coverage. 5,20 A study, conducted under controlled condition, reported that, in persons with T1D, a high dose of fat (50 g) meal caused significant hyperglycemia over 5 h, despite the administration of additional insulin using a closed-loop glucose control system. 20 Furthermore, when fat was added to the same CHO-content meal, the amount of insulin required (calculated by an adaptive model-predictive insulin bolus) was more than double and needed to be given over several hours to achieve similar postprandial glycemia than CHO meal alone. 21 Our study adds additional insights to these previously reported research findings on meal content and postprandial glucose control. 5 Our study provides detailed information on the impact of dietary fat including CHO type and exercise activity on postprandial glucose control and insulin requirements in persons with T1D in free-living conditions.
These findings highlight the limitations of the current clinical CHO-based approach to mealtime bolus calculation and the complexity of insulin dosing based on meal composition. The data provide new insights about insulin dosing for higher-fat meals and indicate that the dose administered to cover meals with higher-fat content needs to be adjusted depending on the CHO type (LGI vs. HGI). Whereas higher-fat meals with more complex, slowly absorbed CHOs will require more insulin than the calculated CHO-based dose, these real-world data indicate that this is not the case with higher-fat meals containing simpler CHOs. Furthermore, we analyzed the impact of exercise and insulin bolus on glucose pattern and the risk of hypoglycemia. The results showed significantly higher chances of nocturnal hypoglycemia occurrence in those who took a larger insulin bolus at night (9 PM to 12 AM) and in those who had experienced hypoglycemia during the preceding day. Moreover, the chances of an episode of nocturnal hypoglycemia significantly increased with the intensity of exercise performed in the evening. These findings are consistent with the data from the T1DEXI study, where a large cohort of persons with T1D were assigned to different types of exercise at home. 14 Also, another study reported that the presence of diurnal hypoglycemia with prior 24-h exercise and higher insulin administration prior to exercise increased the risk of hypoglycemia. 22 Further, the T1DEXI reported a significant increase in time below range (<70 mg/dL) on exercise days compared with sedentary days, along with an increase in hypoglycemic event rates, similar to the data reported in our study. 14
The novelty of this study is the collection of data from a meal-tagging app, fitness tracker, study participant’s insulin pump and CGM, and detailed meal information from prepackaged food in free-living conditions. The findings from this study show the complexity of mealtime insulin dosing and timing and the complexity faced by a person with T1D on a daily basis to balance meal composition, insulin dosing, and insulin distribution and exercise over time to maintain euglycemia while avoiding hypoglycemia.
The limitations of this study include a small sample size with a mostly homogeneous white population from the northeast US, with all participants using sensor-augmented insulin pumps but not automated insulin delivery system, which may limit the generalizability of the results.
Conclusions
In conclusion, this study highlights the practical complexity of the mealtime insulin bolus in persons with T1D and emphasizes the need for individualized adjustment of the CIR depending on meal composition. The data from this study provide the foundation for improved clinical guidance to persons with T1D about insulin dosing in the context of meal composition, and the development of improved automated insulin delivery dosing algorithms to reflect different amounts and distributions of insulin based on meal content and glucose pattern.
Footnotes
Acknowledgments
The authors thank Deepika Kajarekar from Syneos Health for medical writing support and Karan Kotecha for editorial support. This support was funded by Eli Lilly and Company.
Authors’ Contributions
All authors have made substantial contributions to all of the following: (1) the conception and design of the study, or acquisition of data, or analysis and interpretation of data, (2) drafting the article or revising it critically for important intellectual content, and (3) final approval of the version to be submitted. All authors contributed equally.
Author Disclosure Statement
E.T. has received funding for the current study from
Funding Information
The study was funded by
Supplementary Material
Supplementary Figure S1
Supplementary Figure S2
Supplementary Table S1
References
Supplementary Material
Please find the following supplemental material available below.
For Open Access articles published under a Creative Commons License, all supplemental material carries the same license as the article it is associated with.
For non-Open Access articles published, all supplemental material carries a non-exclusive license, and permission requests for re-use of supplemental material or any part of supplemental material shall be sent directly to the copyright owner as specified in the copyright notice associated with the article.