
Abstract
Background
: Connected insulin pens capture data on insulin dosing/timing and can integrate with continuous glucose monitoring (CGM) devices with essential insulin and glucose metrics combined into a single platform. Standardization of connected insulin pen reports is desirable to enhance clinical utility with a single report.
Methods
: An international expert panel was convened to develop a standardized connected insulin pen report incorporating insulin and glucose metrics into a single report containing clinically useful information. An extensive literature review and identification of examples of current connected insulin pen reports were performed serving as the basis for creation of a draft of a standardized connected insulin pen report. The expert panel participated in three virtual standardization meetings and online surveys.
Results
: The Ambulatory Glucose Profile (AGP) Report: Connected Insulin Pen brings all clinically relevant CGM-derived glucose and connected insulin pen metrics into a single simplified two-page report. The first page contains the time in ranges bar, summary of key insulin and glucose metrics, the AGP curve, and detailed basal (long-acting) insulin assessment. The second page contains the bolus (mealtime and correction) insulin assessment periods with information on meal timing, insulin-to-carbohydrate ratio, average bolus insulin dose, and number of days with bolus doses recorded. The report’s second page contains daily glucose profiles with an overlay of the timing and amount of basal and bolus insulin administered.
Conclusion
: The AGP Report: Connected Insulin Pen is a standardized clinically useful report that should be considered by companies developing connected pen technology as part of their system reporting/output.
Introduction and Background
Diabetes technology, including continuous glucose monitoring (CGM), insulin pumps, and automated insulin delivery devices, has transformed diabetes management over the past decade, leading to improved health for people with diabetes. 1,2 Insulin therapy remains essential for the management of type 1 diabetes and for approximately 25% of individuals with type 2 diabetes. 3 Approximately 60% of people with diabetes 12 to 26 years of age in the United States use insulin pump technology, and 35% of those with type 1 diabetes in the United States use automated insulin delivery systems as part of their diabetes management plan. 4,5 However, this means that many people with type 1 diabetes, and most people with type 2 diabetes treated with insulin, continue to use insulin injections as the foundation of their diabetes management plan. Consistency with insulin therapy remains challenging for many people with diabetes because of socioeconomic factors, treatment complexity, and fear of hypoglycemia. 6 A recent systematic literature review demonstrated that missed or mistimed insulin doses are common in people with diabetes, preventing optimal glycemic management. 7 Most people treated with multiple daily injections are not able to achieve glucose levels required to minimize risk of complications. A key factor is missed or delayed injections which can be difficult to identify when viewing just glucose data alone.
Connected insulin pens and pen caps have been developed to support consistent insulin therapy by providing clinically useful insulin metrics. 8 –12 Sometimes referred to as insulin smart pens, these devices use Bluetooth® or near field communication technology to connect the insulin pen or pen cap to a smart phone app or website to capture information on dose timing, amount, and how the dose was calculated. A roadmap characterizing specific features has been proposed. 13 Depending on the system, the pen or pen cap may connect to apps that display insulin doses and may additionally include a dose calculator, dose reminders, missed dose alerts, and information on insulin status (e.g., units of active insulin, units remaining, temperature, etc.). More advanced dose calculators that recommend an insulin dose based on current glucose level and amount of entered carbohydrate to be consumed (or an estimate in the size of meal) along with an individualized programmable insulin correction factor are being developed. For example, in the Ambulatory Glucose Profile (AGP) Report: Connected Insulin Pen shown in Figure 1 at breakfast the calculated dose would be 1 unit of insulin per 7 g carbohydrate with an additional 1 unit of insulin for each 50 mg/dL above the glucose target of 100 mg/dL. Since the dose calculations may differ over the 24-h period, this novel feature demonstrates the value of incorporating dose calculators in the connected pen system. This technology thereby allows use of some of the advanced features that are otherwise available only in modern insulin pumps. Connected insulin pen technology has the potential to improve management for people with type 1 diabetes who rely on multiple daily injections of insulin to manage their diabetes and do not pursue insulin pump therapy. 14 The technology may also benefit people with type 2 diabetes who are transitioning from basal-only insulin to basal/bolus or multiple daily injection regimens. Most connected insulin pens are integrated with CGM to combine both insulin doses and glucose data in one display. Connected insulin pens hold the potential to improve insulin therapy by optimizing dose administration and titration while enhancing insulin safety by reducing hypoglycemia. 15,16 Review of current literature consistently shows high usability and preference by individuals with diabetes, yet there is a need for more data demonstrating clinical effectiveness in practice. 17 Overall, the use of connected insulin pens will likely benefit individuals who are challenged by missed or mistimed insulin administration and those who need guidance for dose calculations with a preference to have insulin and glucose metrics integrated into a single platform.
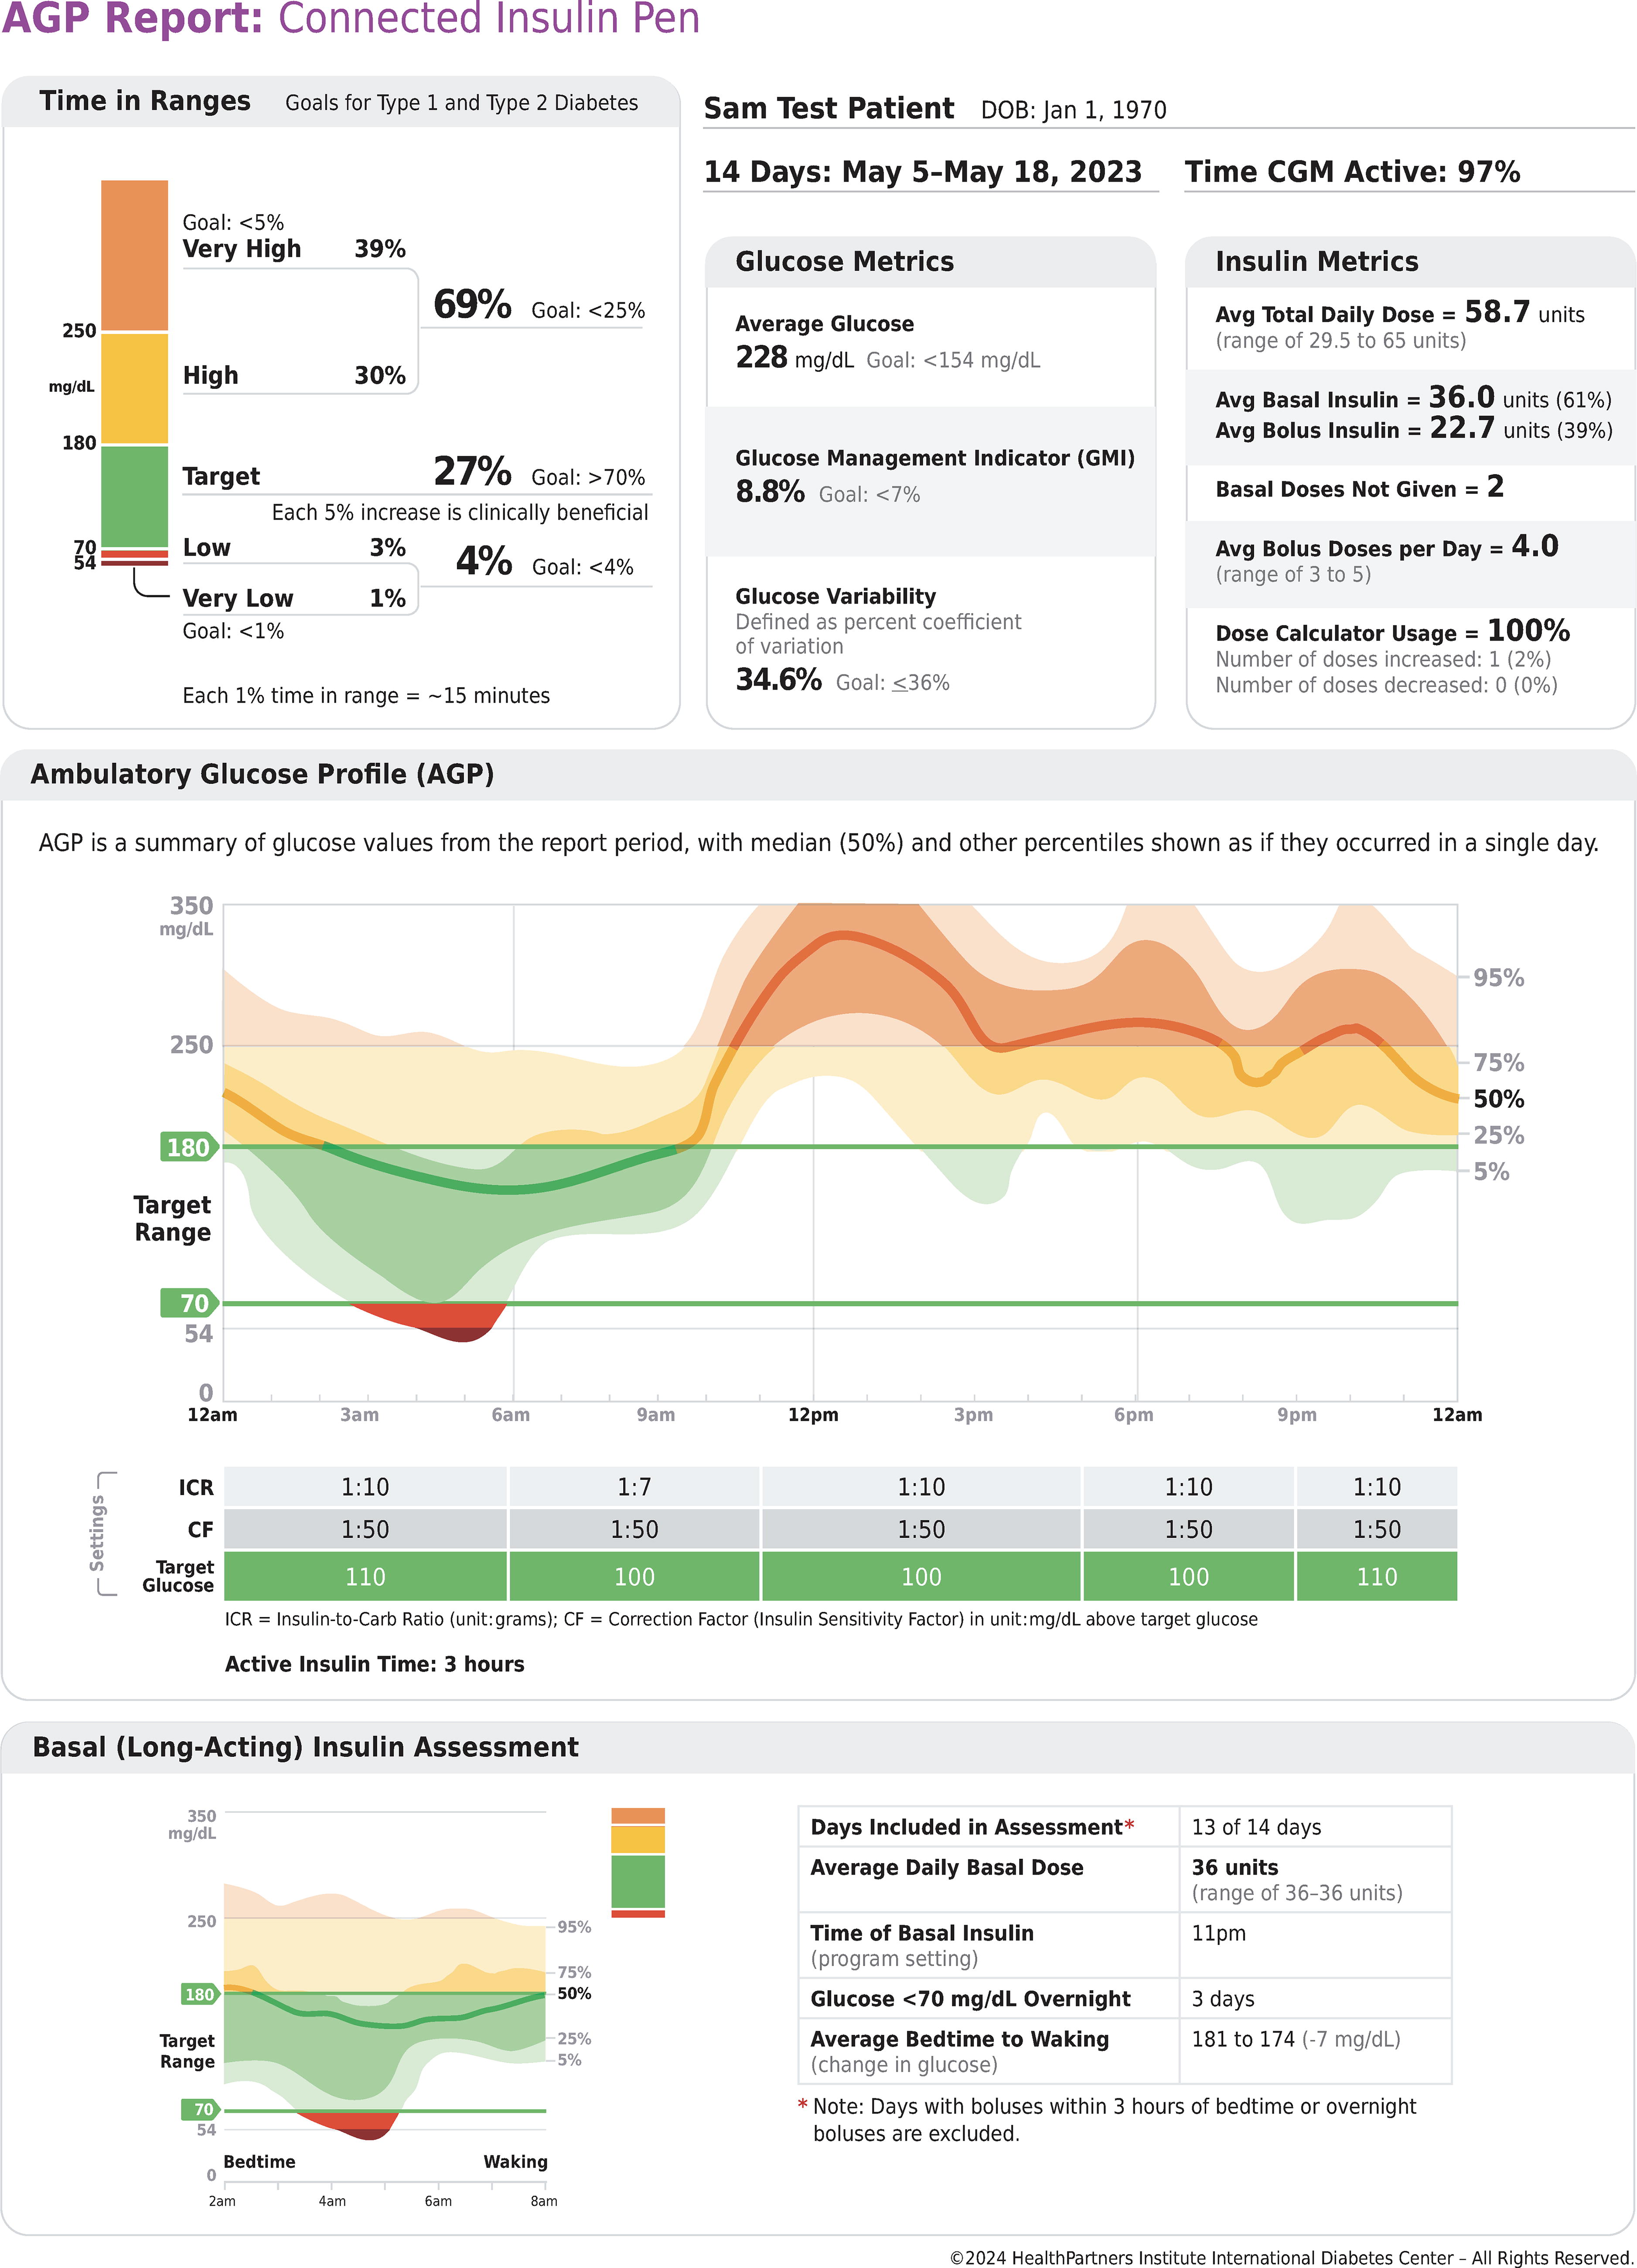
AGP Report: Connected Insulin Pen, First Page. AGP, ambulatory glucose profile.
Although CGM has been approved for 25 years in the United States, the first independent expert panel met to begin the process of standardizing the CGM metrics and a one-page display of core CGM data in 2012, when the Helmsley Charitable Trust supported the International Diabetes Center to host a working session to build on the ambulatory glucose profile originally proposed by Mazze and Rodbard et al. for self-monitored blood glucose data. 18 The result of the expert panel was the formulation of an Ambulatory Glucose Profile (AGP) Report as a standardized means to display continuous glucose monitoring in a clinically meaningful way suggested for global adoption, including by manufacturers of CGM systems. 19,20 The AGP Report has been accepted by the International Consensus Committee on Time in Range, 21 International Consensus on Clinical Targets for CGM, 22 and the American Diabetes Association (ADA) Standards of Care in Diabetes as a standardized method to represent CGM data. 23 Further enhancements of the AGP have been proposed. 24 An AGP Report for blood glucose monitoring data has also been recently developed. 25 With emerging connected pen technology being implemented by several manufacturers, there is a growing rationale and need for the development of a standardized AGP report for connected insulin pens.
Several connected insulin pens currently are approved by the U.S. Food and Drug Administration and others are in development. 11 These insulin delivery systems will likely generate different reports. Because of this, there has been a call for standardizing these reports. 26,27 Standardization of the connected insulin pen reports and automated insulin delivery reports should enhance clinical utility, allowing both clinicians and people with diabetes to learn how to interpret one report versus deciphering many different reports. This will be especially important as these technologies move into primary care, with primary care eager to adopt them. 28 –30 Standardization will also allow a uniform way to directly compare connected insulin pen performance and impact on glucose management and standardized insulin metrics. The AGP Report: Connected Insulin Pen displays CGM metrics combined with insulin metrics. This allows clinicians and the person with diabetes to be able to quickly ascertain how the current basal and bolus insulin regimen is impacting CGM glucose metrics in a commonly accepted and familiar AGP report format. This article describes the expert panel process used to create the AGP Report: Connected Insulin Pen and its key features.
Methods
The process started with the Helmsley Charitable Trust supporting the International Diabetes Center, HealthPartners Institute to facilitate an expert panel to create a standardized AGP Report for Connected Insulin Pens. The core team included an international panel of 16 diabetes technology experts representing a diverse cross section of backgrounds and areas of expertise along with several International Diabetes Center medical directors, researchers, and diabetes care and education specialists. The expert panel includes 10 adult endocrinology physicians, 3 pediatric endocrinology physicians, 3 primary care physicians, 2 certified diabetes care and education specialists, 2 diabetes researchers, 1 pharmacist, and 1 advanced practice clinician. The Internatinal Diabetes Center staff conducted a literature review and identification of examples of current connected insulin pen reports and suggestions for elements to include in a standardized report. A draft version of the AGP Report: Connected Insulin Pen was developed to serve as the starting point for further refinement by the entire standardization team. This was followed by a series of three virtual standardization meetings approximately 90 min in length and facilitated by International Diabetes Center staff. Between each of the three standardization meetings, an updated version of the connected insulin pen was sent to the expert panel standardization team along with a detailed survey asking for input on report features such as essential glucose and insulin metrics, how to best organize the report, terminology, and what are the essential elements and icons to include on daily profiles. Results of the surveys were tabulated and used to foster discussion at the next team meeting. This process maximized input from all members of the team and allowed for extensive consensus building in the iterative development process.
Results
The AGP Report: Connected Insulin Pen brings together all the clinically relevant CGM-derived glucose and connected pen insulin metrics into a single simplified two-page report. The first page of the report is shown in Figure 1. The upper left corner of the first page contains the time in ranges bar with the internationally recognized goals for each range and is consistent with the AGP Report: CGM. 21 –23 Since each 1% of glucose values represents approximately 15 min per day, this conversion is included at the bottom of the time in ranges bar for those that like to discuss current glucose management using average minutes per day instead of percentage of glucose values. It is also noted that each 5% increase in the time in target range is clinically beneficial and serves as an aspirational message for those individuals that may not achieve the goal of greater than 70% time in range. 22,31
The upper right corner contains a summary of the number of days represented in the report, dates, and the percentage of time the CGM sensor is active. Below this is the glucose metrics section containing the clinically useful average glucose, glucose management indicator, and glucose variability defined by the percent coefficient of variation. 32 Insulin metrics derived from the connected pen are indicated on the far-right part of the upper panel. Although many insulin metrics could be listed, the standardization team felt that the most clinically useful include average total daily insulin dose and range and separate average daily doses of basal and bolus insulin, along with their percentages of the total daily dose. The number of basal doses not given during the report period is a unique feature that was included to provide at a quick glance the consistency for the basal insulin regimen. The average bolus doses per day is included along with the range in daily bolus doses. The bottom of the insulin metric table contains information on the percentage of time the dose calculator is used. The recommended dose generated by the bolus calculator is based on the individualized insulin-to-carbohydrate ratio programmed into the pen. The user may elect to increase or decrease the recommended dose, and information on such adjustments (overrides) is listed at the very bottom of the table.
The middle section of the report contains the Ambulatory Glucose Profile curve that is similar to what is shown for the well-established AGP Report for CGM. 23 Note that the shading colors used in the curve coincide with the colors used in the time in ranges bar, with red showing periods below range, green indicating time in range, and yellow/orange denoting times above range. The median line is shown by a thick line that changes color depending on if it is below, above, or in target range. The interquartile range (25th to 75th percentile) is indicated by the darker shaded areas above and below the median line that changes color based on the glucose values at that time of day. The 5th to 95th percentile is shown by the lighter shaded areas above and below the interquartile range.
In the middle section positioned just below the standardized AGP curve is a table containing key connected insulin pen settings in use by time of day. The first setting is the insulin-to-carbohydrate ratio (ICR), representing how many grams of carbohydrate are covered for each unit of bolus insulin administered. In the example shown in Figure 1 the ICR is 1 unit of bolus insulin for every 10 g of carbohydrate, with the exception between 6:00 AM and 11:00 AM when the ratio is set to 1 unit of bolus insulin for every 7 g of carbohydrate. The second setting is the correction factor (CF), or insulin sensitivity factor, that is used to calculate the amount of additional bolus insulin needed to lower the user’s glucose concentration into a prespecified target glucose, which is the third setting and is shown on the bottom of the table. In this example one additional unit of bolus insulin is programmed to be administered for every 50 mg/dL glucose above the target glucose shown on the bottom green row. Many of the connected insulin pen systems allow the CF and target glucose to be modified for different times of the day and that is reflected in the table.
The bottom section of the report’s first page contains an assessment of the basal, or long-acting, insulin. The section of the AGP curve reflecting the typical bedtime and waking time that is programmed into the connected pen app is shown in the lower left panel. A small thumbnail of the time in ranges bar is included just to the upper right of the overnight AGP curve to provide a quick assessment of overall glycemia during the basal insulin assessment period. To the right of the overnight AGP curve, a table shows how many days are included in the basal insulin assessment. To avoid the impact of bolus insulin on the assessment of the basal insulin, boluses administered within 3 h of bedtime or overnight are excluded. The average units of basal insulin administered each day is shown along with the range and the programmed time of the basal insulin dose. In this example the individual has administered a very consistent 36 units of basal insulin each day during the reporting period. The table also indicates times when the sensor glucose drops below 70 mg/dL during the bedtime to waking period to highlight how many nights the individual is experiencing overnight hypoglycemia. The bottom of the basal insulin assessment table lists the average change in bedtime to waking glucose or what is sometimes called the BeAM value (difference between
The second page of the report is shown in Figure 2. At the top of the page, the three bolus, or mealtime, insulin assessment periods are shown separately and display pertinent information on meal timing, ICR, and average bolus insulin dose. This way of displaying the mealtime glucose and insulin assessment periods shares some features of previous reporting. 35 Small thumbnails of the time in ranges bar are provided for each bolus assessment period to allow swift assessment of glucose management during mealtimes. CGM data starting 1 h before the meal is included to provide glucose trend information prior to the meal and then extend out to 4 h after each meal. Below the AGP curve the number of days with bolus doses recorded during that mealtime are indicated along with information on the number of delayed bolus doses.
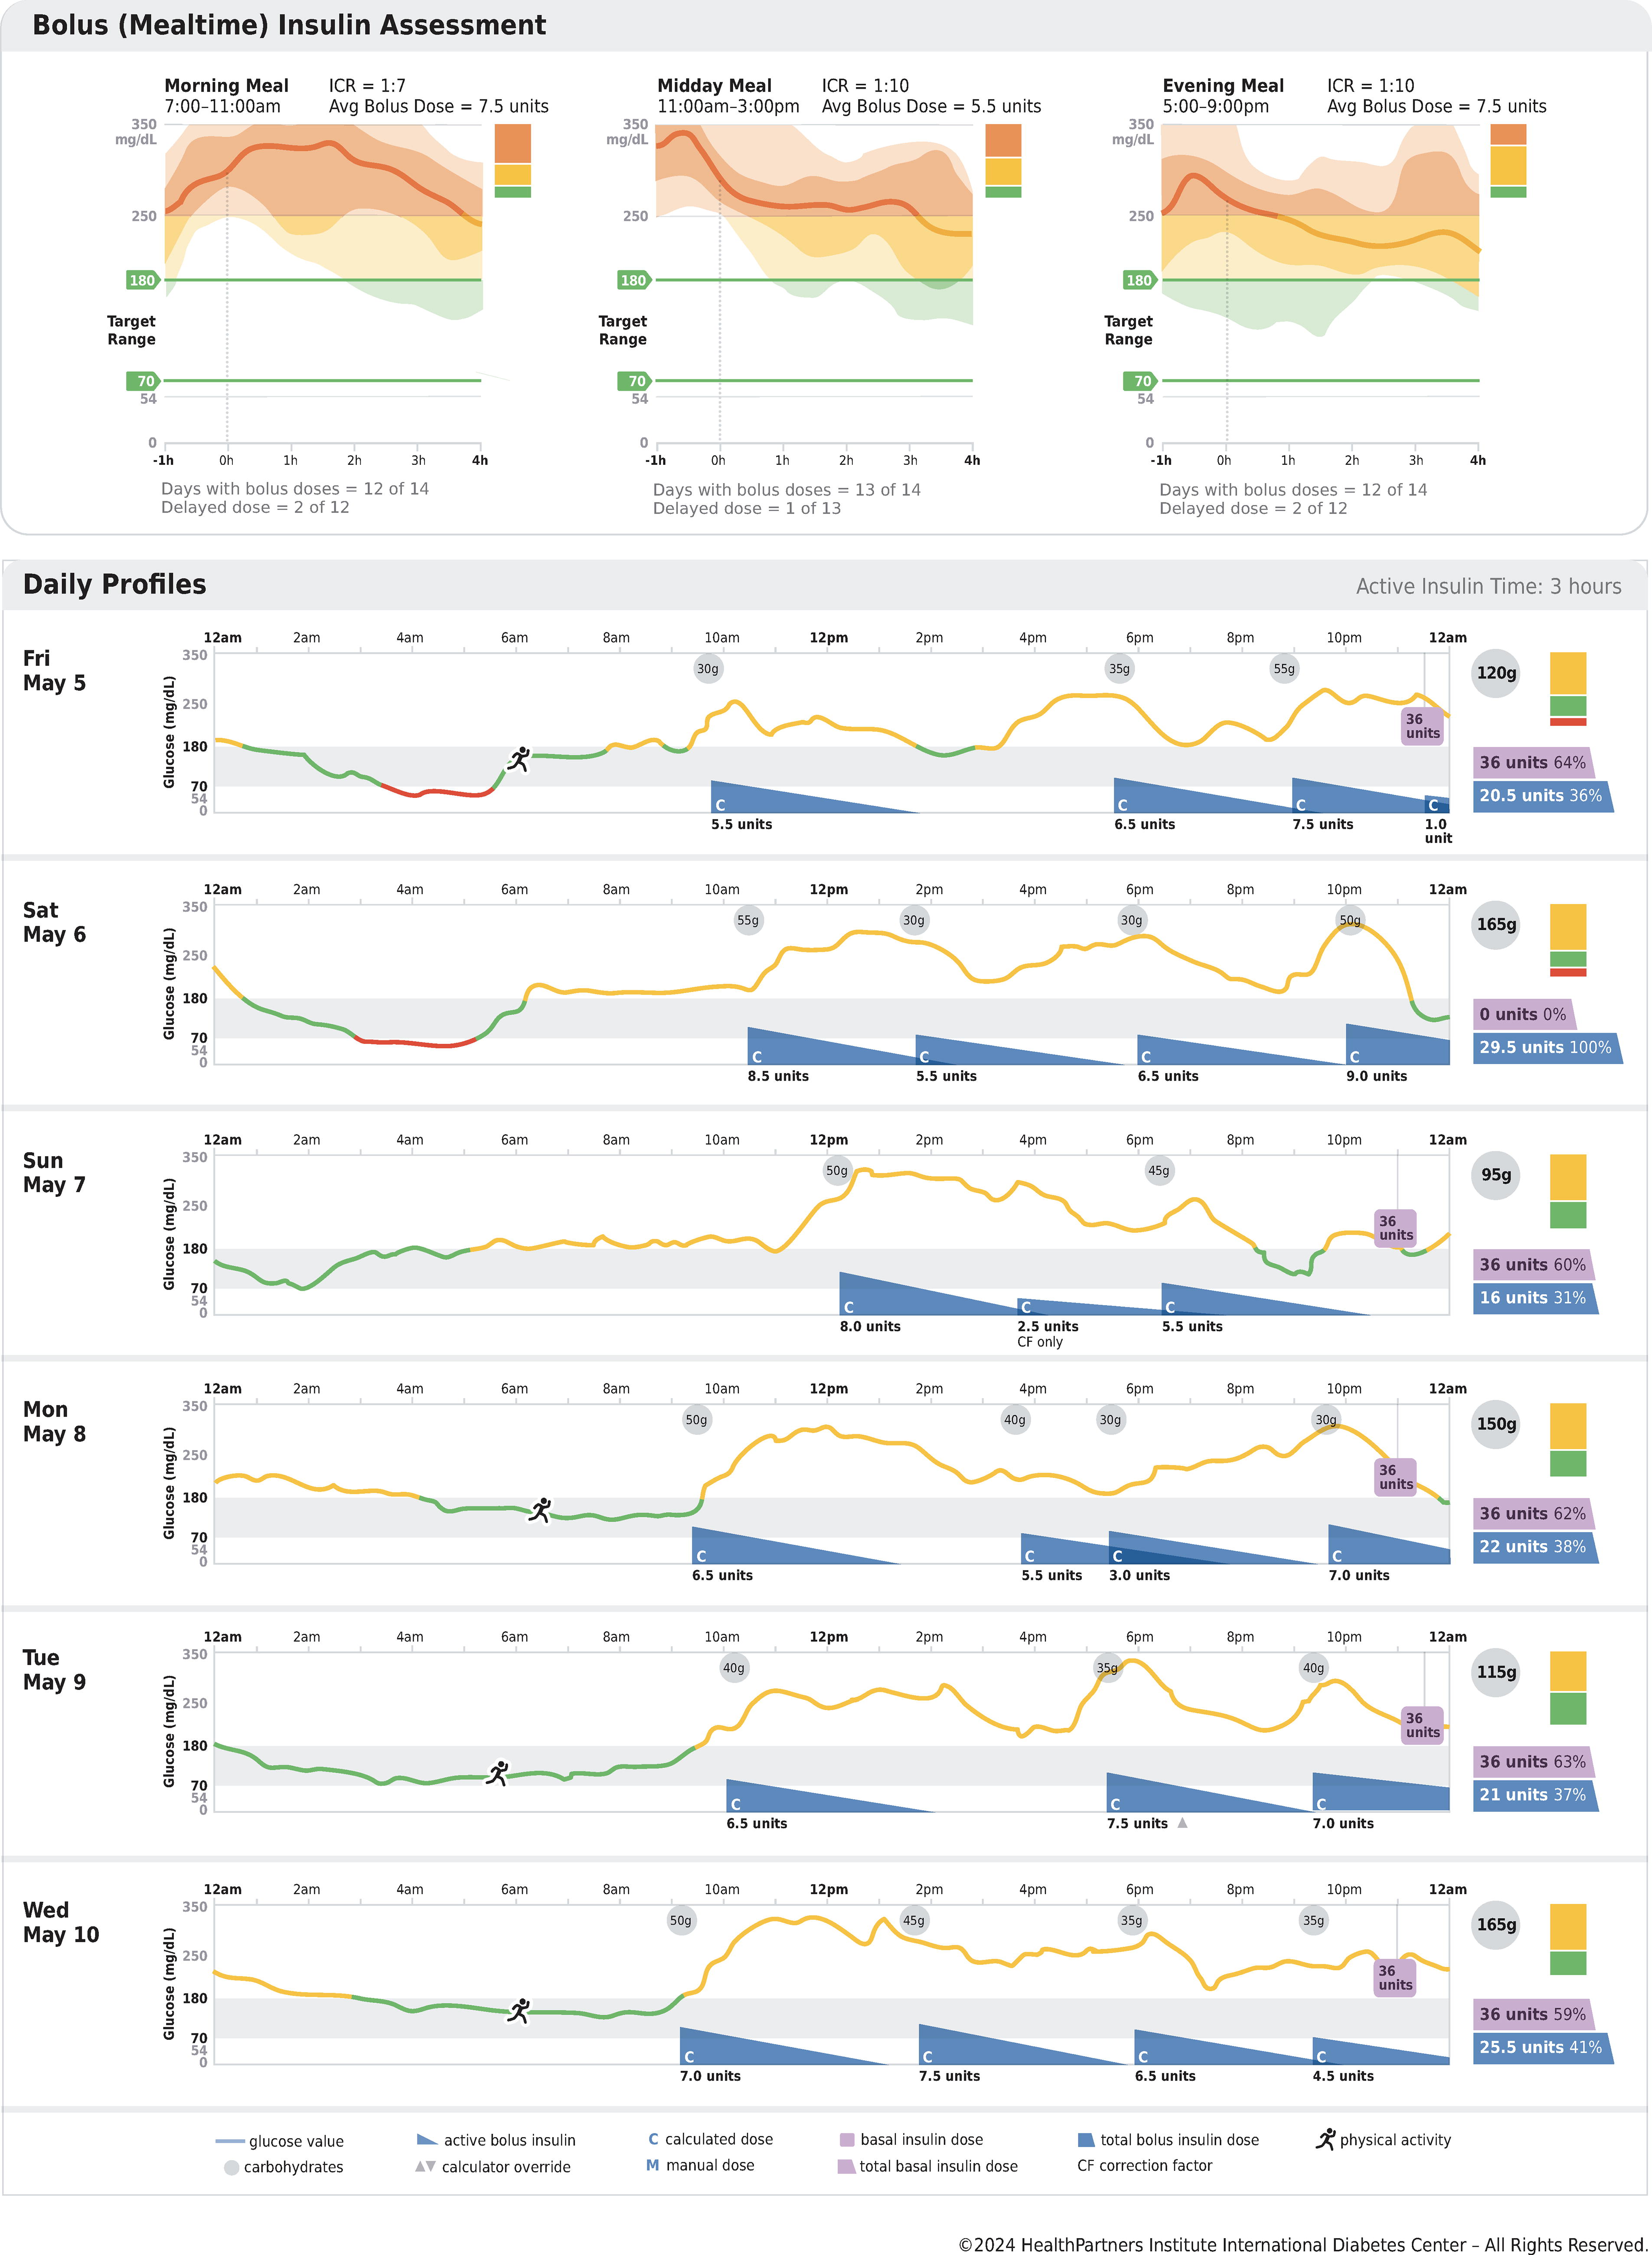
AGP Report: Connected Insulin Pen, Second Page. AGP, ambulatory glucose profile.
The majority of the report’s second page highlights six detailed daily profiles, starting with the first day of the reporting period. Additional daily profiles would be included on a third page (not shown). The time in range of 70 to 180 mg/dL is shown by the faint gray bar, and the actual glucose level throughout the day is shown by a solid line that changes color from green to red or orange whether the glucose is in range, below range, or above range, respectively. The grams of carbohydrate entered for each meal (or snack) that drives the dose calculator is shown in the small gray shaded circles with the total daily grams listed on the right in a larger gray circle. Purple color is used to highlight information on basal insulin. For example, the small purple box above the gray time in range bar shows the time and units of basal insulin administered. Blue color is used to highlight information on bolus insulin. The timing and amount of the bolus insulin doses are shown with blue sails providing a visual assessment of the approximate amount of bolus insulin remaining (insulin on board) that is individualized according to the insulin action time selected by the user. This visualization allows potential areas to watch for insulin “stacking” or overlapped bolus doses (see daily profile on Monday May 8th at 6 PM, for example). The potential for insulin stacking depends on active insulin time that varies between the different systems and may or may not align with the actual pharmacokinetics/pharmacodynamics of bolus insulin. A small “C” in the lower left corner of the blue sail indicates that the bolus dose calculator was used. A small up or down arrowhead after the units of bolus insulin administered indicates if the bolus calculator was overridden (increased or decreased, respectively), allowing for a quick assessment of how often the individual overrides the bolus calculator at breakfast, midday, or evening meal. An example is shown for the bolus dose on Tuesday May 9th at 5:30 PM. The far right of each daily profile contains a small thumbnail of the time in ranges bar along with the total units of basal and bolus insulin administered that day. For additional ease of use and simplicity, the percentage of total insulin for each type of insulin is displayed for each daily profile. The very bottom of the second page contains a detailed key for all symbols and abbreviations used in the daily profiles. For example, the start of physical activity is designated by the running icon, see Friday May 5th at 6 AM.
Discussion
The AGP Report: Connected Insulin Pen brings together essential CGM-derived glucose metrics and connected insulin pen metrics into a single recognizable report containing clinically useful information. This report builds on and expands the current CGM AGP report, shares many features with existing connected pen reports, 36 and incorporates the key components suggested to be included in a standardized insulin pen report by Tejera-Pérez et al. and Rodbard and Garg. 11,26 The time in ranges bar graph is strategically located in the upper left corner of the report, making it the first thing the user of the report sees. Internationally accepted goals for the different time in ranges are included to allow for a rapid comparison of current glycemic management and established goals/targets. This provides a starting point for a shared decision-making conversation. Ranges have been added to the average total daily dose and average boluses per day section of the insulin metrics table to avoid having the report user look only at daily profiles to gather this useful information. Dose calculators, and data on how often they are used, are a useful feature of connected insulin pens. This report goes beyond simply listing information on percentage of time the calculator is used by adding how often it is overridden by either increasing or decreasing the calculator-recommended insulin dose.
The use of terminology that is neutral, free of stigma, and less judgmental was a major emphasis in the development of this report. 37 For example, the phrase “basal doses not given” was used instead of “basal doses missed.” This is a more neutral and less judgmental way to present this important information in the insulin metrics table. Another example in the bolus (mealtime) insulin assessment section is the phrase “days with bolus doses” for each mealtime period instead of “bolus doses missed.” The word “missed” is fraught with judgment and there may be times when the bolus dose is not administered due to lack of eating, or for other reasons, so it is not correct to conclude automatically that these doses are “missed.”
It is our intention that this AGP Report: Connected Insulin Pen will be used by companies developing connected pen technology platforms and associated reports or that it will be incorporated in future revisions of currently available connected pen reports. Our report does not preclude the creation and inclusion of additional reports particular to any device technology (e.g., a report on timing and types of alerts, pen temperature, and so on). In addition, we assume that the AGP report for connected pens will continue to evolve, just as the AGP report for CGM continues to evolve as new metrics are added. One example of this is the newly emerging CGM metric called time in tight range (TITR). 38 –42 TITR is defined as percentage of time glucose values in the range of 70–140 mg/dL that more closely represents normoglycemia. This metric may be particularly helpful for those individuals that have already achieved the standard time in range target of >70% and would benefit from a tighter glucose range to guide clinical decision-making. In addition, for specific populations, like diabetes and pregnancy, specific glycemic targets are warranted (e.g., time in range from 63 to 140 mg/dL). 43 These modified targets should be adaptable in the settings of individual connected pen systems and be reflected in a modified or separate report.
Conclusion
The AGP Report: Connected Insulin Pen is a standardized clinically useful report that should be considered by companies developing connected pen technology as part of their system reporting/output. Standardization of connected insulin pen reports will hopefully enhance the clinical utility of this emerging diabetes technology. It will allow clinicians to learn how to interpret one report versus deciphering many different reports. It embraces the spirit of the ADA Standards of Care recommendation to use a standardized report. 23 A standardized connected insulin pen report containing the already familiar and standardized AGP format will also allow a uniform way for clinicians and people with diabetes to directly compare connected insulin pen performance and determine the clinical impact of this new technology on glucose management in a variety of settings.
Footnotes
Acknowledgment
The authors would like to acknowledge the generous support and encouragement from the Leona M. and Harry B. Helmsley Charitable Trust.
Authors' Contributions
G.D.S, A.B.C., and R.M.B were responsible for the concept of the article. G.D.S. wrote the article. All authors contributed to the standardized report, reviewed, edited, and approved the final version of the article. G.D.S., A.B.C., and R.M.B. are the guarantors of the expert panel and Standardized Ambulatory Glucose Profile Report for Connected Insulin Pens and, as such, take responsibility for the integrity and accuracy of the final result.
Author Disclosure Statement
G.D.S. has acted as a consultant or received educational grants from Abbott Diabetes Care, Insulet, and Sanofi. His employer nonprofit HealthPartners Institute International Diabetes Center receives all these funds, and he receives no personal income from these activities. A.B.C. has received research support, has acted as a consultant, or has been on the scientific advisory board for Abbott Diabetes Care, DexCom, Insulet, and Medtronic. Her employer, nonprofit HealthPartners Institute, contracts for her services, and she receives no personal income from these activities. T.B. served on advisory panels of Novo Nordisk, Sanofi, Eli Lilly, Boehringer, Medtronic, Abbott, and Indigo Diabetes. T.B. received honoraria for participating on the speaker’s bureau of Eli Lilly, Novo Nordisk, Medtronic, Abbott, Sanofi, Dexcom, Aventis, Astra Zeneca, and Roche. T.B.’s institution received research grant support from Abbott, Medtronic, Novo Nordisk, Sanofi, Novartis, Sandoz, Zealand Pharma, Slovenian Research Agency, the National Institutes of Health, and the European Union. A.L.C. is part of the consulting/advisory board for Novo Nordisk, Medtronic/Companion Medical, Sanofi, and MannKind and research investigator for Novo Nordisk, Medtronic/Companion Medical, Insulet, Dexcom, Abbott, Sanofi, Eli Lilly, United Health, Inc., and Tandem Diabetes. His employer, non-profit HealthPartners Institute, contracts for his services, and he receives no personal income from these activities. P.C. received personal fees from Abbott, Medtronic, Dexcom, Insulet, Glooko, Novo Nordisk, Sanofi, Lilly, and Vertex. S.F. is a shareholder of Diabeloop and has been a consultant for Diabeloop. S.F. has received consultant fees and/or speaker fees from Novo Nordisk, Abbott, MSD France, Roche, Sanofi Lifescan, and Eli Lilly, and she is employed by CERITD a nonprofit association, which has received research support from MSD Avenir fund. D.G. served on Medtronic and Abbott advisory boards and her former employer, non-profit HealthPartners Institute International Diabetes Center, received all these funds, and she received no personal income from these activities. D.G. is currently employed by Tandem Diabetes Care. G.G. is part of speakers’ bureau for Eli Lilly and Abbott Diabetes. I.B.H. Research: Dexcom, Tandem, MannKind; Consulting: Abbott Diabetes Care, Roche, Hagar, and Vertex. D.I. speaker for Lilly, Novo Nordisk, Dexcom, Abbott, and Eversense; consultant for Medtronic and Eli Lilly. M.L.J. has received research support from Abbott Diabetes Care, DexCom, Eli Lilly, Insulet, Medtronic, Novo Nordisk, and Tandem Diabetes Care. Her employer, nonprofit HealthPartners Institute, contracts for her services, and she receives no personal income from these activities. D.K. has received research support from Abbott Diabetes Care and Consultancy fees from Abbott Rapid Diagnostics, Sanofi, and Better Therapeutics. D.F.K. Consultant: Abbott, Cequr, Embecta, Insulet, Lilly, Ascencia, MannKind, Medtronic, Sanofi, and Proteomics. Speaker bureau for Dexcom, Cequr, Lilly, Novo Nordisk, and Sanofi. Contracted for Institutional Research with Abbott, Beta Bionics, Insulet, Novo Nordisk, and Tandem. C.M. serves or has served on the advisory panel for Novo Nordisk, Sanofi, Eli Lilly and Company, Novartis, Boehringer Ingelheim, Roche, Medtronic, Imcyse, Insulet, and Vertex. Financial compensation for these activities has been received by KU Leuven; KU Leuven has received research support for C.M. from Medtronic, Imcyse, Novo Nordisk, Sanofi, and ActoBio Therapeutics; C.M. serves or has served on the speakers’ bureau for Novo Nordisk, Sanofi, Eli Lilly and Company, Medtronic, and Boehringer Ingelheim. Financial compensation for these activities has been received by KU Leuven. C.M. is president of EASD, and external support of EASD is to be found on ![]() T.W.M. has received research support, has acted as a consultant, or has been on the scientific advisory board for Abbott Diabetes Care, DexCom, Eli Lilly, Insulet, Medtronic, Novo Nordisk, Tandem Diabetes Care, and Sanofi. His employer, nonprofit HealthPartners Institute, contracts for his services, and he receives no personal income from these activities. R.N. has received grants from Helmsley Charitable Trust, Dexcom, Medtronic, Abbott Diabetes Care, and Insulet; personal fees and others from DreaMed Diabetes Ltd; personal fees from Novo Nordisk, Insulet, Pfizer, and Eli Lilly; and owns stock in DreaMed Diabetes Ltd. E.E.W. is on advisory boards for Abbott Diabetes Care, Ascensia, Embecta, Lilly, and Sanofi and has received consultant fees and/or speakers fees for Abbott Diabetes Care, Embecta, Lilly, and Sanofi. S.M.O. has received diabetes related research support from The Leona M. and Harry B. Helmsley Charitable Trust, American Academy of Family Physicians, Colorado Department of Public Health & Environment, Dexcom, Abbott, and Insulet. His institution has been compensated for his service on Advisory Boards for Blue Circle Health, Dexcom, and Ascensia. A.L.P. Advisory Boards: Medscape, Vertex, and Lilly. Research funding: Insulet, Abbott Diabetes Care. Stock options: Omada Health. R.W. Participation in clinical trials, through her institution, sponsored by Tandem, Insulet, Eli Lilly, Amgen, MannKind, and Diasome, and DexCom provided devices at reduced cost for research studies. E.E.W. is on advisory boards for Abbott Diabetes Care, Ascensia, Embecta, Lilly, and Sanofi and has received consultant fees and/or speakers fees for Abbott Diabetes Care, Embecta, Lilly, and Sanofi. C.H.W. Research funding to institution: Novo Nordisk Eli Lilly, Bayer, Corcept Speaker’s Bureau: Novo Nordisk Eli Lilly Advisory Board: Abbott, Cequr, Novo Nordisk. R.M.B. has received research support, has acted as a consultant, or has been on the scientific advisory board for Abbott Diabetes Care, Ascensia, CeQur, DexCom, Eli Lilly, Embecta, Hygieia, Insulet, Medtronic, Novo Nordisk, Onduo, Roche Diabetes Care, Tandem Diabetes Care, Sanofi, United Healthcare, Vertex Pharmaceuticals, and Zealand Pharma. His employer, nonprofit HealthPartners Institute, contracts for his services, and he receives no personal income from these activities.
T.W.M. has received research support, has acted as a consultant, or has been on the scientific advisory board for Abbott Diabetes Care, DexCom, Eli Lilly, Insulet, Medtronic, Novo Nordisk, Tandem Diabetes Care, and Sanofi. His employer, nonprofit HealthPartners Institute, contracts for his services, and he receives no personal income from these activities. R.N. has received grants from Helmsley Charitable Trust, Dexcom, Medtronic, Abbott Diabetes Care, and Insulet; personal fees and others from DreaMed Diabetes Ltd; personal fees from Novo Nordisk, Insulet, Pfizer, and Eli Lilly; and owns stock in DreaMed Diabetes Ltd. E.E.W. is on advisory boards for Abbott Diabetes Care, Ascensia, Embecta, Lilly, and Sanofi and has received consultant fees and/or speakers fees for Abbott Diabetes Care, Embecta, Lilly, and Sanofi. S.M.O. has received diabetes related research support from The Leona M. and Harry B. Helmsley Charitable Trust, American Academy of Family Physicians, Colorado Department of Public Health & Environment, Dexcom, Abbott, and Insulet. His institution has been compensated for his service on Advisory Boards for Blue Circle Health, Dexcom, and Ascensia. A.L.P. Advisory Boards: Medscape, Vertex, and Lilly. Research funding: Insulet, Abbott Diabetes Care. Stock options: Omada Health. R.W. Participation in clinical trials, through her institution, sponsored by Tandem, Insulet, Eli Lilly, Amgen, MannKind, and Diasome, and DexCom provided devices at reduced cost for research studies. E.E.W. is on advisory boards for Abbott Diabetes Care, Ascensia, Embecta, Lilly, and Sanofi and has received consultant fees and/or speakers fees for Abbott Diabetes Care, Embecta, Lilly, and Sanofi. C.H.W. Research funding to institution: Novo Nordisk Eli Lilly, Bayer, Corcept Speaker’s Bureau: Novo Nordisk Eli Lilly Advisory Board: Abbott, Cequr, Novo Nordisk. R.M.B. has received research support, has acted as a consultant, or has been on the scientific advisory board for Abbott Diabetes Care, Ascensia, CeQur, DexCom, Eli Lilly, Embecta, Hygieia, Insulet, Medtronic, Novo Nordisk, Onduo, Roche Diabetes Care, Tandem Diabetes Care, Sanofi, United Healthcare, Vertex Pharmaceuticals, and Zealand Pharma. His employer, nonprofit HealthPartners Institute, contracts for his services, and he receives no personal income from these activities.
Funding Information
Funding provided by the Harry B. Helmsley Charitable Trust.