
Abstract
Background:
Subcutaneous continuous glucose monitoring (CGM) may facilitate glucose control in the ICU. We aimed to assess the accuracy of CGM (Dexcom G6) against arterial blood glucose (ABG) in adult critically ill patients receiving intravenous insulin infusion and vasopressor therapy. We also aimed to assess feasibility and tolerability of CGM in this setting.
Methods:
We included ICU patients receiving mechanical ventilation, insulin, and vasopressor therapy. Numerical accuracy was assessed by the mean absolute relative difference (MARD), overall, across arterial glucose strata, over different noradrenaline equivalent infusion rates, and over time since CGM start. MARD <14% was considered acceptable. Clinical accuracy was assessed using Clarke Error Grid (CEG) analysis. Feasibility outcome included number and duration of interrupted sensor readings due to signal loss. Tolerability outcome included skin reactions related to sensor insertion or sensor adhesives.
Results:
We obtained 2946 paired samples from 40 patients (18 with type 2 diabetes) receiving a median (IQR) maximum noradrenaline equivalent infusion rate of 0.18 (0.08–0.33) µg/kg/min during CGM. Overall, MARD was 12.7% (95% CI 10.7–15.3), and 99.8% of CGM readings were within CEG zones A and B. MARD values ≥14% were observed when ABG was outside target range (6–10 mmol/L [108–180 mg/dL]) and with noradrenaline equivalent infusion rates above 0.10 µg/kg/min. Accuracy improved with time after CGM start, reaching MARD values <14% after 36 h. We observed four episodes of interrupted sensor readings due to signal loss, ranging from 5 to 20 min. We observed no skin reaction related to sensor insertion or sensor adhesives.
Conclusions:
In our ICU cohort of patients receiving vasopressor infusion, subcutaneous CGM demonstrated acceptable overall numerical and clinical accuracy. However, suboptimal accuracy may occur outside glucose ranges of 6–10 mmol/L (108–180 mg/dL), during higher dose vasopressor infusion, and during the first 36 h after CGM start.
Introduction
Excessive glucose fluctuations and hypoglycemia are associated with mortality among intensive care unit (ICU) patients. 1,2 These complications are primarily associated with insulin therapy, requiring a meticulous and adaptive approach to glucose monitoring. Glucose control within the ICU relies on intermittent blood glucose measurements. The most recent ICU guidelines suggest at least hourly glucose measurements in critically ill adults on intravenous insulin during episodes of glucose instability. 3 However, the frequency of these measurements is subject to the constraints of nursing workload, resulting in periods of less frequent monitoring. This limitation hampers the early detection and attenuation of imminent hypoglycemia and glucose oscillations, thus impacting patient safety.
Subcutaneous continuous glucose monitoring (CGM) is a potential solution providing real-time feedback to health care providers, allowing a more proactive and timely approach to treatment decisions. Consequently, CGM-guided glucose control has the potential to reduce glucose variability, prevent hypoglycemia, and improve overall glycemic control in ICU patients. Indeed, implementation of CGM as standard for outpatient use has improved long-term glucose control and reduced the occurrence of hypoglycemia in individuals with type 1 diabetes. 4 Preliminary studies have suggested an acceptable accuracy of CGM in ICU settings. 5 –9 However, these studies were limited by small sample sizes, with primary focus on COVID-19 patients, and involved comparative analyses against point-of-care meters, which are not recommended to use in the ICU. 10 –12 Furthermore, there are concerns regarding impaired CGM accuracy in patients receiving vasopressor therapy due to reduced blood circulation to the skin where the CGM sensor is applied. 13
Accordingly, we conducted a prospective, observational study to assess the accuracy of CGM against arterial blood gas glucose (ABG) in ICU patients receiving vasopressor and insulin infusions, overall and in relevant subgroups. Furthermore, we aimed to assess the feasibility and tolerability of CGM in this clinical context.
Methods
The study has been performed in accordance with the ethical standards laid down in the 1964 Declaration of Helsinki and its later amendment. The Swedish Ethical Review Authority approved the study (approval number 2020–03513 and 2024-01327-02). Delayed informed consent was obtained from the patient or next of kin. Before commencing enrolment, the study was registered at https://clinicaltrials.gov (NCT05255783) on January 26, 2022.
Study design
We conducted an investigator-initiated, prospective, observational accuracy study of patients admitted to ICU at the Karolinska University Hospital, Stockholm, Sweden, between November 11, 2021, and May 5, 2023. Adult (≥18 years of age) patients were eligible if they had an indwelling arterial catheter in situ, had intravenous insulin infusion commenced in the previous 6 h (or expected to commence within the next 2h) due to blood glucose >10 mmol/L (>180 mg/dL), received vasopressor infusion (or vasopressor infusion expected to commence within the next two hours), received mechanical ventilation (or mechanical ventilation expected to commence within the next two hours), and were expected to stay in the ICU at least 2 days. We excluded patients who were pregnant, those in whom informed consent could not be obtained, and those in whom death was considered imminent.
Glucose monitoring
We applied the Dexcom G6 CGM sensor (Dexcom Inc., Sand Diego, CA) on the abdomen according to the manufacturer’s instructions. In patients with large wound dressings, the sensor was placed on the upper arm. The Dexcom G6 sensor measures glucose by an oxidase-based electrochemical technology. Compared with previous generations, the Dexcom G6 sensor has longer lifespan (up to 10 days), has improved signal processing algorithms for better accuracy, and prevents interference from substances like acetaminophen. After a 2-h warmup, CGM readings were obtained from a wireless handheld receiver. CGM continued for 10 days or until ICU discharge, removal of the arterial line, or death, whichever came first. The Dexcom G6 is factory calibrated. Additional manual calibrations were not performed during the study period. The sensor was removed before magnetic resonance scanning or abdominal surgery and replaced with a new sensor after the procedure. Arterial blood glucose was measured on the Radiometer ABL800 flex blood gas analyzer (Radiometer Medical, Brønshøj, Denmark) as part of routine care. Bedside nurses were instructed to guide insulin therapy based on arterial glucose values only. All sensor alarms were disabled, except low glucose alarm, which was set at <3.3 mmol/L (<60 mg/dL). Target blood glucose was 6–10 mmol/L (108–180 mg/dL). According to standard care at our unit, intravenous insulin infusion was administrated using the B.Braun Space Control System (B.Braun, Melsungen Germany), which suggests dose adjustments based on arterial blood glucose levels and nutrition.
Data collection
We prospectively recorded paired glucose values from arterial blood gases and CGM. In addition, we collected demographic data, diabetes status, admission glycated hemoglobin A1c (HbA1c), location before ICU admission, ICU admission diagnoses, admission simplified acute physiology score (SAPS 3), daily sequential organ failure assessment (SOFA) score, and ICU mortality. Treatment and SOFA score data were recorded each time paired glucose values were obtained. Hypoglycemia was defined as an ABG level below 4 mmol/L (72 mg/dL). Glucose variability was quantified as the standard deviation and coefficient of variation of all ABG values during CGM. Noradrenaline equivalent infusion rate (in µg/kg/min) was calculated as follows: noradrenaline rate (µg/kg/min) + adrenaline rate (µg/kg/min) + 2.5 × vasopressin rate (U/min). 14
Primary outcome
The primary endpoint was numerical accuracy determined according to the mean absolute relative difference (MARD) in percent between CGM and ABG values. MARD <14% is considered acceptable accuracy in ICU patients. 15 Owing to skewed distribution of absolute relative differences (Supplementary Fig. S1), we also present the median absolute relative difference (median ARD).
Secondary outcomes
Secondary outcomes included mean absolute difference (MAD), mean difference, mean relative difference, bias with limits of agreement according to the Bland–Altman methodology, accuracy determined according to the International Organization for Standardization (ISO) criteria from 2013 (ISO 15197:2013), 16 accuracy determined according to the Clinical and Laboratory Standards Institute (CLSI) Point of Care Testing 12-A3 (POCT12-A3) standard, 17 and clinical accuracy determined by Clarke Error Grid (CEG) analysis, 18 Parkes Consensus Error Grid (PCEG) analysis, 19 and Surveillance Error Grid (SEG) analysis. 20
Feasibility outcome
Feasibility outcome included number and duration of interrupted sensor readings due to signal loss obtained from downloaded CGM readings.
Tolerability outcome
Tolerability outcome included local reactions (e.g., allergic skin reactions, bruising) related to sensor insertion or sensor adhesives.
Post hoc analyses
In exploratory post hoc analyses, MARD (95% CI) and mean (95% CI) difference were assessed across ABG levels, SOFA scores, noradrenaline equivalent infusion rates, mean arterial pressure levels, and during extracorporeal membrane oxygenation (ECMO). We also assessed performance over time since CGM initiation.
Statistical analysis
We estimated that inclusion of 40 patients was required for a 95% confidence interval (CI) for the MARD to have a range of ±1.7%, meaning that MARD can be estimated with high precision. Power calculations of CIs were done using normal approximation, assuming a standard deviation of 5.5 percentage units. ARD was calculated as the absolute difference between CGM and ABG, divided by ABG, and expressed in %. Patient-averaged MARD was calculated as the mean of ARDs for each patient and was summarized as median with 95% CIs obtained using a binomial method. Patient-averaged median ARD, mean absolute difference, mean difference, and mean relative difference were also presented as median with 95% CIs. We also report aggregated MARD, i.e., the mean and median of all ARDs without accounting for correlation within patients. In the post hoc analyses, we summarized MARD and mean difference based on aggregated data in each category. We visualized bias using the Bland–Altman methodology with 95% CI estimation for the limits of agreement, accounting for multiple observations per patient. 21 We analyzed data using STATA version 16.1 (StataCorp LLC, College Station, TX). CEG was generated using the ega package (version 2.0.0) in R (version 4.2.0, R Foundation for Statistical Computing, Vienna, Austria).
Results
Patients
Baseline characteristics, ICU length of stay, and ICU mortality of the 40 study patients are shown in Table 1. Median (IQR) age was 71 (63–75) years, 23 (57.5%) were males, and 18 (45.0%) had a recorded diabetes diagnosis. All patients received mechanical ventilation, median (IQR) SOFA score was 10 9 –11 and median maximum noradrenaline equivalent infusion rate was 0.18 (0.08-0.33) µg/kg/min. Median (IQR) duration of vasopressor therapy was 4.2 (1.3–7.9) days. Two (5.0%) patients received arteriovenous ECMO, and eight (20%) patients received continuous renal replacement therapy. Thirty-nine patients received insulin infusion, as one patient never received the planned insulin infusion due to transition to palliative care (Table 2).
Patient Characteristics
Data are presented as median (IQR) for continuous measures, and n (%) for categorical measures.
HbA1c data were missing in two patients.
ICU, intensive care unit; HbA1c, glycated hemoglobin A1c; SAPS 3, simplified acute physiology score 3.
Process of Care Characteristics and Arterial Glucose Metrics during Continuous Glucose Monitoring
Data are presented as median (IQR) for continuous measures, and n (%) for categorical measures.
Calculated as noradrenaline rate (µg/kg/min) + adrenaline rate (µg/kg/min) + 2.5 × vasopressin rate (U/min).
CGM, continuous glucose monitoring.
Process of care during CGM
CGM was commenced within a median (IQR) of 12 (6–21) h after ICU admission and continued for 5 (2–9) days (223 CGM-days in total). Median (IQR) standard deviation of ABG was 1.5 mmol/L (1.0–2.0) (27 [18–36] mg/dL) and median (IQR) coefficient of variation of ABG was 18% (13–24. We observed seven episodes of hypoglycemia in five patients (Table 2).
Primary outcome
We analyzed 2946 paired ABG and CGM readings from a total of 50 sensors (46 on abdomen and 4 on upper arm). Patient-averaged median (95% CI) MARD and median ARD was 12.7% (10.7–15.3) and 10.2% (8.7–14.1), respectively (Table 3). Aggregated MARD and median ARD was 13.2% (95% CI 12.8–13.6) and 10.8% (95% CI 10.4–11.3), respectively (Supplementary Fig. S1).
Outcomes
Values are presented as median (95% CI) or as n (%).
POCT, Clinical and Laboratory Standards Institute Point of Care Testing.
CGM minus arterial glucose.
Number of CGM values within 15% of arterial glucose ≥5.6 mmol/L (101 mg/dL) and within 0.80 mmol/L (14.4 mg/dL) of arterial glucose <5.6 mmol/L (101 mg/dL).
Number of CGM values within 12.5% of arterial glucose ≥5.6 mmol/L (101 mg/dL) and within 0.67 mmol/L (12.1 mg/dL) of arterial glucose <5.6 mmol/L (101 mg/dL).
CGM, continuous glucose monitoring; MARD, mean absolute relative difference; ISO, International Organization for Standardization; CLSI.
Secondary outcomes
Median (95% CI) mean absolute difference was 1.0 (0.8–1.2) mmol/L (18 [14–22] mg/dL). CGM underestimated ABG by 0.2 mmol/L (3.6 mg/dL) (2.6%) on average (Table 3). Bland–Altman analysis showed a mean bias of −0.2 (95% CI −0.6 to 0.2) mmol/L (−3.6 [95% CI −10.8 to 3.6] mg/dL) with a lower limit of agreement of −3.2 (95% CI −3.8 to −2.7) mmol/L (−57.7 [95% CI −68.5 to −48.6] mg/dL) and an upper limit of agreement of 2.8 (95% CI 2.4–3.5) mmol/l (50.5 [95% CI 43.2–63.1] mg/dL) (Fig. 1). Overall, 64.5% of CGM values met the ISO 15197:2013 criteria and 56.0% met the CLSI POCT12-A3 criteria. On CEG analysis, 99.8% of readings were found in zones A (values within 20% of ABG) and B (values outside 20% of ABG that would not lead to inappropriate treatment), and the remaining 0.2% in zone D (failure to treat hyperglycemia) (Fig. 2). No reading was found in zone C (overcorrection of acceptable blood glucose values leading to either hyperglycemia or hypoglycemia) or in zone E (erroneous CGM measurement leading to treatment opposite to the true glucose level). The PCEG and SEG analyses are shown in (Supplementary Fig. S2 and Supplementary Fig. S3). In the seven episodes of arterial hypoglycemia, the CGM system identified six as hypoglycemia. In one episode of arterial blood glucose of 3.9 mmol/L (70 mg/dL), CGM measured 4.1 mmol/L (74 mg/dL) (Fig. 2).
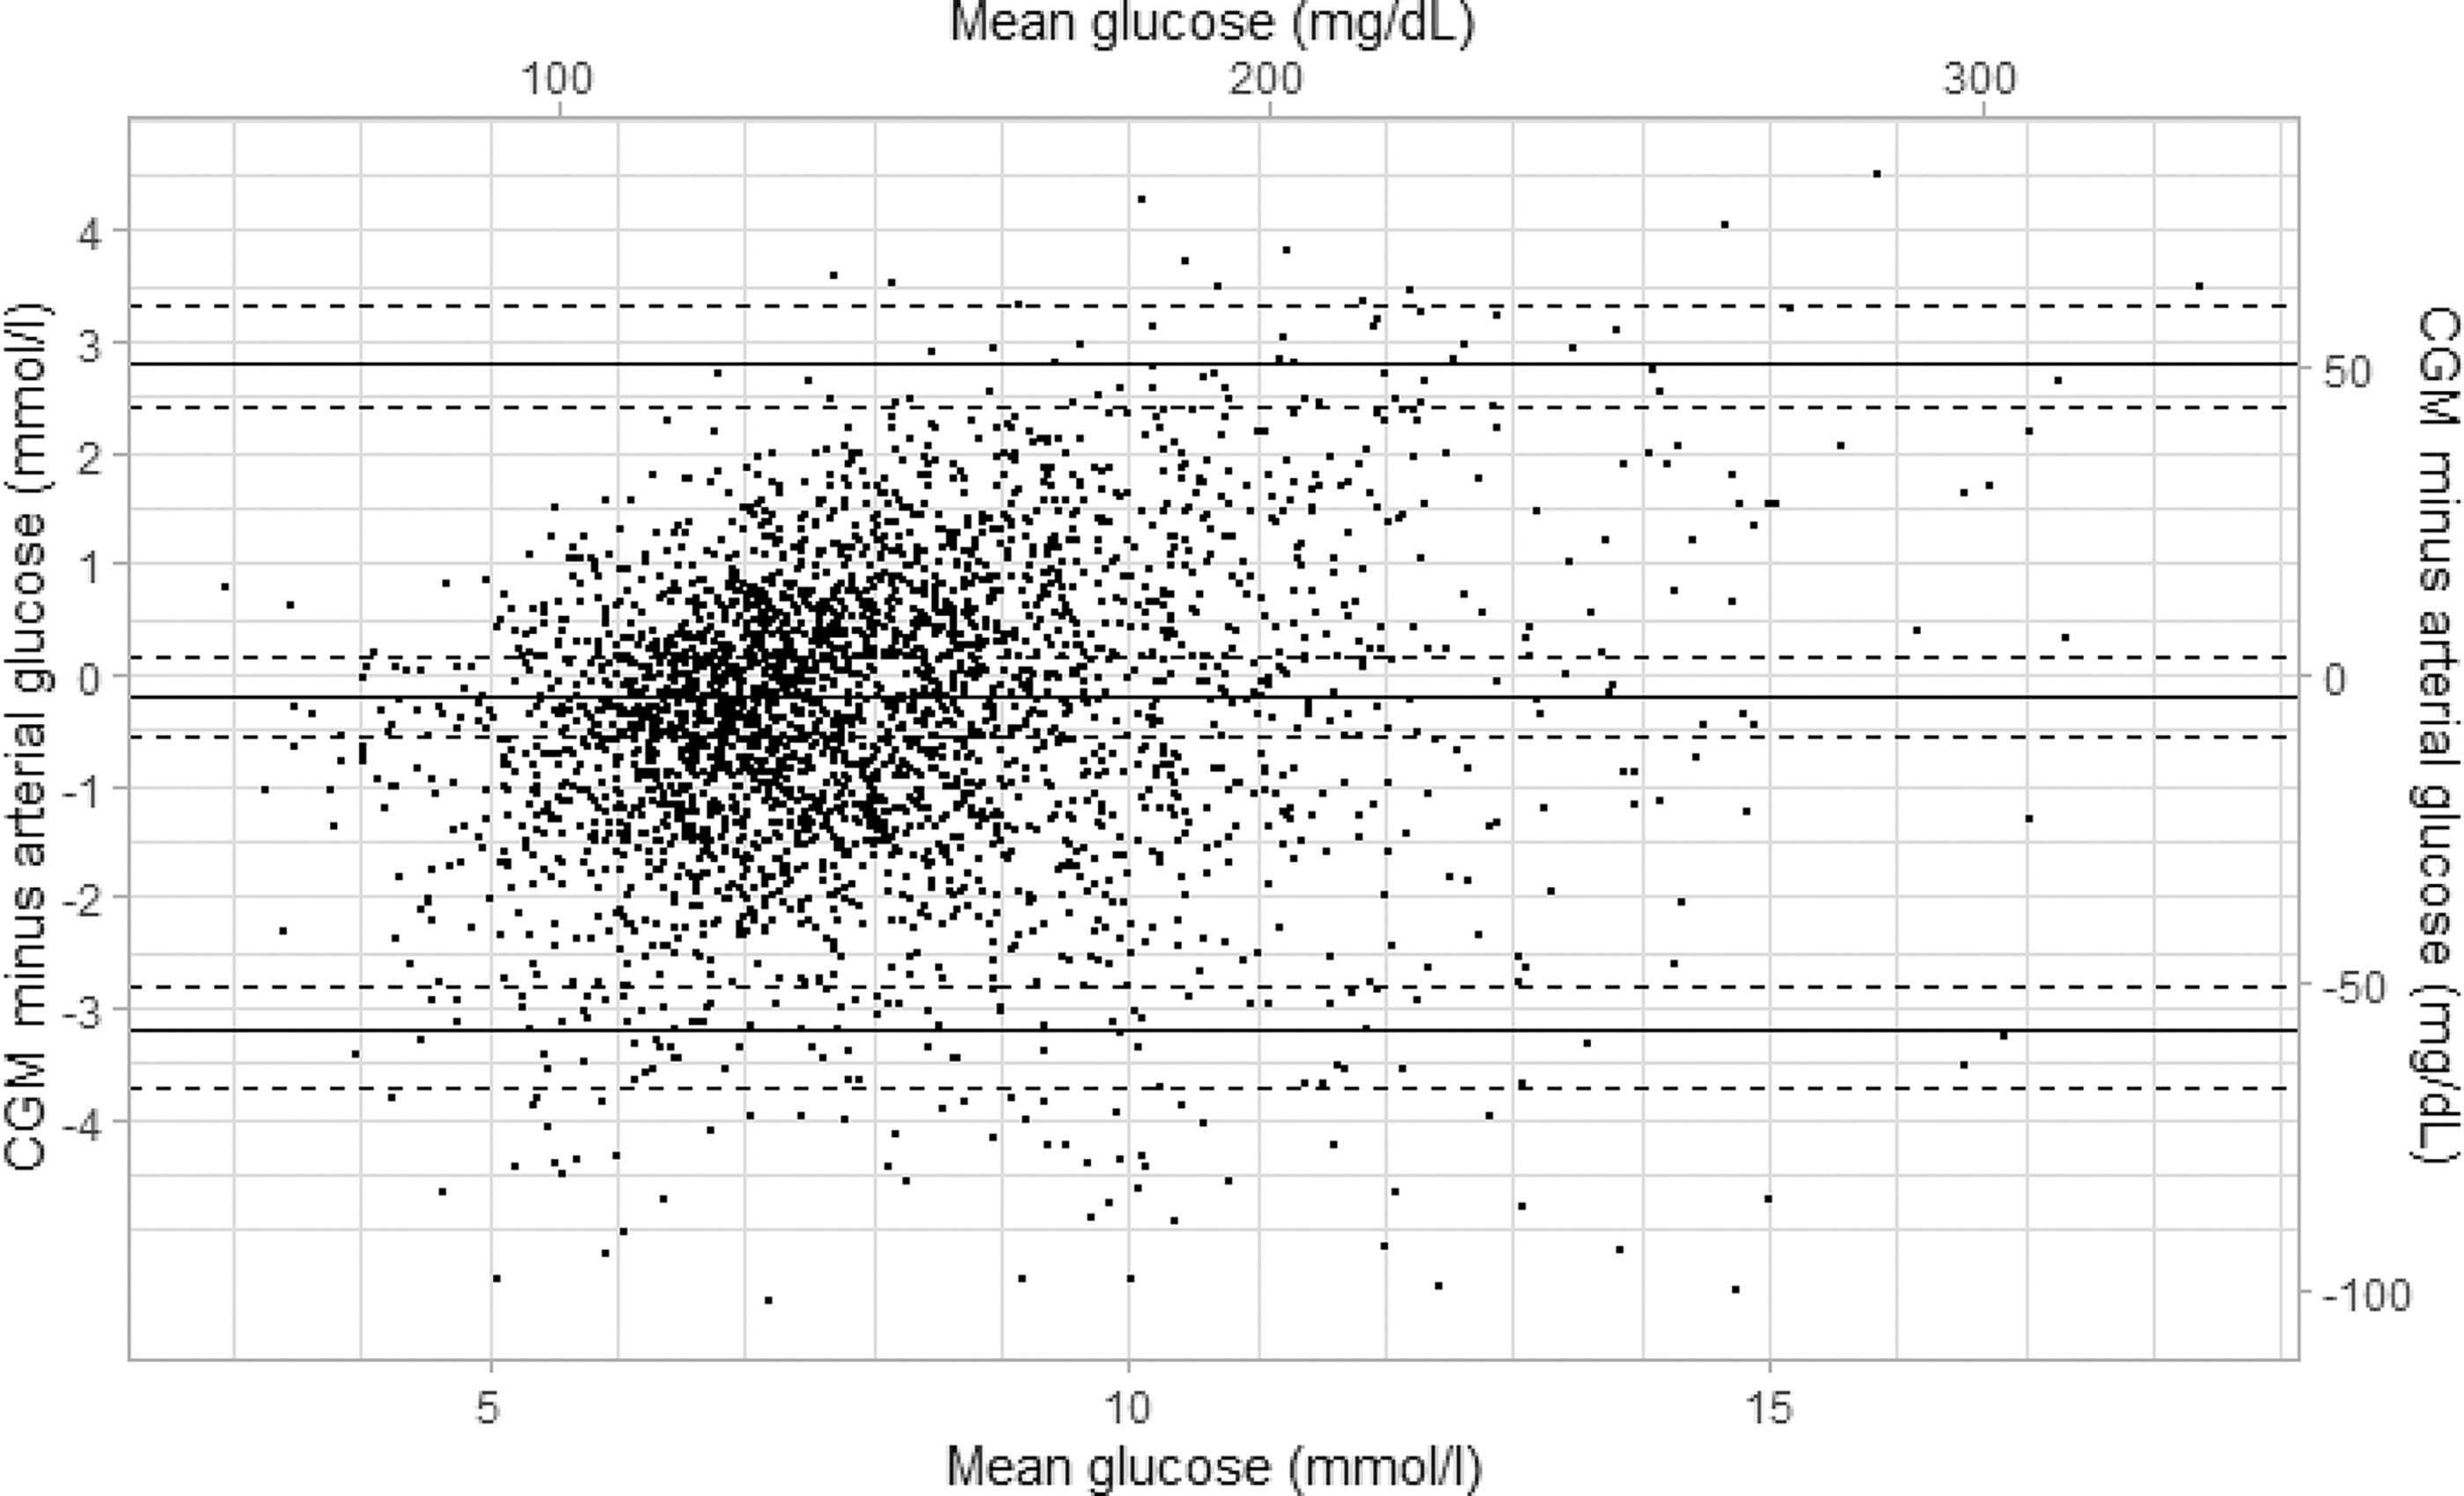
Bland–Altman plot showing the mean difference and 95% limits of agreement between 2964 paired continuous glucose monitor (CGM) and arterial glucose values. Horizontal dashed lines represent 95% confidence intervals accounting for repeated measurements within individuals.
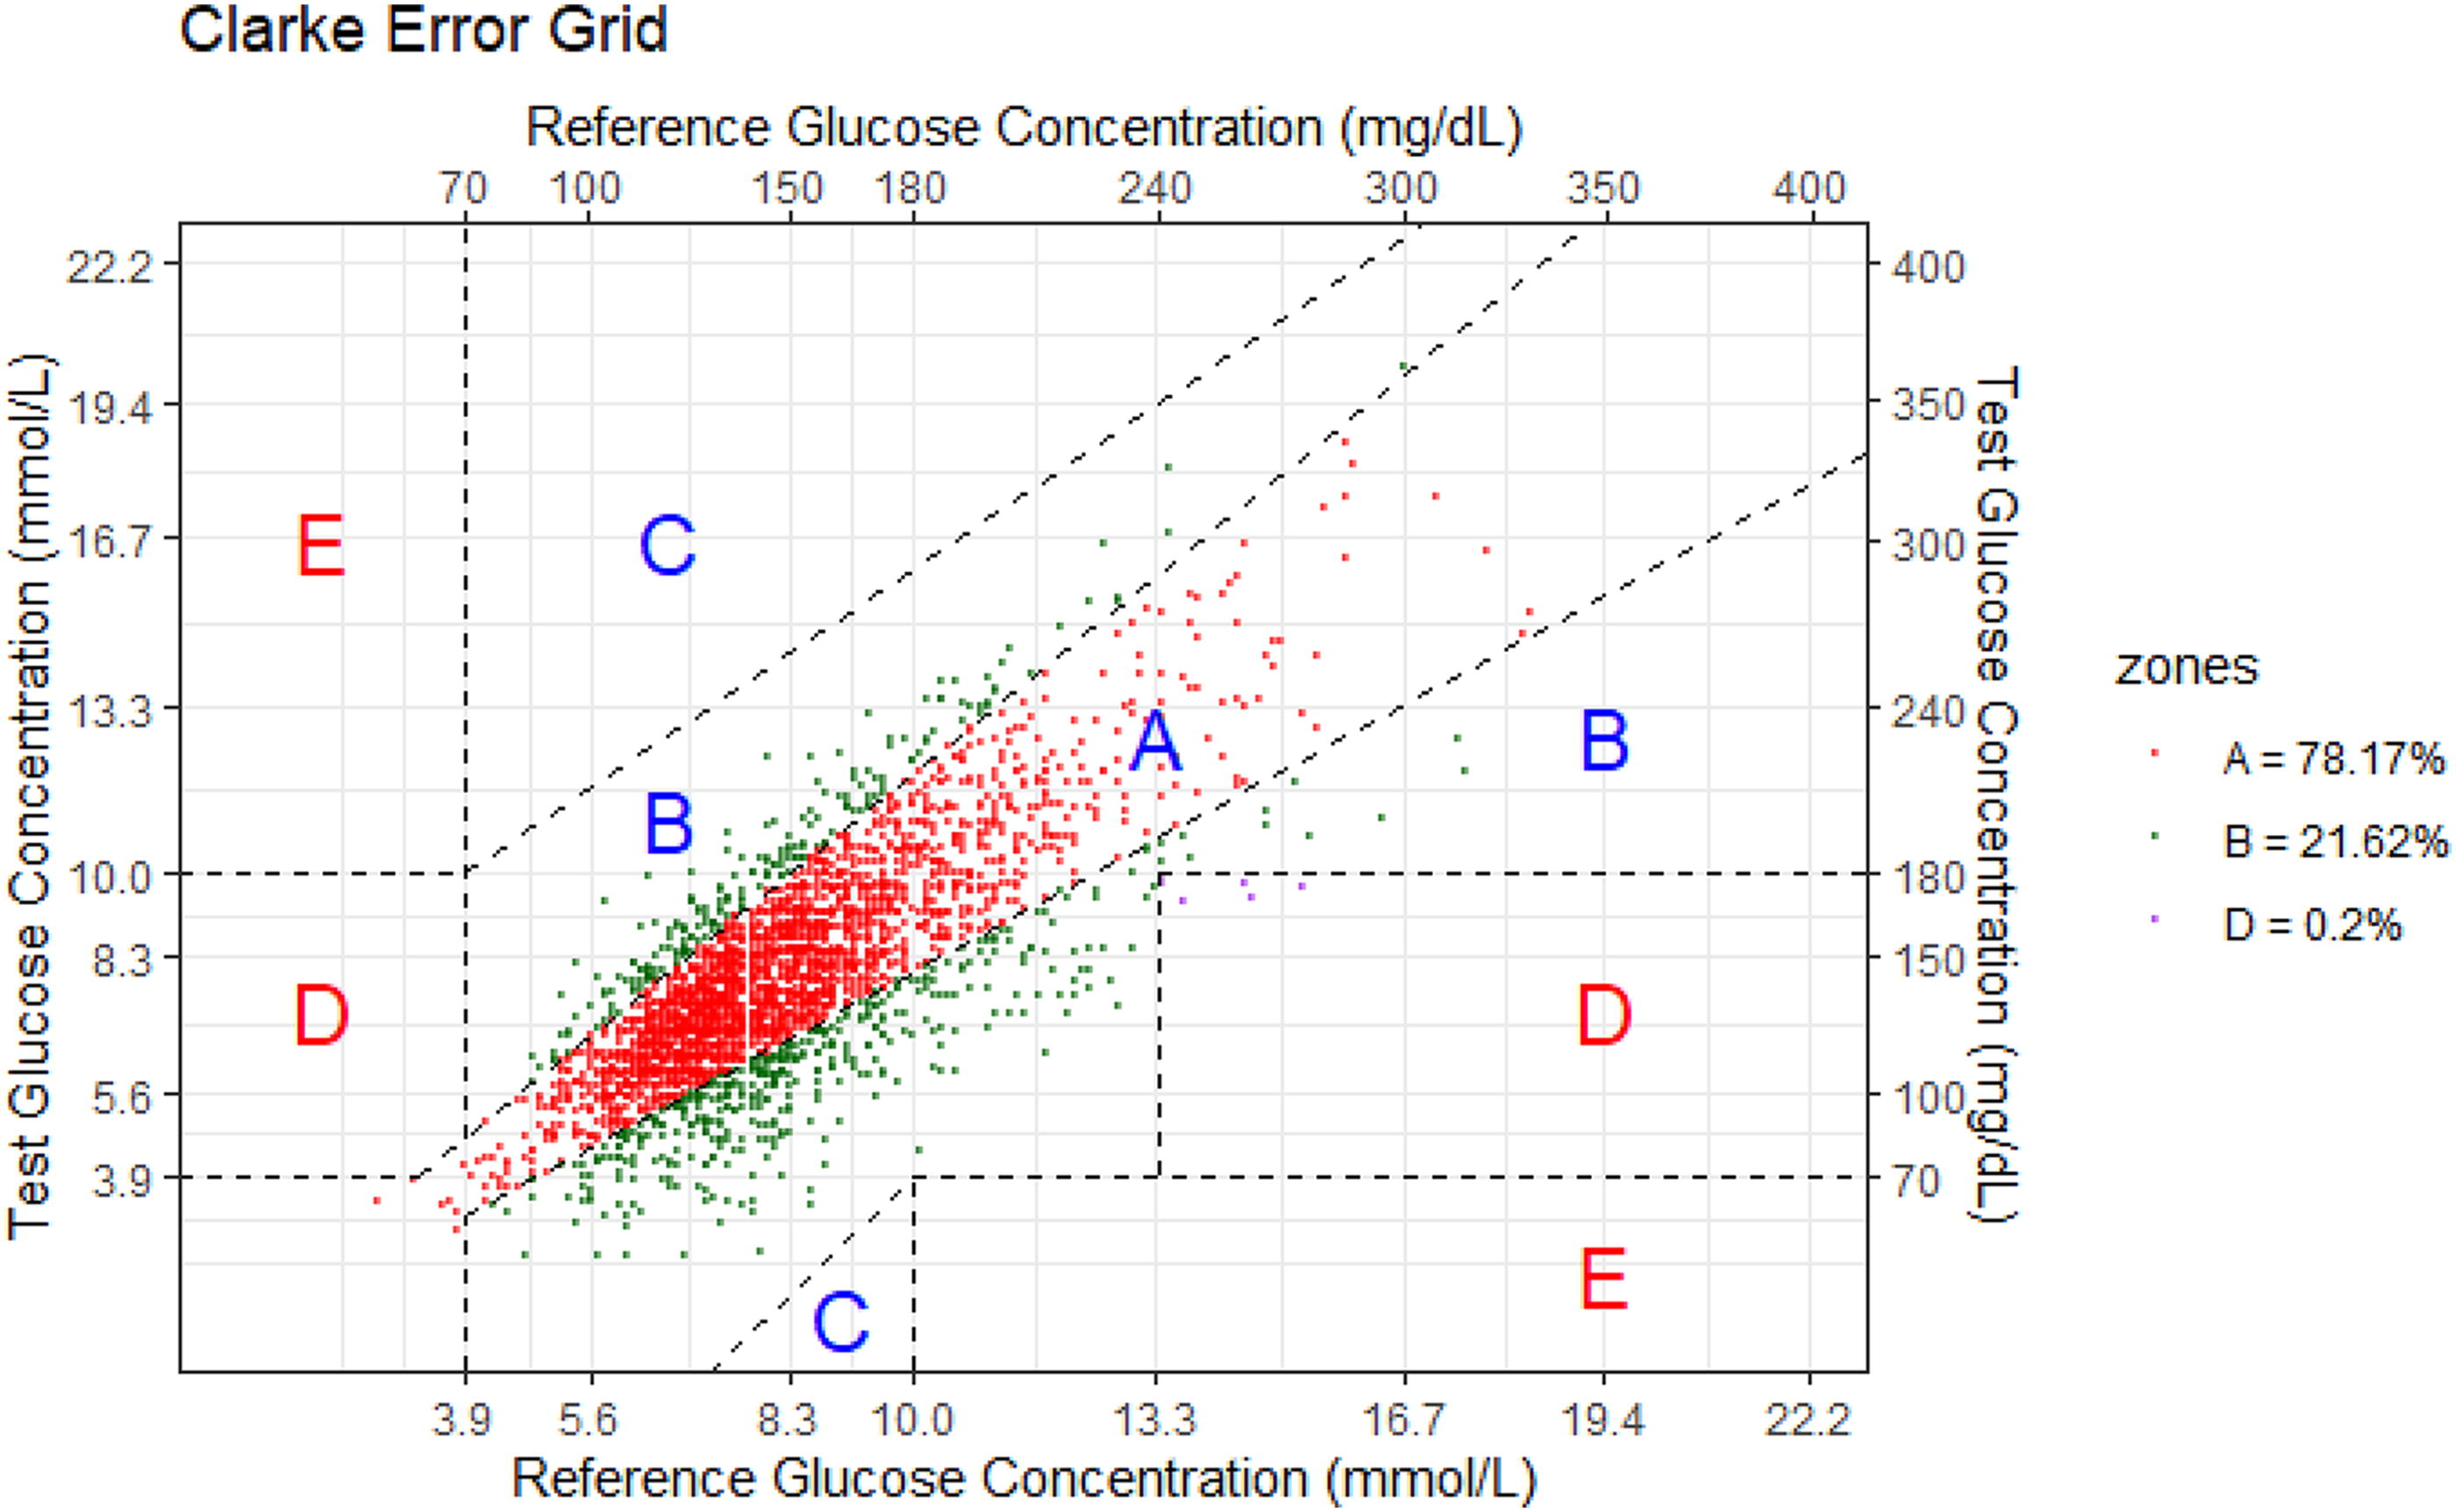
Clarke error grid analysis showing the correlation between CGM (Test Glucose Concentration) and arterial glucose (Reference Glucose Concentration). Zone A contained 78.2% of values, zone B contained 21.6% of values, and zone D contained 0.2% of values.
Feasibility and tolerability outcomes
Downloaded CGM readings were available for 35 patients. Technical issues prevented downloading in five patients. In 2 of the 35 patients, we observed four episodes of interrupted sensor readings due to signal loss. The duration of these interruptions ranged from 5 to 20 min. We observed no skin reactions related to sensor insertion or sensor adhesives.
Post hoc analyses
We observed a U-shaped relationship between accuracy (MARD) and ABG levels, with the highest accuracy (lowest MARD) observed in target glucose range (6–10 mmol/L [108–180 mg/dL]). In this range, MARD was 12.9% (95% CI 12.4–13.3). In glucose range 10–12 mmol/L (180–216 mg/dL), MARD was 13.4% (95% CI 12.4–14.5). Above 12 mmol/L (216 mg/dL), CGM underestimated ABG by 1.2 (95% CI 0.9–1.6) mmol/L (21.6 [95% CI 16.2–28.8] mg/dL), yielding a MARD of 15.8% (95% CI 14.0–17.7) (Fig. 3 and Supplementary Fig. S4). There was no consistent association between accuracy and increasing SOFA score or between accuracy and different mean arterial pressure levels. Noradrenaline equivalent infusion rates above 0.10 µg/kg/min were associated with numerically higher MARD. However, a dose–accuracy effect was not consistently observed in individual patients (Supplementary Fig. S5). During arteriovenous ECMO (2 patients with 171 paired readings), CGM underestimated ABG by 1.1 (95% CI 0.8–1.4) mmol/l (19.8 [95% CI 14.4–25.2] mg/dL), yielding a MARD of 18.5% (95% CI 16.7–20.2) with a MARD of 15.7% (95% CI 13.6–17.7) when in target glucose range (116 paired readings) and a MARD of 24.5% (95% CI 22.0–26.9) when above or below target glucose range (55 paired readings). Numerical accuracy improved with time after insertion and activation of the sensor, reaching MARD values <14% after approximately 36 h (Fig. 4).
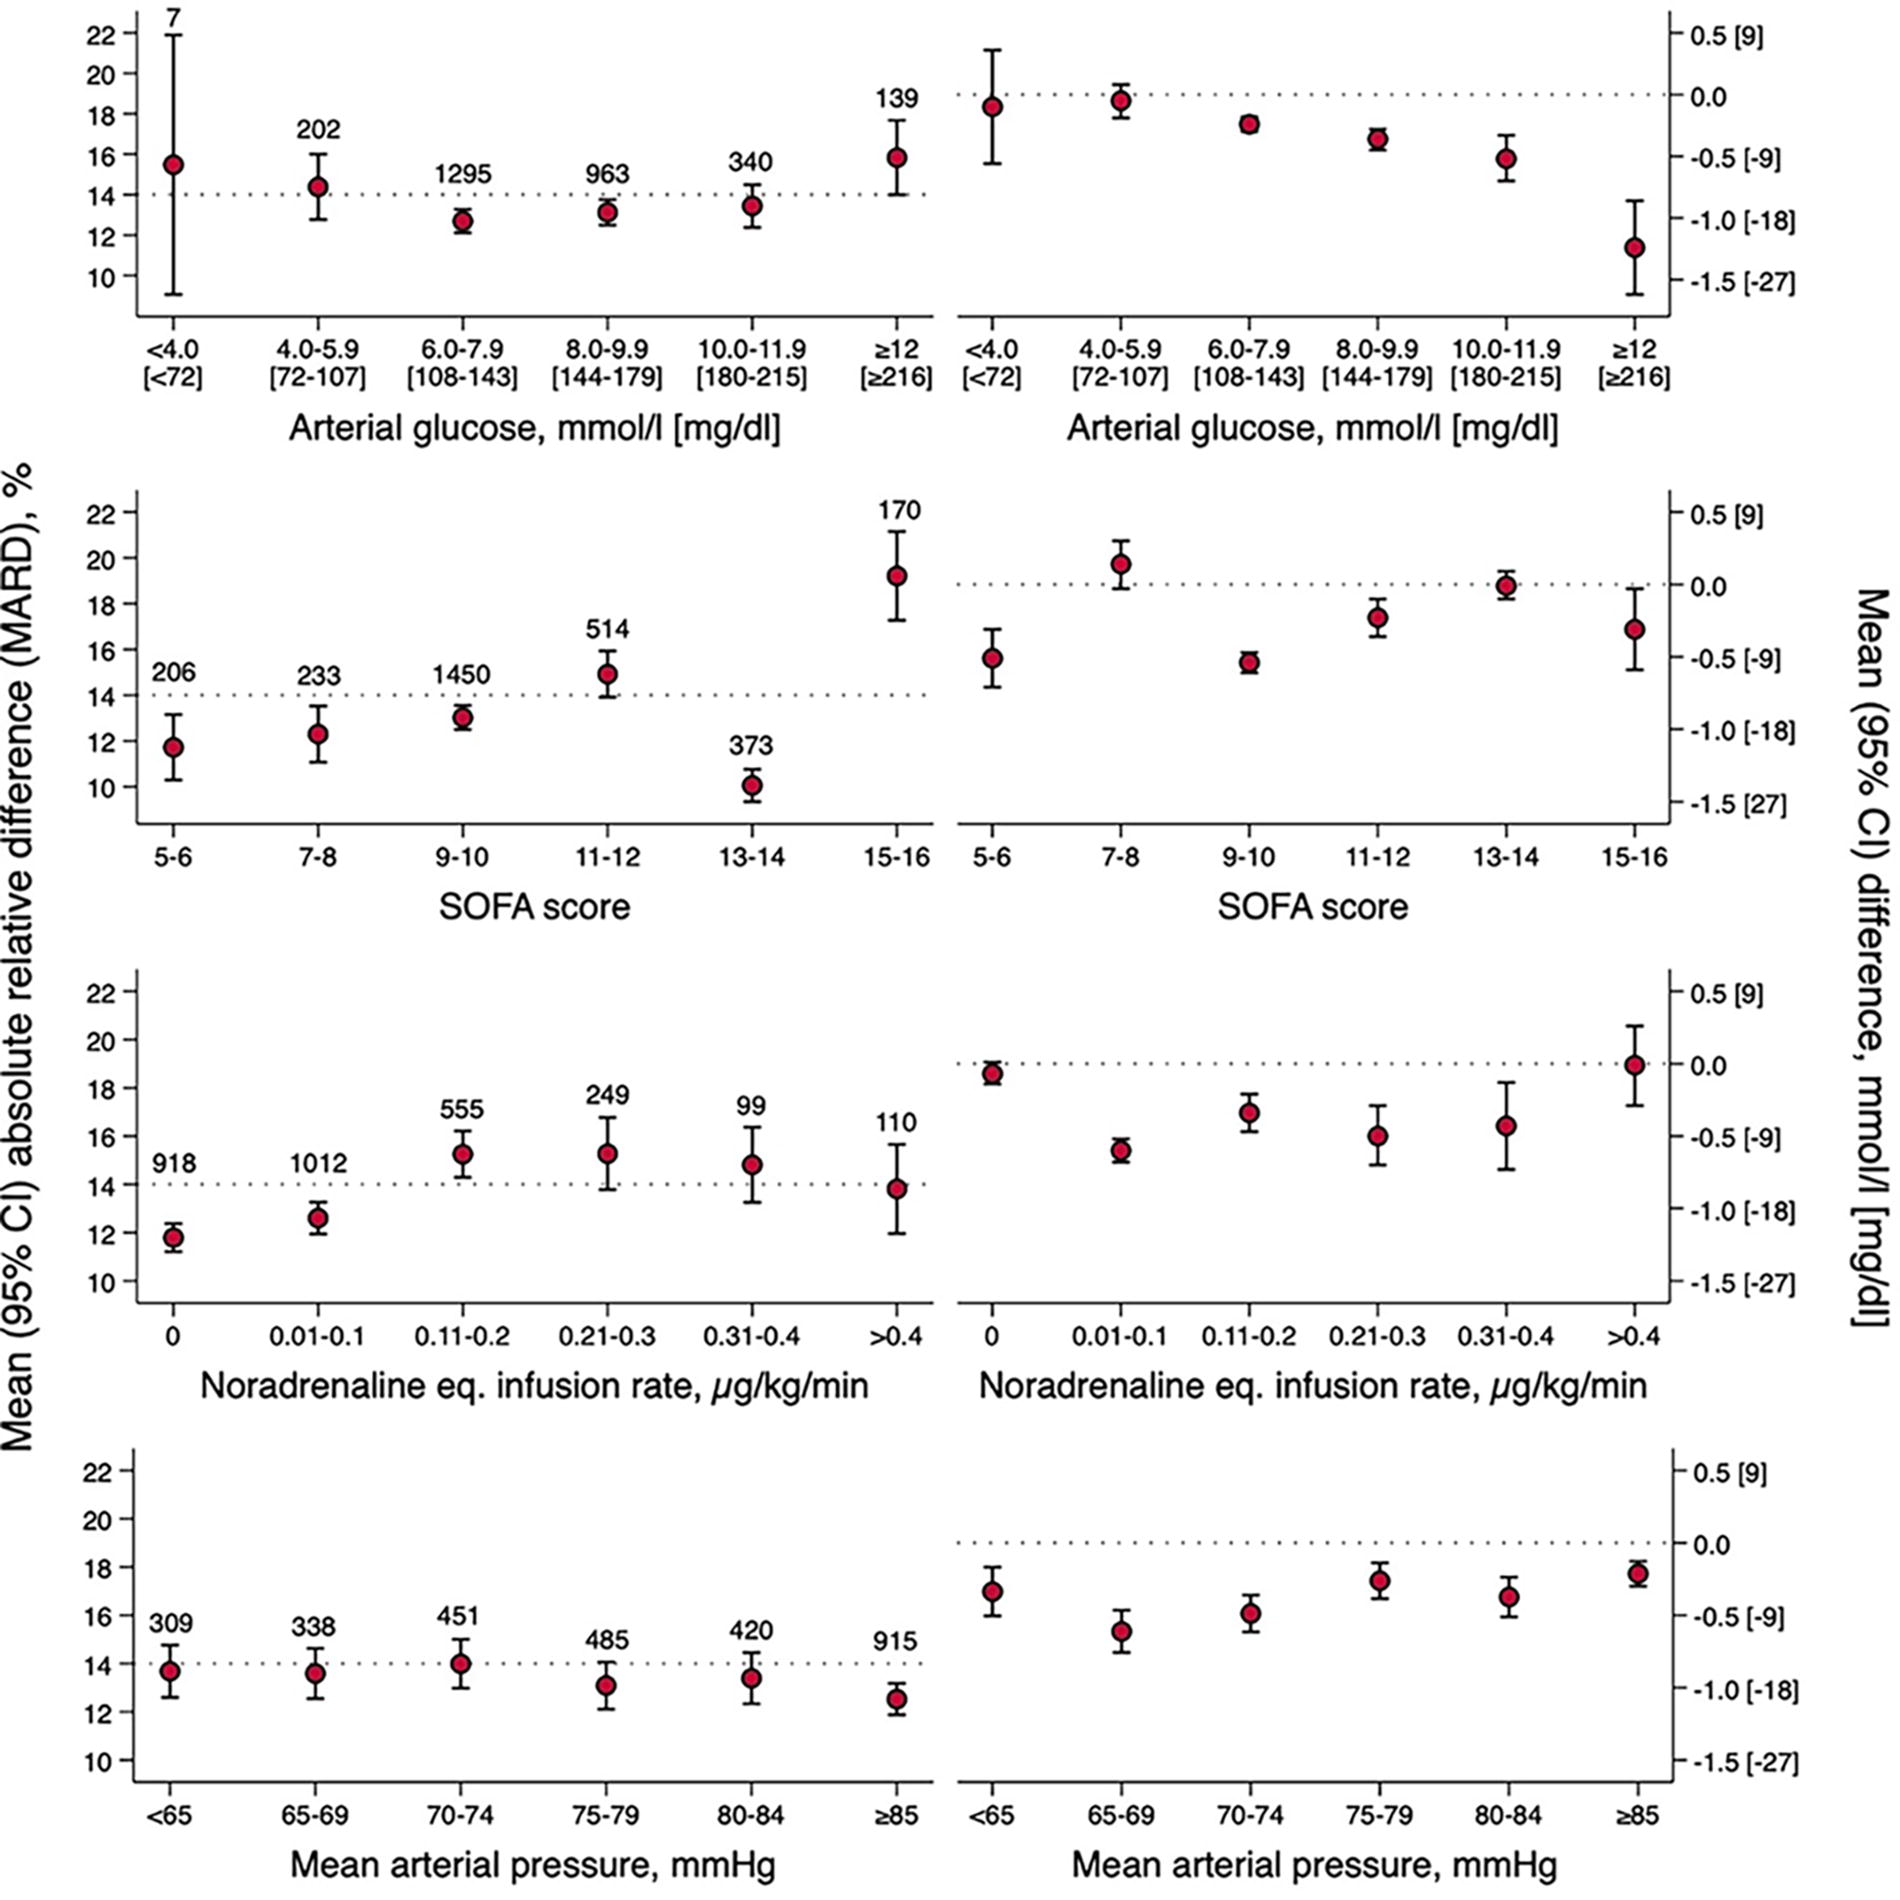
Mean (95% CI) absolute relative difference (MARD, left panel) and mean (95% CI) difference (right panel) between CGM values and arterial glucose values according to arterial blood glucose level, sequential organ failure assessment (SOFA) score, noradrenaline equivalent infusion rate, and mean arterial pressure levels. In the left panel, the dotted line represents the upper limit for acceptable MARD (14%). In the right panel, the dotted line represents zero difference between CGM and arterial glucose. The number of paired samples in each category is indicated in the graph.
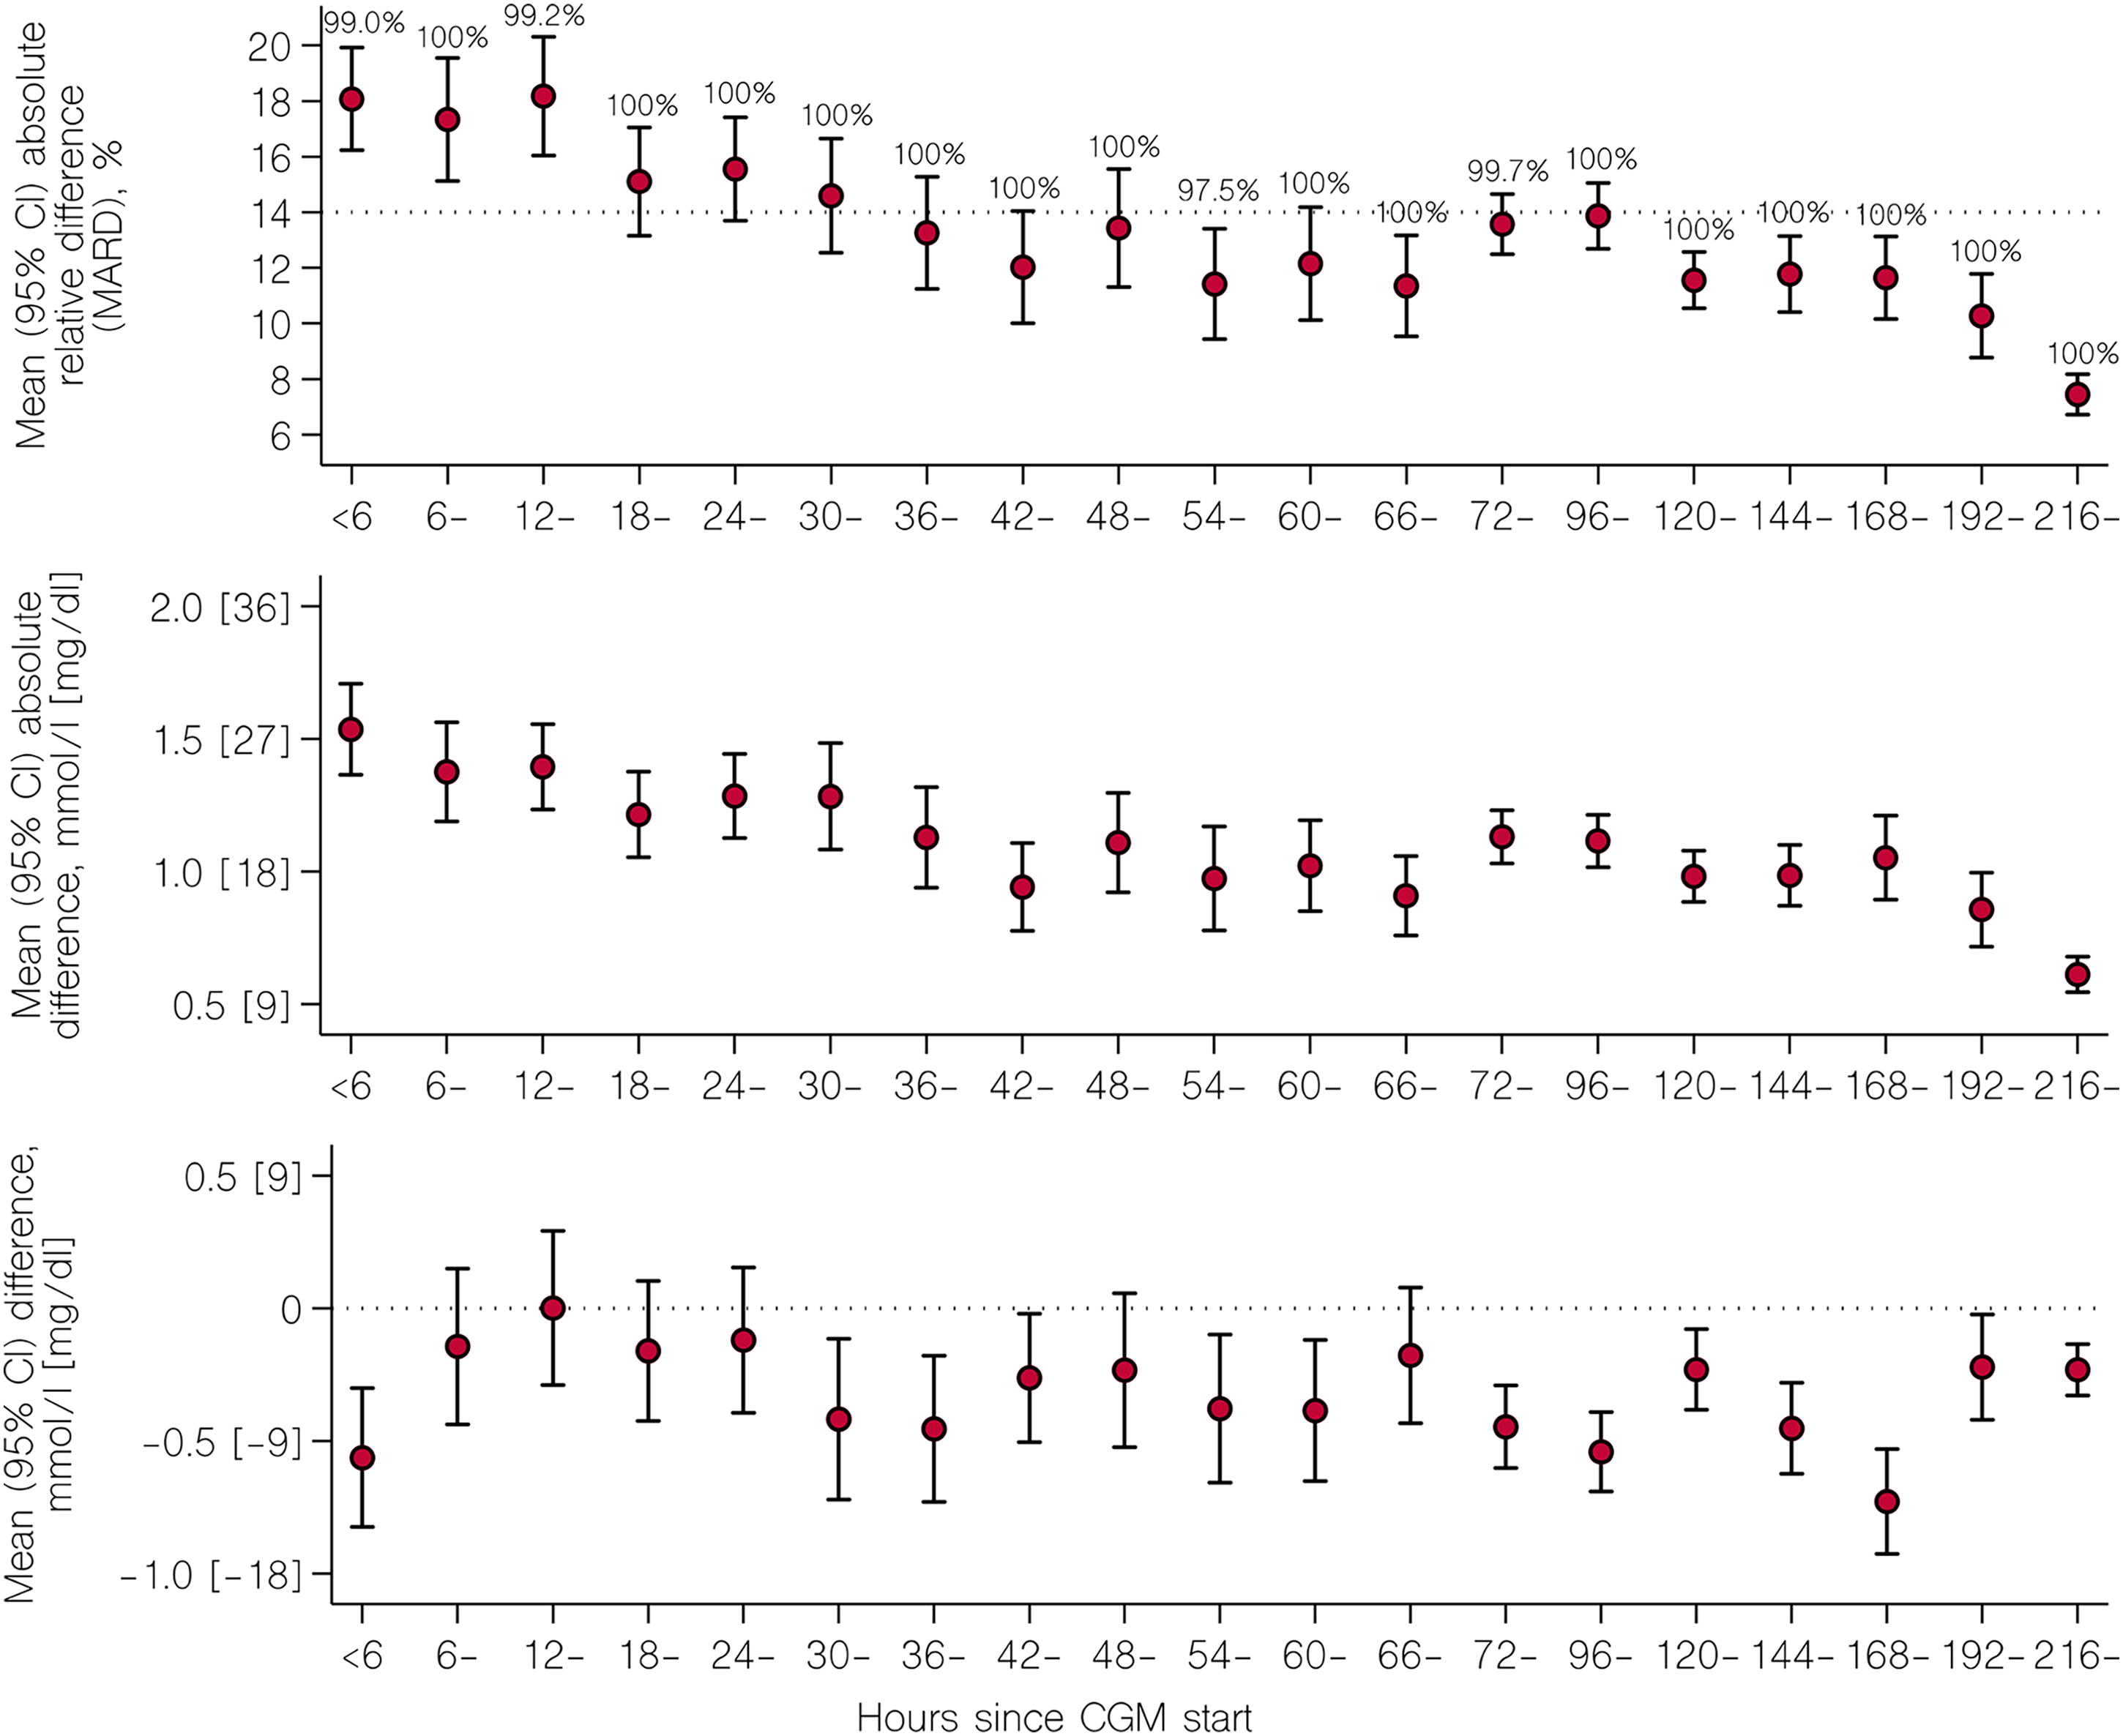
MARD (95% CI, upper panel), mean (95% CI) absolute difference (middle panel), and mean (95% CI) difference (lower panel) between CGM values and arterial glucose values according to time since CGM start (zero up to, but not including, 6 h; 6 up to, but not including, 12 h etc.). In the upper panel, the dotted line represents the upper limit for acceptable MARD (14%). In the lower panel, the dotted line represents zero difference between CGM and arterial glucose. The percentage of CGM values contained in Clarke error grid zones A and B in each time interval is indicated in the upper panel graph.
Discussion
Key findings
In this prospective, observational study, we assessed the performance of CGM in a cohort of ICU patients with multiple organ failure receiving insulin infusion and a range of vasopressor doses. During more than 200 CGM-days, sensor interruptions due to signal loss were negligible. Compared with routine ABG, CGM demonstrated acceptable numerical and clinical accuracy, as reflected by an overall MARD <14%, and by 99.8% of readings contained within CEG safe zones A and B. Inferior accuracy due to underestimation of ABG was observed when ABG was >12 mmol/L (216 mg/dL), and when noradrenaline equivalent doses exceeded 0.10 µg/kg/min. Finally, accuracy improved over time, reaching MARD values <14% after ∼36 h.
Relationship with previous studies
With almost 3000 paired samples obtained during more than 200 CGM-days, this is the largest study of the performance of CGM against ABG in critically ill patients receiving vasopressor therapy. Contemporary studies using the same sensor technology demonstrated MARD values between 10.4% and 13.9% 5 –9,22 which is consistent with the MARD of 12.7% observed in our study. Notably, we found 99.8% of values within Clarke error grid safe zones A and B, indicating better clinical accuracy than previously reported. 5,7,9,22
However, direct comparisons with previous studies are complex due to several key distinctions. First, our study encompasses a broader ICU patient cohort, unlike prior research that predominantly focused on critical COVID-19 cases. 5 –9 Second, there is variability in the reference glucose measurements among studies, with some lacking detailed methodology and others using a mix of arterial, capillary, and venous blood on portable glucometers. In contrast, we consistently measured ABG on a blood gas analyzer, which is the preferred reference modality in the ICU setting. 10 –12 Finally, the interaction between vasopressor therapy and CGM accuracy has been underexplored up to date. While studies in critical COVID-19, 8 during and after coronary artery bypass surgery, 22 and in mixed ICU cohorts 23,24 imply that CGM accuracy is unaffected by vasopressor use, these studies did not account for vasopressor dosage. Our study contributes by examining accuracy across a wide range of vasopressor doses, showing a slight increase in MARD at noradrenaline equivalent doses above 0.10 µg/kg/min.
Regarding glucose level stratification and accuracy, earlier findings are mixed. Consistent with our results, Faulds et al. identified a U-shaped relationship with the lowest MARD values at glucose ranges of 4–10 mmol/L (72–180 mg/dL). Conversely, other studies evaluating Dexcom or Libre sensors have reported higher accuracy above 10 mmol/L (180 mg/dL) than below this threshold. 7,9,24,25 Notably, existing studies, including ours, have insufficient power to provide robust analysis of accuracy during hypoglycemic episodes.
Implications of study findings
Our findings imply that subcutaneous CGM is feasible and provides acceptable accuracy when compared with routine ABG values in the ICU setting. However, CGM values should be confirmed with ABG testing when CGM readings increase above 12 mmol/L (216 mg/dL), to avoid excessive hyperglycemia, and when noradrenaline equivalent infusion rates exceed 0.10 µg/kg/min. In our study, we deemed a MARD below 14% as acceptable, acknowledging that this cutoff is opinion based 15 and exceeds outpatient recommendations. The specific MARD requirements may vary depending on the intended application. Within the ICU setting, CGM systems may offer timely alerts when blood glucose levels show signs of trending beyond acceptable ranges. In instances where such alerts necessitate confirmation through arterial glucose measurements before adjusting insulin doses, a slightly lower degree of point accuracy may be deemed acceptable. Moreover, given that arterial blood gas analyses are routinely performed to evaluate additional biomarkers such as lactate, electrolytes, and partial pressure of oxygen, CGM values will be periodically cross-checked with arterial glucose measurements.
Strengths and limitations
Our study has strengths. We assessed CGM in a previously unexplored population of ICU patients with multiple organ failure and a broad range of vasopressor doses. In addition, we used arterial blood gas glucose as reference method, which is the recommended modality in the ICU. 10 –12 Moreover, with almost 3000 paired samples obtained over more than 200 CGM-days, we were able to present CGM accuracy in relevant subgroups.
Our study has limitations. It was conducted at a single center, potentially limiting its external validity. However, it was performed in a large tertiary hospital and included a diverse cohort, making the findings likely relevant for ICU populations in similar settings. We studied relatively few patients. In addition, the number of paired values in the hypoglycemic range was low. The reported accuracy in this range should therefore be interpreted with caution. Furthermore, we had insufficient power to generate a reliable MARD during ECMO. Moreover, while we observed a potential association between higher vasopressor doses and inferior accuracy on a group level, the diverse individual responses suggest a more complex relationship. This individual variability may be attributed to the dynamic ICU environment, where several factors beyond vasopressor dose can influence CGM accuracy. Finally, the conventional methods utilized in our study for assessing CGM accuracy, including MARD, CEG, PCEG, and SEG analyses, do not consider the rate and direction of glucose changes. In response to this limitation, others have proposed a continuous glucose-error grid analysis (CG-EGA). 26 However, subsequent evaluations indicate that the results produced by CG-EGA can be challenging to interpret, reliant on selected time intervals, and may not offer a clear advantage over the combined application of traditional methods. 27
Conclusions
In our cohort of ICU patients receiving intravenous insulin infusion and vasopressor therapy, subcutaneous CGM demonstrated acceptable numerical and clinical accuracy, justifying further assessment of the effect of CGM-guided glucose control on patient-centered outcomes, glucose metrics, and nursing workload in clinical trials in this setting. A potentially lower accuracy should be considered outside glucose ranges of 6–10 mmol/L (108–180 mg/dL), during higher dose vasopressor therapy, and during the first 36 h after CGM initiation. To ensure safe utilization, we recommend confirming CGM values with arterial blood gas testing in these scenarios.
Footnotes
Acknowledgments
The authors thank the ICU staff at Karolinska Universitetssjukhuset for their assistance with bedside data recording and Arndís F. Ólafsdóttir for technical assistance. The authors also thank Research Nurse Viveca Hambäck Hellkvist for data collection.
Ethics Approval and Consent to Participate
This study was approved by the Swedish Ethical Review Authority (approval number 2020–03513 and 2024-01327-02). Delayed informed consent was obtained from the patient or next of kin.
Availability of Data and Materials
The data sets generated and analyzed during this study are not publicly available due to patient records’ regulations, but can be made available by corresponding author on reasonable request.
Authors’ Contributions
O.F., M.L., and J.M.: Conceptualization. O.F. and P.Z.: Patient recruitment and data collection. O.F., N.S., and J.M.: Statistical analyses. O.F. and J.M.: Writing the first draft. All authors edited the article. All authors read and approved the final article.
Author Disclosure Statement
M.L. has been consultant for Astra Zeneca, Boehringer Ingelheim, Eli Lilly, Nordicinfu care, and Novonordisk, and received research grants from Eli Lilly and Novonordisk, all outside the submitted work. All other authors have nothing to declare.
Funding Information
J.M. received financial support through the
Supplementary Material
Supplementary Figure S1
Supplementary Figure S2
Supplementary Figure S3
Supplementary Figure S4
Supplementary Figure S5
References
Supplementary Material
Please find the following supplemental material available below.
For Open Access articles published under a Creative Commons License, all supplemental material carries the same license as the article it is associated with.
For non-Open Access articles published, all supplemental material carries a non-exclusive license, and permission requests for re-use of supplemental material or any part of supplemental material shall be sent directly to the copyright owner as specified in the copyright notice associated with the article.