
Abstract
Background and Aim:
Glucagon-like peptide-1 receptor agonists (GLP-1 RA) therapy provides glycemic benefits to individuals with type 2 diabetes (T2D). However, the effects of GLP-1 RA therapy in combination with FreeStyle Libre systems (FSL) are unknown. This study aimed to compare changes in hemoglobin A1c (HbA1c) between people acquiring GLP-1 with FSL (GLP-1+FSL) versus GLP-1 without FSL (GLP-1).
Methods:
This real-world study used Optum’s de-identified Market Clarity Data, a linked electronic health records (EHR)-claims database, and included adults with T2D and HbA1c ≥8% who acquired their first GLP-1 RA medication between 2018 and 2022. GLP-1+FSL subjects acquired their first FSL within ±30 days of their first GLP-1 acquisition. Cohorts were matched 1:5 on baseline insulin therapy, age, sex, baseline HbA1c, and GLP-1 type. Paired changes in HbA1c were compared between unmatched and matched groups at 6 months.
Results:
The study included 24,724 adults in the unmatched cohort (GLP-1+FSL, n = 478; GLP-1, n = 24,246). The matched cohort included 478 GLP-1+FSL users and 2,390 GLP-1 users: mean age 53.5 ± 11.8 and 53.5 ± 11.3 years, HbA1c 10.25 ± 1.68% and 10.22 ± 1.69%, respectively. HbA1c reduction was greater in the GLP-1+FSL group compared with the GLP-1 group in the unmatched cohort (−2.43% vs. −1.73%, difference 0.70%, P < 0.001, respectively) and in the matched cohort (−2.43% vs. −2.06%, difference 0.37%, P < 0.001). GLP-1+FSL vs. GLP-1 treatment was associated with greater HbA1c reduction in the intensive insulin (−2.32% vs. −1.50%), nonintensive insulin (−2.50% vs. −1.74%), and noninsulin group (−2.46% vs. −1.78%), as well as in patients using semaglutide (−2.73% vs. −1.92%) and dulaglutide (−2.45% vs. −1.71%) GLP-1 RA, all P < 0.001.
Conclusions:
Adults with suboptimally controlled T2D, initiating GLP-1 RA with FreeStyle Libre, had greater improvement in HbA1c compared with those treated with GLP-1 RA only. These results suggest an additional glycemic benefit of FSL when used with a GLP-1 RA in T2D treatment.
Introduction
The proportion of individuals with diabetes who are achieving their self-management goals continues to decline. From 2014 to 2018, the proportion of those with HbA1c <7.0% decreased from 57.4% to 50.5%. 1 A similar decline in the proportion of individuals with diabetes achieving optimal blood pressure control (from 74.2% to 70.4%) and only minimal improvement in lipid control (from 52.3% to 55.7%) have also been reported. 1 During the same time period, only 22.2% of individuals achieved all three goals, 1 thereby increasing their risk for macrovascular and microvascular disease and mortality. 2 An estimated 20% of cardiovascular events and ∼45% of deaths with renal failure are attributable to diabetes. 3 In addition to its clinical consequences, the deterioration of diabetes management has led to a 21% increase in diabetes-related costs in the United States, from $347 billion in 2017 to $412.9 billion in 2022. 3
An acceleration in the development of new diabetes therapies has led to new classes of medications, such as glucagon-like peptide-1 receptor agonists (GLP-1 RA), which are available as once-daily oral formulations, or once- or twice-daily, or once-weekly injectables. In addition to significant improvements in glycemic control and reductions in hypoglycemia risk and body weight, 4 –7 findings from recent trials demonstrated the efficacy of these formulations in reducing cardiovascular death, all-cause death, nonfatal myocardial infarction, hospitalization for heart failure, and end-stage renal disease (ESRD). 8
While numerous studies have shown that the use of continuous glucose monitoring (CGM) is effective in improving overall glycemic control (e.g., reductions in HbA1c, increased time in target range) and reducing hypoglycemia risk in individuals treated with intensive insulin regimens, 9 –22 a growing body of evidence is demonstrating similar glycemic benefits in individuals treated with less-intensive insulin and noninsulin therapies. 23 –31 However, it is unknown if using CGM concurrently with GLP-1 RA therapy is associated with greater improvements in HbA1c.
We report findings from a large real-world study that assessed the impact of CGM use in type 2 diabetes (T2D) adults treated with a GLP-1 RA formulation in conjunction with intensive insulin, nonintensive insulin, or noninsulin therapies.
Methods
Study design and population
This real-world study used Optum’s de-identified Market Clarity Data, a linked EHR-claims database, to assess changes in HbA1c levels in T2D adults with suboptimally controlled glycemia who acquired their first GLP-1 RA medication and CGM device (FreeStyle Libre [FSL], Abbott Diabetes Care, Alameda, CA) between 2018 and 2022.
Inclusion criteria were age ≥18 years, T2D diagnosis, acquisition of a GLP-1 RA, initiating CGM use with an acquisition of an FSL device within ±30 days of the first GLP-1 RA acquisition (GLP-1+FSL cohort only), baseline HbA1c ≥8%, presence of 6-month follow-up HbA1c measurement, and ≥180 days of continuous prescription and medical coverage before first GLP-1 RA prescription. Individuals whose first CGM acquired was a CGM manufactured by Dexcom (Dexcom, Inc. San Diego, CA), or Medtronic (Medtronic, Inc. Minneapolis, MN) or were diagnosed with type 1 diabetes (T1D) or gestational diabetes (GDM) during the observation period were excluded.
International Classification of Diseases, 10th Revision (ICD-10) codes were used to identify patients diagnosed with T1D, T2D, or GDM. The presence of comorbidities was identified from the 180 days before the index through the index date using ICD-10 codes. National Drug Code (NDC) was used to identify patients who had an FSL, non-Abbott CGM, or GLP-1 RA acquisition. NDC data within the 6 months before the first GLP-1 RA prescription were also used to determine the presence and type of insulin usage. Individuals with short-acting, rapid-acting, or pre-mix insulin were assigned to the intensive insulin group.
The initial analysis included all individuals who met the inclusion criteria. Individuals who acquired an FSL within ±30 days of their first GLP-1 acquisition were identified as the GLP-1 plus FSL cohort (GLP-1+FSL). Individuals with no CGM were identified as the GLP-1-alone cohort (GLP-1). For additional analysis, the GLP-1+FSL group was matched with a 1:5 ratio to the GLP-1 group on age, sex, baseline HbA1c, insulin type, and first GLP-1 RA medication formulation. Paired changes in HbA1c were compared between unmatched and matched groups at 6 months. A schematic of the study design is presented in Figure 1.
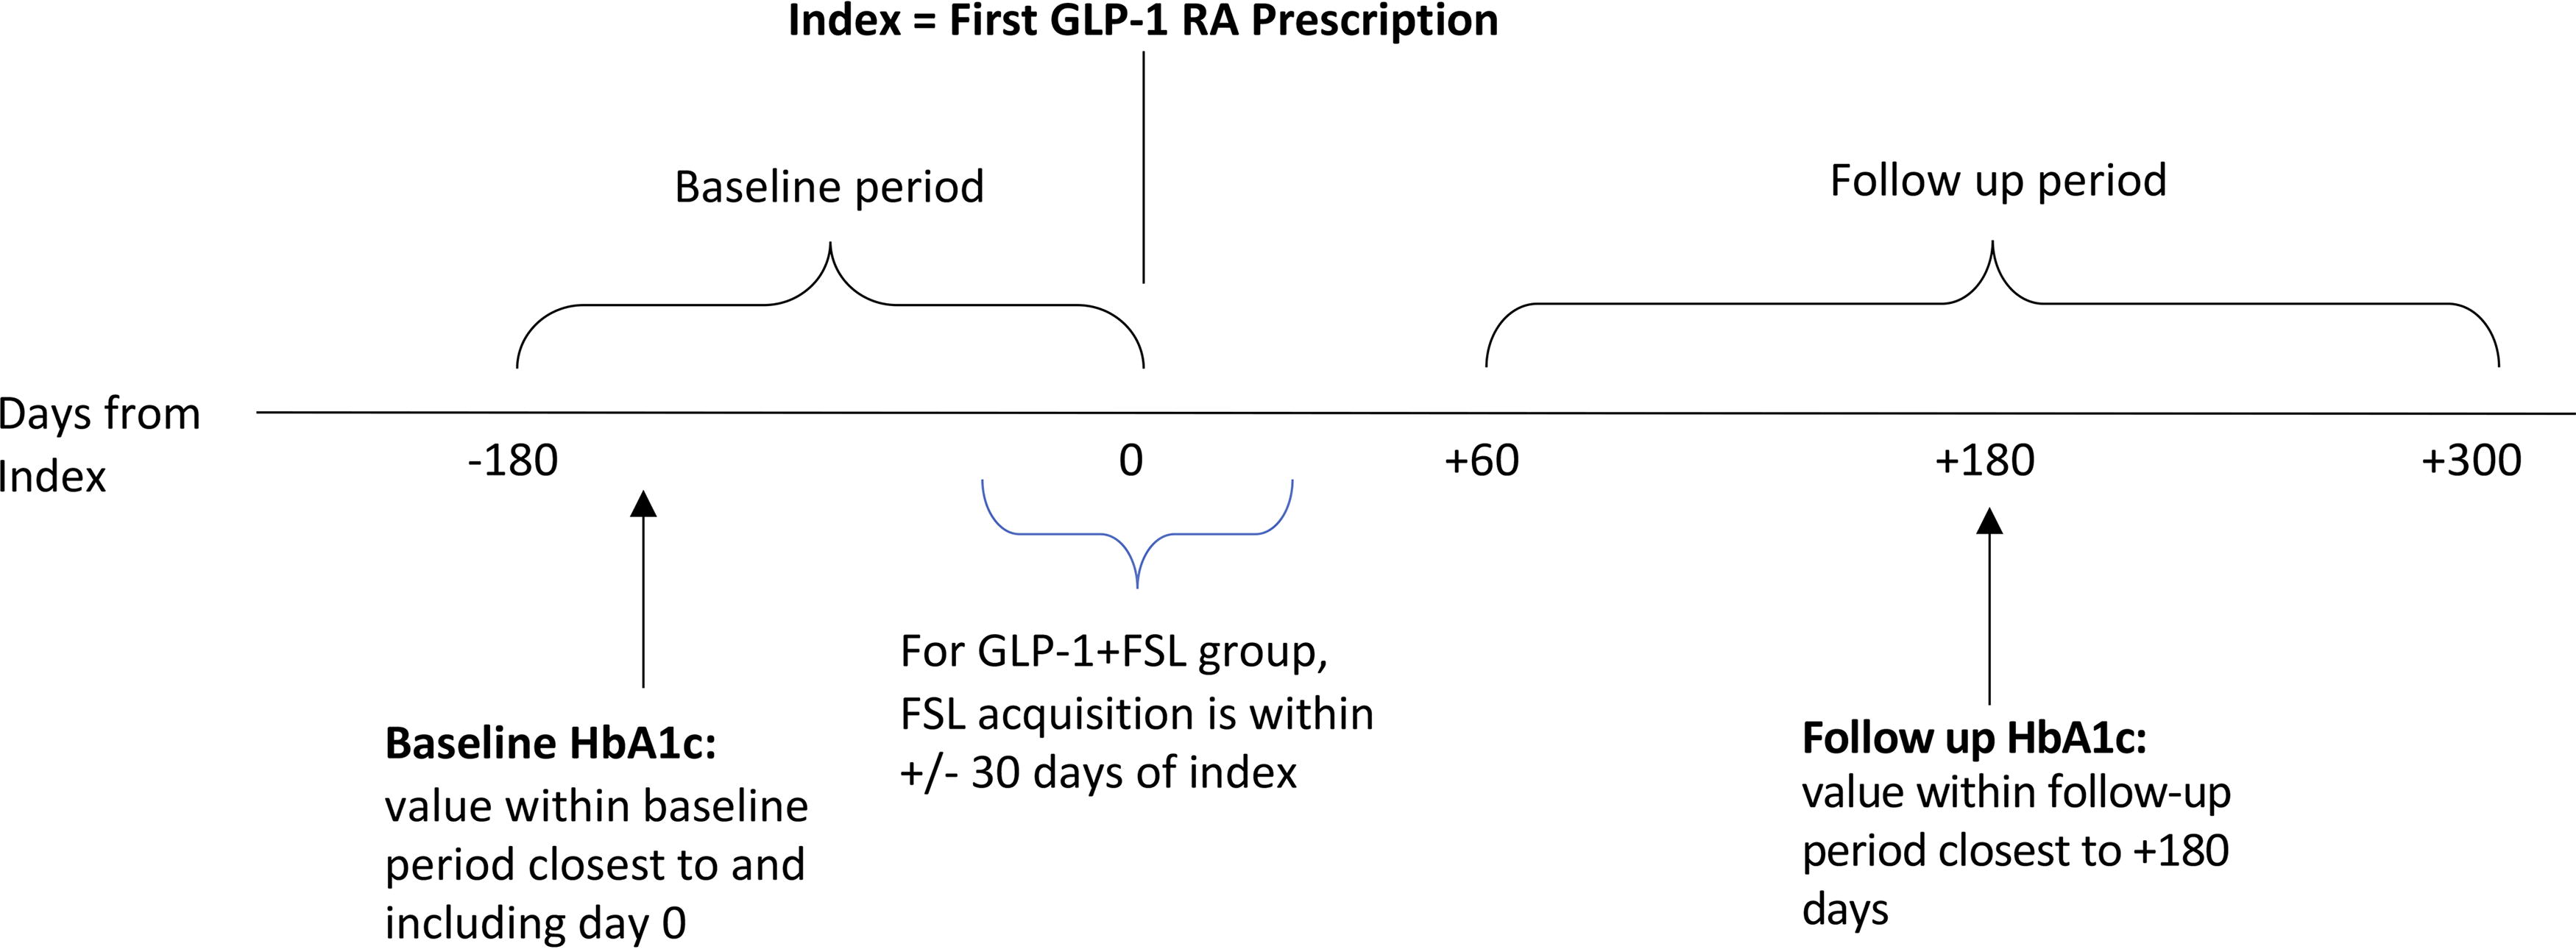
Schematic of study flow.
Outcome measures
The primary outcome was the comparison of the change in HbA1c from Day 0 (baseline) to +180 days between the GLP-1+FSL and GLP-1 cohorts. The pre-GLP-1 HbA1c measurement closest to and including the index date (Day 0) was used as the baseline value. The HbA1c measurement closest to Day +180 was used as the follow-up value. In the unmatched cohort, subgroup analyses were performed to assess differences in HbA1c reductions based on insulin therapy (intensive insulin, nonintensive insulin, and non-insulin) and GLP-1 RA formulation.
Statistical analysis
Baseline characteristics between GLP-1+FSL and GLP-1 cohorts were compared with t-tests for continuous variables and chi-squared tests for categorical variables. Changes between the baseline (Day 0) and follow-up (Day +180) HbA1c values within each cohort were evaluated with paired t-tests. Difference-in-difference was used to compare changes in HbA1c between groups.
Propensity-score matching of the GLP-1+FSL and GLP-1 cohorts was performed at a 1:5 ratio using multivariable logistic regression with age, sex, baseline HbA1c, and first GLP-1 RA medication formulation. Matching was done without replacement using a greedy nearest-neighbor matching algorithm and exact matches on baseline insulin therapy type. After matching, balance between covariates was evaluated with t-tests, chi-squared tests, and standardized mean difference (SMD), where less than 0.1 was considered as achieving adequate balance.
RStudio version 2023.6.0.421 (Boston, MA) with R version 4.3.0 was used for statistical analysis.
Results
Unmatched cohorts
Study population characteristics
Before propensity score matching, we identified 24,724 T2D adults (GLP-1+FSL, n = 478; GLP-1, n = 24,246) who met the inclusion criteria. Baseline differences between GLP-1+FSL vs. GLP-1 patients were observed as shown in Table 1. The GLP-1+FSL cohort was younger, with higher percentages of male patients, insulin users, and obesity. The GLP-1+FSL users also had a higher baseline HbA1c compared with GLP-1 users.
Baseline Characteristics: Unmatched Cohort
FSL, FreeStyle Libre systems; GLP-1 RA, glucagon-like peptide-1 receptor agonists; SD, standard deviation.
Changes in HbA1c: Unmatched cohort
Significantly greater HbA1c reductions from baseline to +180 days were observed among GLP-1+FSL users versus GLP-1 RA users (−2.43% vs. −1.73%, difference 0.70%, P < 0.001, respectively) (Fig. 2).
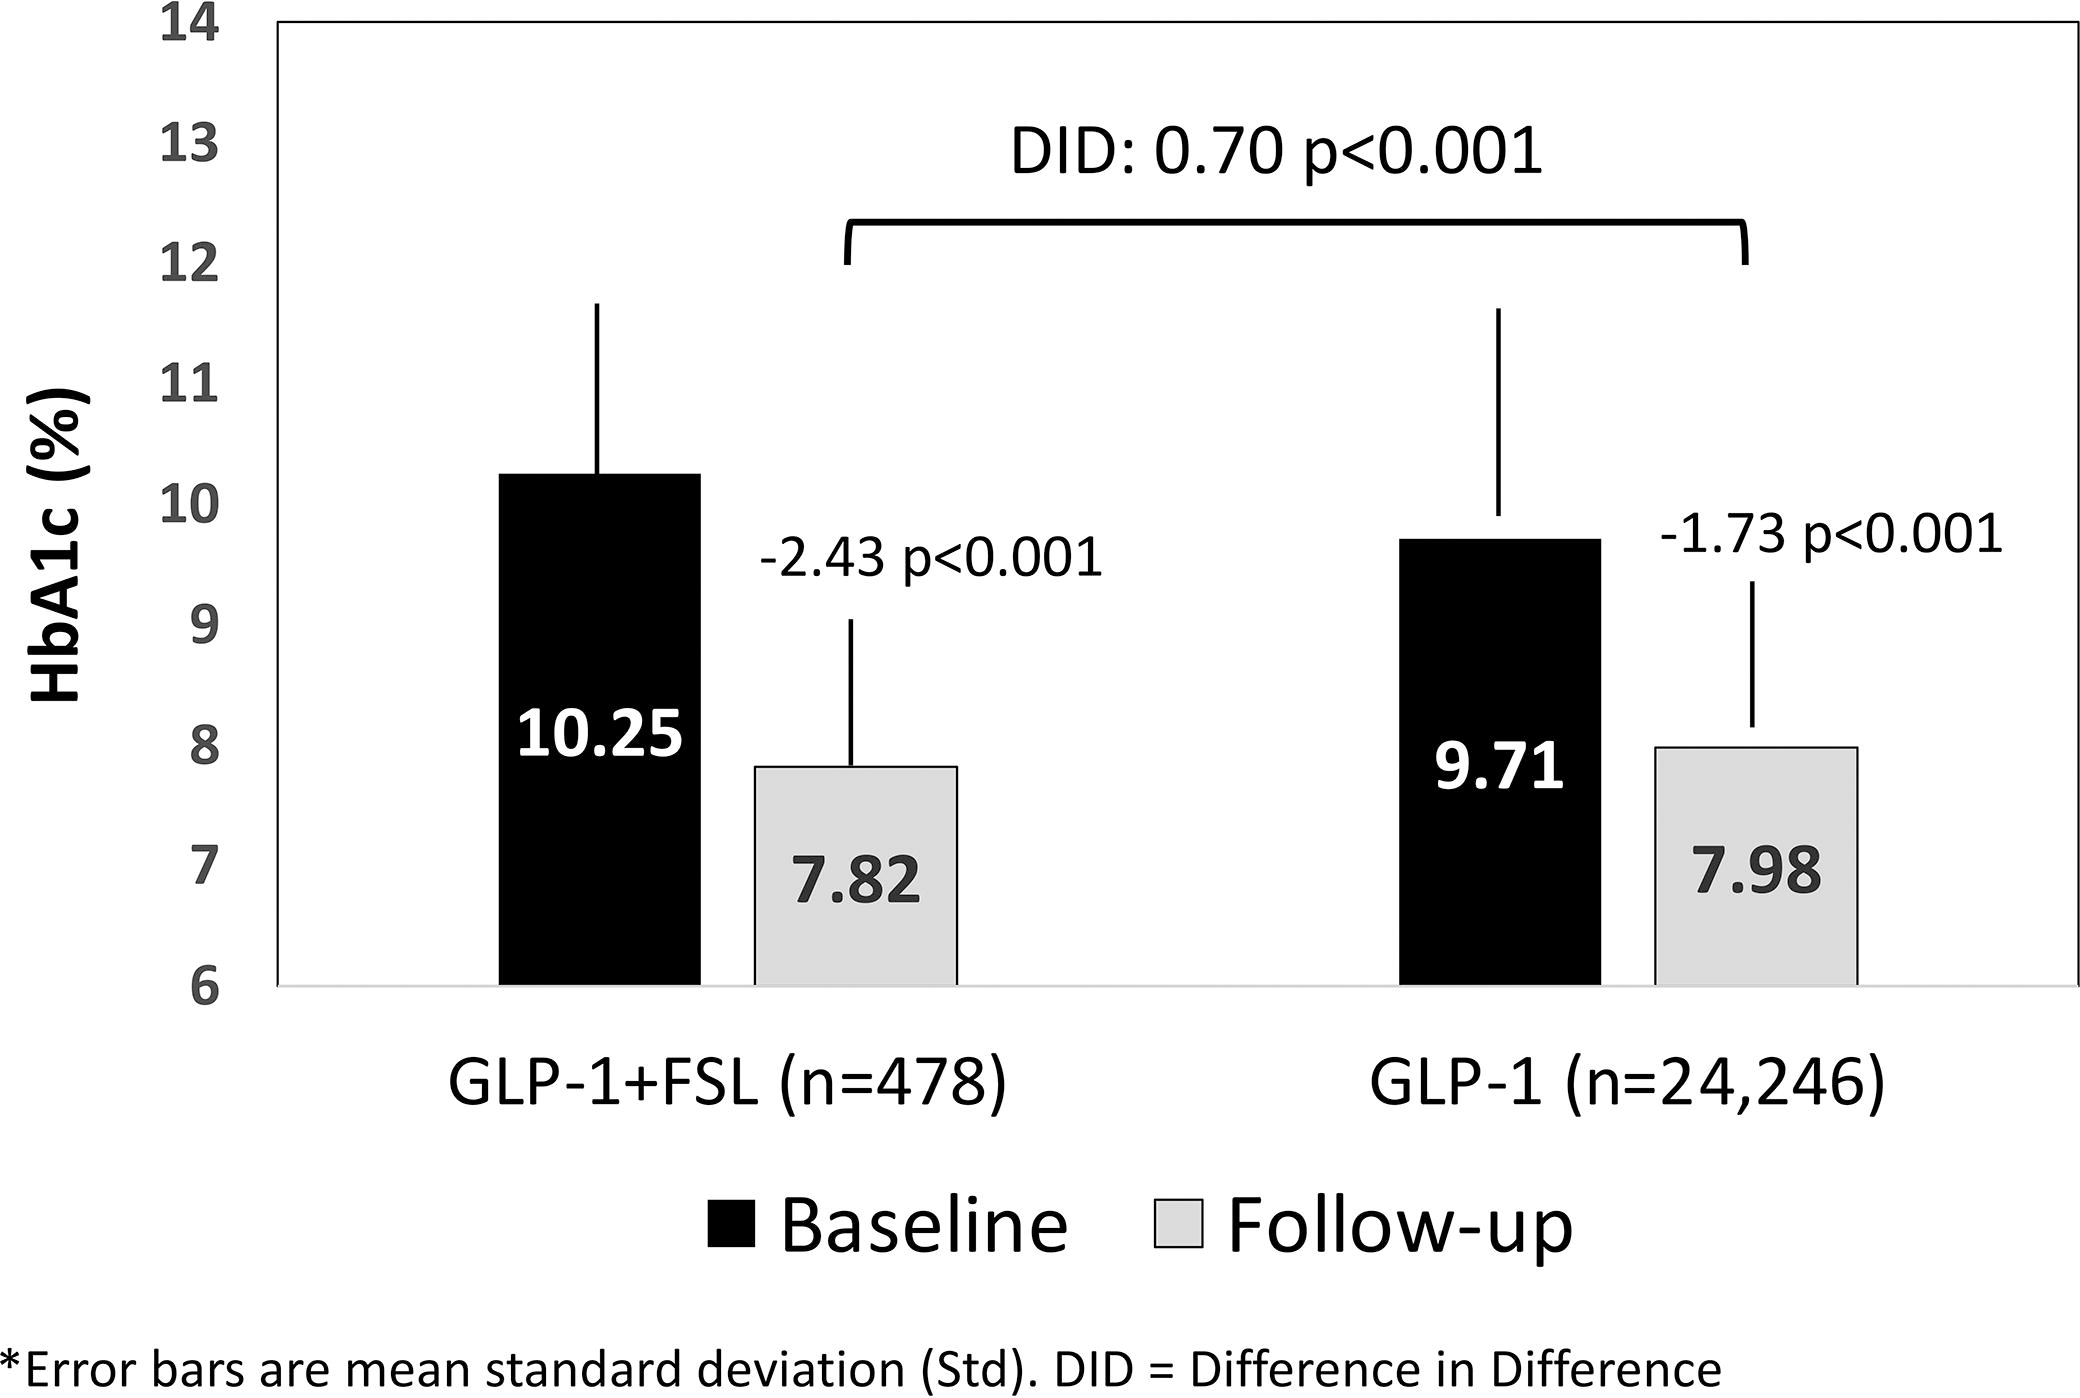
Change from baseline HbA1c at follow-up: unmatched cohort.
Matched cohort
Study population characteristics
After propensity score matching, all baseline covariates were balanced between the GLP-1+FSL and GLP-1 patients (SMD < 0.1). The matched cohort consisted of 478 GLP-1+FSL patients and 2,390 GLP-1 patients. Baseline characteristics of the matched cohorts are presented in Table 2.
Baseline Characteristics: Matched Cohort
FSL, FreeStyle Libre systems; GLP-1 RA, glucagon-like peptide-1 receptor agonists; SD, standard deviation.
Changes in HbA1c: Matched cohort
Similar to the unmatched cohort, significantly greater HbA1c reductions from baseline to +180 days were observed among matched GLP-1+FSL vs. GLP-1 users (Fig. 3). For GLP-1 users, baseline HbA1c was higher in the matched versus unmatched cohort, and the subsequent reductions in HbA1c were also, respectively, larger. In addition, the proportion of GLP-1+FSL users that reached a follow-up HbA1c of <8% was significantly greater than GLP-1 users (59.8% [286/478] vs. 53.8% [1,285/2,390], P = 0.017). No difference was observed in the percentage of GLP-1+FSL versus GLP-1 patients who achieved a follow-up HbA1c of <7.0% (31.8% [152/478] vs. 28.3% [677/2,390], P = 0.141).
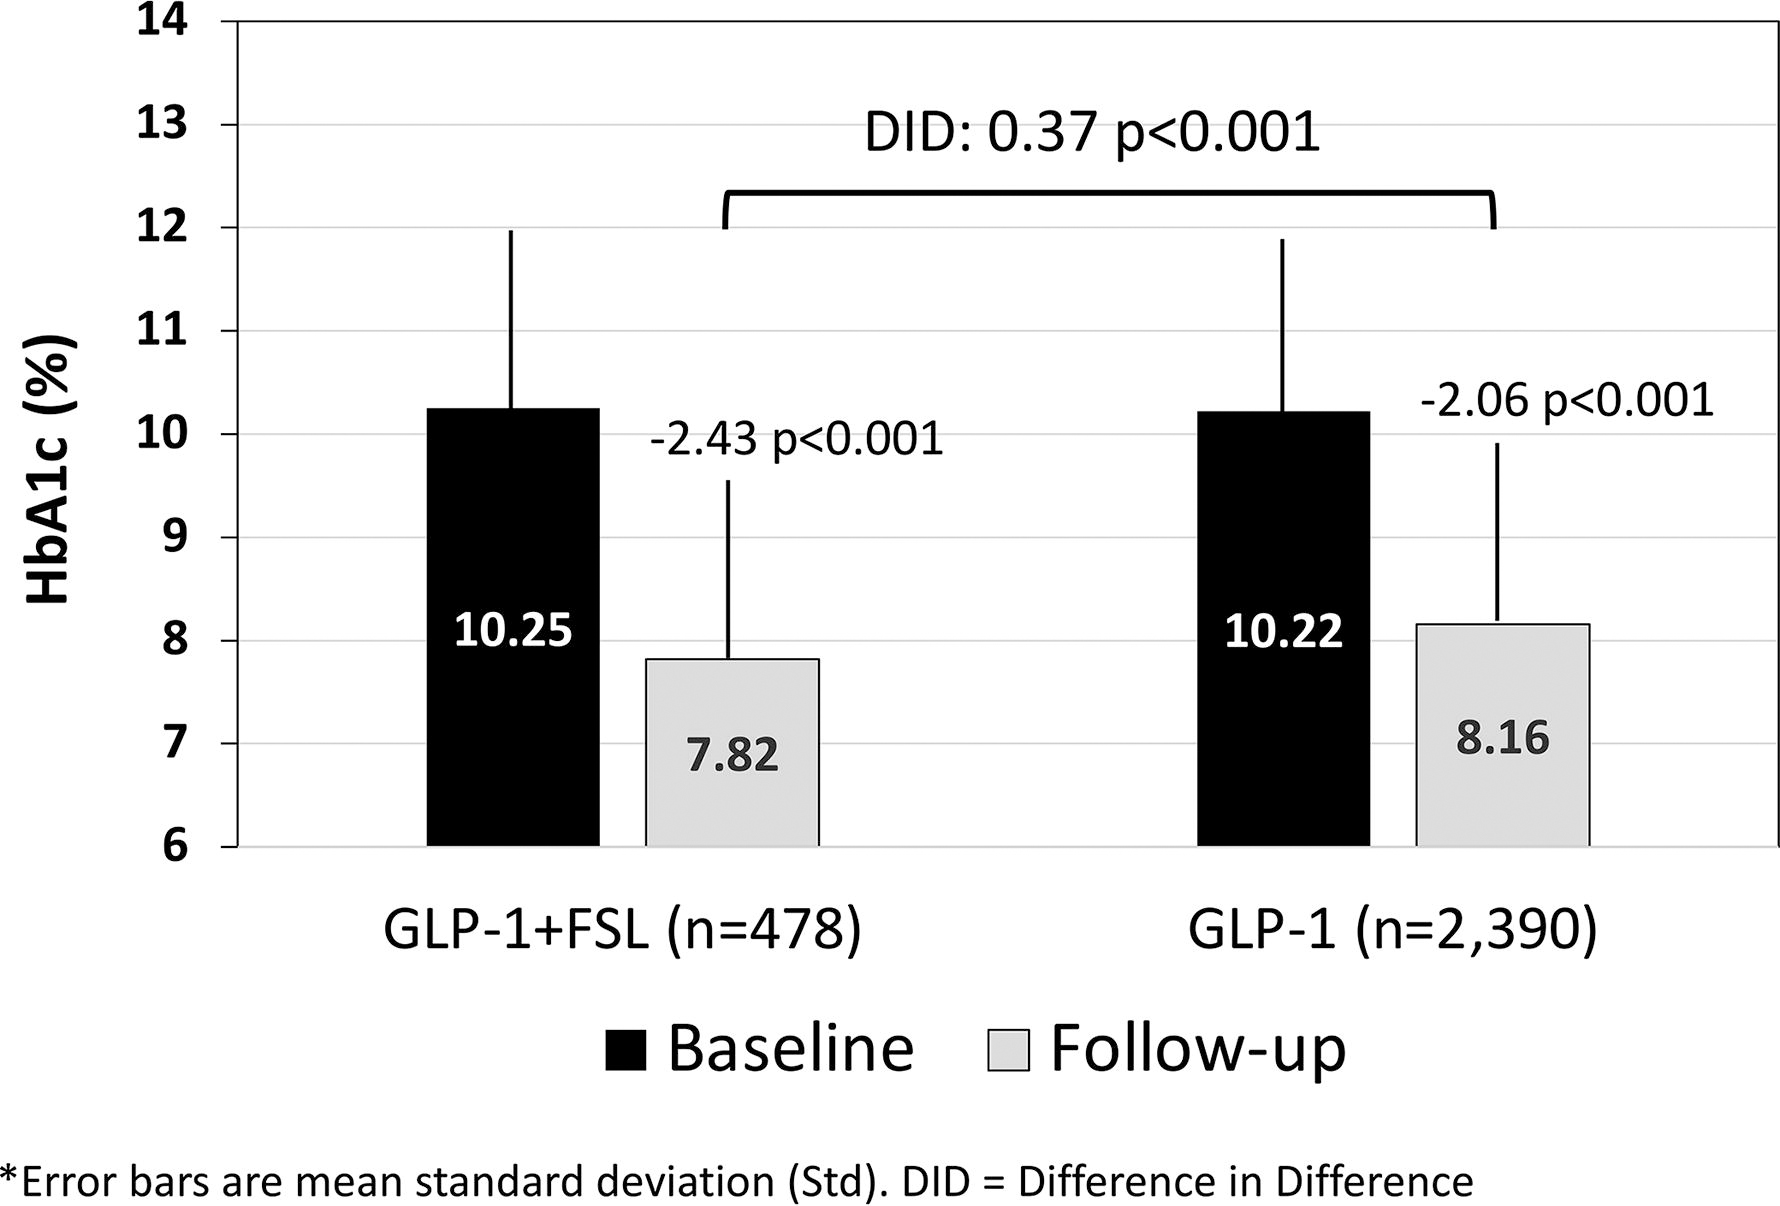
Change from baseline HbA1c at follow-up: matched cohort.
Subgroup analyses
HbA1c changes by insulin therapy group: Unmatched cohort
The HbA1c reductions associated with GLP-1+FSL usage were significantly greater compared with GLP-1 alone in all three insulin therapy groups (Fig. 4). For both GLP-1 and GLP-1+FSL users, those with nonintensive insulin or no insulin experienced the largest HbA1c reductions.
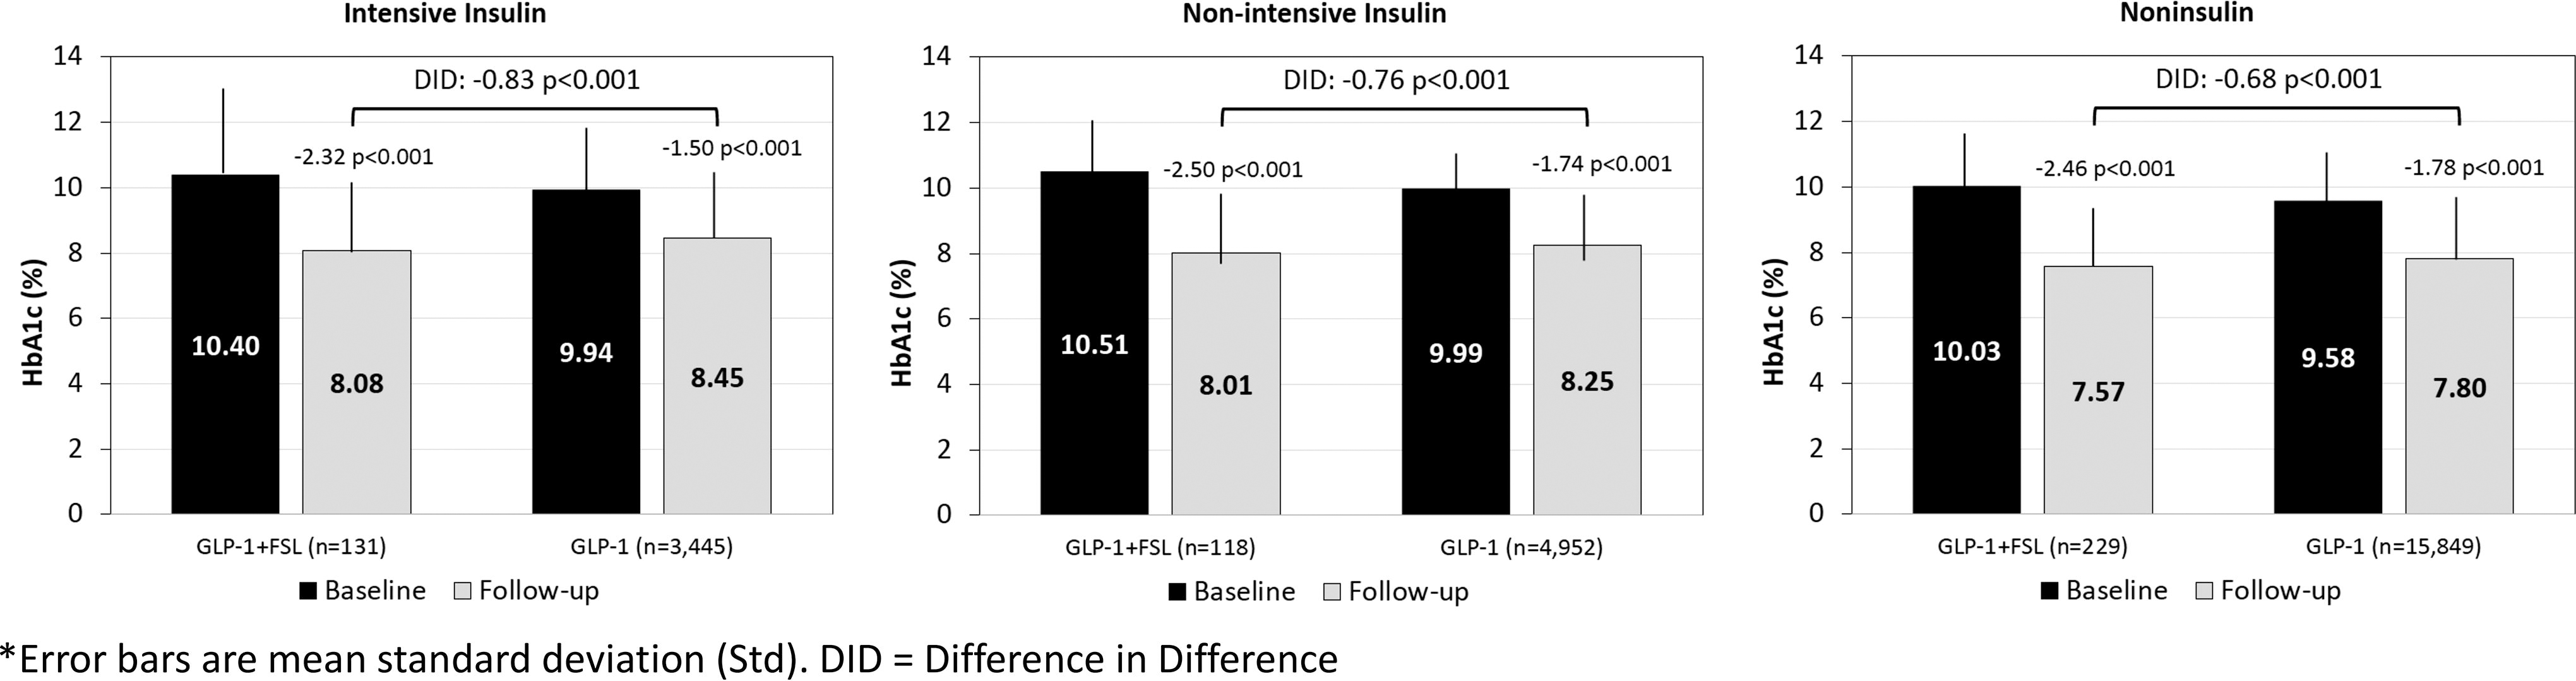
Change in HbA1c by insulin therapy group: unmatched cohort.
Changes in HbA1c by first GLP-1 RA formulation: Unmatched cohort
Most individuals in the study used either dulaglutide or semaglutide as their primary GLP-1 RA therapy, with a small proportion using other types of GLP-1. In subgroups based on the first GLP-1 RA type, GLP-1+FSL users experienced significantly larger reductions in HbA1c compared with GLP-1 users in both dulaglutide and semaglutide groups. For those prescribed other GLP-1 RA medications, the difference in HbA1c reduction did not achieve statistical significance between GLP-1+FSL and GLP-1 users (Fig. 5).
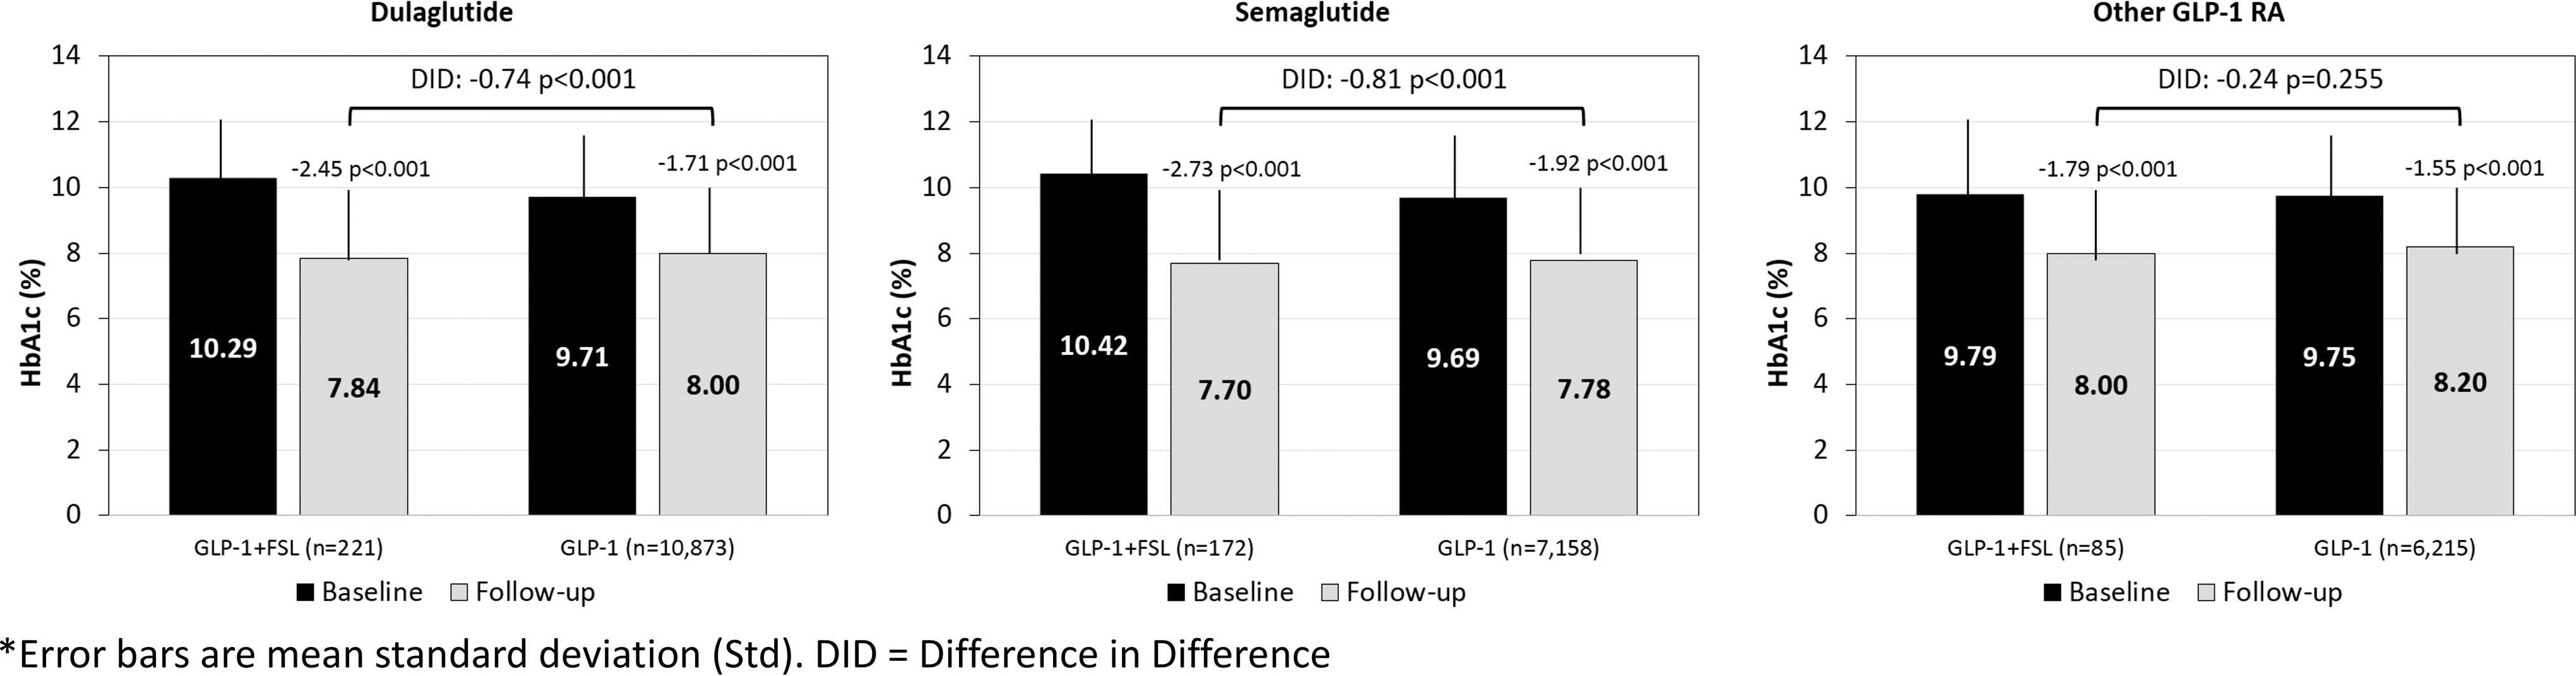
Change in HbA1c by first GLP-1 RA formulation: unmatched cohort. GLP-1 RA, glucagon-like peptide-1 receptor agonists.
Discussion
Recent retrospective, observational studies have demonstrated the benefits of CGM and FSL use in patients treated with intensive insulin therapies, nonintensive insulin regimens, and noninsulin medications. 12,23 –32 Current American Diabetes Association (ADA) Standards of Care recommend GLP-1 receptor agonists for individuals with T2D with elevated risk or current cardiovascular disease (CVD) or the clinical need to reduce body weight. 33 However, studies that specifically investigated concomitant use of CGM in a large population of T2D adults treated with GLP-1 have been lacking.
To our knowledge, this is the first large observational study to investigate the impact of CGM use in a large population of T2D adults treated with GLP-1. Our findings showed that people who used FSL together with GLP-1 had significantly greater reductions in HbA1c as compared with those who used GLP-1 alone. The findings were confirmed in both matched and unmatched cohorts. Moreover, the GLP-1+FSL patients had a greater HbA1c reduction in all three treatment groups (intensive insulin, nonintensive insulin, and noninsulin) and in patients using either semaglutide or dulaglutide GLP-1 formulation.
Because the Optum dataset does not provide information about patient or clinician behavior, we can only speculate on the potential drivers of additional glycemic improvement in the FSL+GLP-1 study cohort. For example, some patients may have been motivated to modify their behaviors (e.g., dietary intake, physical activity, and adherence to medications) in response to the continuous feedback they received throughout the day from their CGM data. In other patients, periodic retrospective analysis may have prompted clinicians to intensify therapy by adding a second or third medication, such as a sodium-glucose cotransporter-2 inhibitors (SGLT-2i) or basal insulin therapy. The HbA1c reductions we observed may also be related to the significant weight loss associated with GLP-1 RA therapy. As observed by Kong et al., the metabolic benefits of these medications include glucose reductions, decreased insulin resistance, and increased insulin sensitivity. 34 It is quite likely that these improvements resulted from a combination of these factors or other unknown factors with varying levels of influence. Additional research that investigates the various behavioral influences of GLP-1 RA therapy in conjunction with CGM is needed to answer this question.
Despite a growing number of studies that are reporting the glycemic benefits of CGM use in individuals treated with noninsulin medications, 23,28,31,35 –41 many insurers, private and commercial, do not cover CGM in the noninsulin-treated T2D population. This deficit in coverage is particularly relevant to individuals treated with GLP-1 RA medications, considering the frequency of discontinuation of therapy. 6,42,43 A recent investigation by Weiss et al. observed a discontinuation rate of 70.1% at 24 months. 42 More recently, Husain et al. reported findings from an analysis of 15,111 T2D adults who initiated GLP-1 RA therapy and found that 52.2% of patients had discontinued treatment at the end of the 12-month observation period. 44
Intolerance of the side effects of GLP-1 RA medications is often cited as a contributing factor for discontinuing therapy. 45,46 However, perhaps the most important factor is diminishing efficacy in maintaining optimal glucose control. As observed in a cohort of 620 T2D adults with HbA1c levels <7.5%, Jones et al. found a significantly reduced glycemic response to GLP-1 RA therapy in individuals with severe insulin deficiency. 47 Because some of the effect of GLP-1 RA medications is dependent upon beta-cell function and insulin availability, the ability to sustain optimal glycemic control is impacted by the progressive nature of T2D. 48,49
Whatever the reason, discontinuation of GLP-1 RA therapy has significant consequences. In addition to losing the cardiorenal protective benefits, individuals who discontinue therapy gain back much of the weight they had lost during therapy. 50 In an extension of the randomized STEP 1 trial, Wilding et al. observed 17.3% mean weight loss among patients treated with semaglutide compared with 2.0% among the placebo cohort. 51 Following discontinuation of treatment, semaglutide and placebo patients regained 11.6% and 1.9% of body weight, respectively. Investigators reported that weight loss over the 48-week follow-up period was significantly greater among those who continued therapy (−7.9%) compared with a 6.9% weight increase among patients who were switched to placebo (P < 0.01).
Although a recent study found that many individuals reinitiated GLP-1 RA during the first year following discontinuation, 52 which was likely because of the subsequent weight gain experienced during the hiatus, one may assume that without frequent glucose monitoring, deterioration of glycemic control went undetected. The findings of this study support the hypothesis that being able to see one’s glucose data may reinforce GLP-1 RA adherence and persistence as patients can see glucose control decline with poor adherence. We did not assess adherence and persistence; future studies can evaluate this hypothesis. However, our findings are consistent with previous studies that report significant HbA1c reductions in individuals with high HbA1c levels at baseline. 23,53 For example, Wright et al. conducted a retrospective, observational analysis of the Explorys commercial databases to assess the impact of FSL use in 1,034 poorly controlled T2D adults (baseline HbA1c 10.1%) treated with basal insulin (n = 306) or noninsulin therapy (n = 728). 23 After 6 months of FSL use, HbA1c reductions were 1.5 ± 2.2% overall, 1.1 ± 1.9% in basal insulin users, and 1.6 ± 2.3% in noninsulin-treated persons.
A key strength of our study was the use of the Optum de-identified Market Clarity Data database, which allowed us to track changes in our cohort over time, using standardized records to detect and compare changes in HbA1c levels pre- and post-acquisition of the FSL device without reliance on self-reported data. Moreover, our findings are likely generalizable to the vast majority of individuals with T2D who are treated with nonintensive treatments and have poorly controlled HbA1c.
However, some limitations of the study are notable. While we detected difference in HbA1c reduction between FSL users and nonusers, we could not ascertain the reasons for the difference. For example, we could not reliably assess adherence to GLP-1 RA as the prescribing schedule and titration progress are likely to vary by individual. For CGM devices, it was also difficult to ascertain adherence over a relatively short 6-month follow-up period, as people typically get a 3-month supply of sensors per claim. In addition, information about changes to diet and exercise and the use of CGM data by the patient and clinician were not available. It is possible that confounding factors may explain some of the difference in HbA1c reductions. For example, FSL may have been given more often to people with worse glucose control. As shown in Table 1, in the unmatched comparison, the GLP-1+FSL had a higher HbA1c at baseline than the GLP-1 group (10.25% vs. 9.71%, respectively) albeit both groups were in poor glycemic control. However, upon matching the two groups on covariates including baseline HbA1c, the GLP-1+FSL cohort had greater reduction in HbA1c compared with the GLP-1 cohort. Also, even though GLP-1 RA is known to have an impact on weight, it was not possible to correlate weight loss with glycemic changes as most subjects did not have weight recorded at both baseline and follow-up. In addition, the database did not provide information about changes in CGM metrics. Lastly, tirzepatide, a new gastric inhibitory polypeptide (GIP)+GLP-1 therapy for diabetes, could not be included in this analysis as it became commercially available in 2023. Nevertheless, our findings support the use of FSL in individuals treated with GLP-1 RA therapy in combination with insulin and noninsulin therapies as FSL use was shown to be associated with clinically and statistically significant reductions in HbA1c.
Conclusions
In this real-world, retrospective, observational study, adults with suboptimally controlled T2D, initiating GLP-1 RA with FSL, had greater improvement in HbA1c compared with those treated with GLP-1 RA only. This finding was seen in those on intensive insulin therapy, nonintensive insulin therapy, and noninsulin medications. Moreover, greater HbA1c reduction with FSL was seen in patients using either semaglutide or dulaglutide GLP-1 RA formulation. This suggests that concomitant use of CGM with GLP-1 therapy may have an additive effect in helping patients achieve their glycemic targets. Additional studies on the use of CGM in patients treated with GLP-1 RA therapy are needed to investigate the veracity of our findings and possibly explain the link between CGM use and better outcomes with GLP-1 RA therapy.
Footnotes
Acknowledgments
The authors wish to thank Christopher G. Parkin, MS, CGParkin Communications, Inc., for editorial support.
Author Contribution Statement
Concept and design (G.J.R., J.S.C., and Y.N.); acquisition of data (G.J.R.); analysis and interpretation of data (E.E.W., G.J.R., J.S.C., Y.N., N.V., and E.M.); statistical analysis (G.J.R. and J.S.C.); drafting of the article (E.E.W., G.J.R., J.S.C., Y.N., N.V., and E.M.); and critical revision of the article for important intellectual content (E.E.W., G.J.R., J.S.C., Y.N., N.V., and E.M.). E.E.W. is the guarantor of this work and takes responsibility for the integrity of the data and the accuracy of the content.
Author Disclosure Statement
E.E.W. has received consulting fees from Abbott, Bayer, Boehringer Ingelheim, Eli Lilly, and Sanofi US and has acted as a speaker for Abbott, Bayer, Boehringer Ingelheim, and Eli Lilly. E.M. has received consulting fees from Abbott, Astra Zeneca, Novo Nordisk Boehringer Ingelheim, Eli Lilly, Merck, and Sanofi US and has acted as a speaker for Abbott, Boehringer Ingelheim, Eli Lilly, and Novo Nordisk. G.J.R., J.S.C., Y.N., and N.V. are employees and stockholders of Abbott.
Funding Information
The study was funded by Abbott Diabetes Care.