
Abstract
Background:
Time in range (TIR), time in tight range (TITR), and average glucose (AG) are used to adjust glycemic therapies in diabetes. However, TIR/TITR and AG can show a disconnect, which may create management difficulties. We aimed to understand the factors influencing the relationships between these glycemic markers.
Materials and Methods:
Real-world glucose data were collected from self-identified diabetes type 1 and type 2 diabetes (T1D and T2D) individuals using flash continuous glucose monitoring (FCGM). The effects of glycemic variability, assessed as glucose coefficient of variation (CV), on the relationship between AG and TIR/TITR were investigated together with the best-fit glucose distribution model that addresses these relationships.
Results:
Of 29,164 FCGM users (16,367 T1D, 11,061 T2D, and 1736 others), 38,259 glucose readings/individual were available. Comparing low and high CV tertiles, TIR at AG of 150 mg/dL varied from 80% ± 5.6% to 62% ± 6.8%, respectively (P < 0.001), while TITR at AG of 130 mg/dL varied from 65% ± 7.5% to 49% ± 7.0%, respectively (P < 0.001). In contrast, higher CV was associated with increased TIR and TITR at AG levels outside the upper limit of these ranges. Gamma distribution was superior to six other models at explaining AG and TIR/TITR interactions and demonstrated nonlinear interplay between these metrics.
Conclusions:
The gamma model accurately predicts interactions between CGM-derived glycemic metrics and reveals that glycemic variability can significantly influence the relationship between AG and TIR with opposing effects according to AG levels. Our findings potentially help with clinical diabetes management, particularly when AG and TIR appear mismatched.
Introduction
Glycated hemoglobin (HbA1c), reflecting average glucose (AG) levels over the past 3 months, has long been recognized as the gold standard for monitoring and managing diabetes. 1 However, with the advent of continuous glucose monitoring (CGM) technology, additional glycemic metrics emerged, including time in range (TIR), 2 time in tight range (TITR), 3 time above range (TAR), and time below range (TBR), aiming to optimize and unify management in individuals with diabetes. 4
Early studies have shown that TIR and TAR correlate with HbA1c and AG, 1,5 although the strength of the associations can differ between individuals. On the other hand, TBR is more closely associated with glucose variability, 6 –8 often assessed as the coefficient of variation (CV). However, an in-depth understanding of these relationships is lacking, and more insight into the interactions between these glycemic markers may allow progress toward optimizing diabetes management. In routine clinical care, a disconnect between HbA1c and TIR is not infrequently observed, 1 making management decisions more difficult. While the disconnect between the two glycemic parameters can be explained in some patients, this is not the case in all, creating an area that needs further investigation. In particular, the effects of glucose variability on the relationship between AG and TIR are incompletely understood and only partially studied.
The mean, variability, and fraction within a specific range are interrelated properties in a distribution of values. 7 –9 An accurate glucose distribution model is critical to connect the main glycemic markers, including AG, TIR, TITR, TAR, TBR, and CV. Assessing different models of glucose distribution, Rodbard 9 suggested that the log-normal model was reasonable as a starting point to investigate glucose distribution, which we embarked on investigating using a large set of real-world data. The current work aimed to understand the relationship between HbA1c and TIR as well as the associations between the different CGM-derived glycemic markers and establish the best glucose distribution model that accurately reflects the interaction between these markers. We used flash glucose monitoring data from over 29,000 individuals with diabetes, making this the largest dataset we are aware of investigating the role of glucose distribution in determining interactions between CGM-derived glycemic markers.
Materials and Methods
Study participants
Real-world CGM data were collected among self-identified type 1 diabetes (T1D), type 2 diabetes (T2D), and gestational/other diabetes users of flash glucose monitoring (FreeStyle Libre, Abbott Diabetes Care), who consented and participated in a global online survey from 2019 to 2022. The survey was intended to study the distribution of disease types and therapy options in FreeStyle Libre users, as previously reported. 10 No ethics committee approval was required because of the use of deidentified data for this observational analysis.
Glycemic parameters
For each sensor, we computed AG, TIR (glucose levels between 70 and 180 mg/dL, inclusive), TITR (glucose levels between 70 and 140 mg/dL, inclusive), TAR (glucose >180 mg/dL), and TBR (glucose <70 mg/dL), all expressed as percentage/day, while glucose variability was measured as CV of glucose values. To ensure the accuracy of these parameters, a minimum of 5-day worth of CGM data for each 14-day sensor was required for inclusion in the analysis.
Interaction between glycemic markers
CV values were divided into tertiles to analyze the effects of this glycemic marker on the relationship between AG and TIR/TITR. We then studied the associations between AG and TIR/TITR in each CV tertile and conducted a subanalysis of different AG ranges to further understand the interactions between these glycemic markers.
Best-fit distribution functions
We aggregated all observed readings and compared the frequency distribution against different distribution functions to identify the best fit. Given that glucose readings have positive values and display asymmetrical distribution across different glucose levels, we tested a total of seven finite, asymmetrical, and positive distribution functions that required two or fewer parameters and were available in R-gamlss family “realplus” collection. 11,12 These included log-normal, gamma, inverse Gaussian, inverse gamma, Weibull, Pareto, and generalized Pareto.
As a first step, we filtered out distributions that rank significantly lower in fitting overall CGM readings. Therefore, each function was optimized to fit the distribution against all CGM data. The goodness of fit between each optimized function and observed glucose distribution was assessed by Akaike information criterion. 13 The fitDist method 11 was used for both function optimization and Akaike information criterion calculation. Subsequently, the best-fit distribution functions were compared using subject-level data. For a given distribution function, individual AG and CV can be used to determine the specific distribution parameters and corresponding cumulative distribution function (CDF). The expected TIR, TAR, and TBR can then be derived from the CDF. Specifically, the module “stat” in the SciPy package (Oliphant) was used to determine CDF from AG and CV. Since the readings below 39 and above 500 mg/dL were reported as 39 and 500 mg/dL, those readings were excluded to prevent artificial spikes at the boundaries, which can distort the distribution fitting analysis (full details are available in Supplementary Materials S1). The agreement between observed and estimated TIR, TAR, and TBR values were compared using linear regression and coefficient of determination (R 2 ). In addition, the distribution-based estimates were assessed by clinical accuracy frequency for being within 4% (58 min/day) for TBR and 5% (72 min/day) for TIR and TAR compared to the measured values. Further, receiver operating characteristic curve (ROC) analysis evaluated the accuracy of estimates of meeting clinical targets for TIR and TBR individually and concurrently. Accuracy values were compared using confusion matrix with clinically relevant thresholds of 70% for TIR and 4% for TBR.
Once the best glucose distribution was identified, the interrelationships of the key glycemic markers were evaluated and presented both graphically and in tabular format. R 14 and Python/SciPy packages 15 were used for all analyses.
Results
Data collection
A total of 29,164 flash glucose-monitoring users were identified with at least one valid sensor and who responded to the online survey between December 2019 and April 2022. 10 Both older and newer versions of the flash sensors were used. All had self-identified diabetes types in three categories: T1D (N = 16,367), T2D (N = 11,061), or gestational/others (N = 1,736). CGM data were collected from 715,268 qualified sensors. On average, each subject had 38,259 glucose readings representing an average of 399 total days of sensor data collection.
T1D subjects had AG of 158 mg/dL, average SD of 58 mg/dL, and average CV of 37%, higher than T2D subjects who had AG of 153 mg/dL, SD of 43 mg/dL, and CV of 28%. In our survey, the diabetes durations were captured in six bins spaced by 5-year: <1, 1–5, 6–10, 11–15, 16–20, and >20 years. The details can be found in Supplementary Table S1.
Effects of glucose variability on the relationship between AG and TIR
All sensors were assigned into three equal size bins (tertiles) by CV (Fig. 1, top row). At AG level of 150 mg/dL, averaged from range of ±10 mg/dL (same hereafter), the low, middle, and high CV tertiles displayed different average TIR (±SD) of 80% ± 5.6%, 72% ± 5.1%, and 62% ± 6.8%, respectively (P < 0.001). At the AG level of 130, the corresponding average TITR (±SD) values were 65% ± 7.5%, 58% ± 6.3%, and 49% ± 7.0% (P < 0.001). Therefore, in these low AG levels, an increase in CV is associated with over 15% reductions in TIR and TITR. An opposite trend, although with smaller differences were observed in the higher AG level of 240 mg/dL; TIR of 16% ± 4.9%, 24% ± 3.2%, and 29% ± 4.0% (P < 0.0001), and TITR of 4% ± 2.7%, 11% ± 2.6%, and 16% ± 3.5% (P < 0.0001), for low, middle, and high CV tertiles, respectively. In the AG level of 190 mg/dL, we observed similar TIR readings of 46% ± 5.8.0%, 47% ± 4.9%, and 45% ± 5.1% in the CV tertiles. At this AG level, TITR readings were 15% ± 4.9%, 23% ± 3.6%, and 27% ± 3.9% (P < 0.0001) for low, middle, and high CV tertiles, respectively. At the AG level of 160 mg/dL, similar average TITR values of 40% ± 6.8%, 41% ± 5.4%, and 39% ± 5.5%, were observed in the CV tertiles.
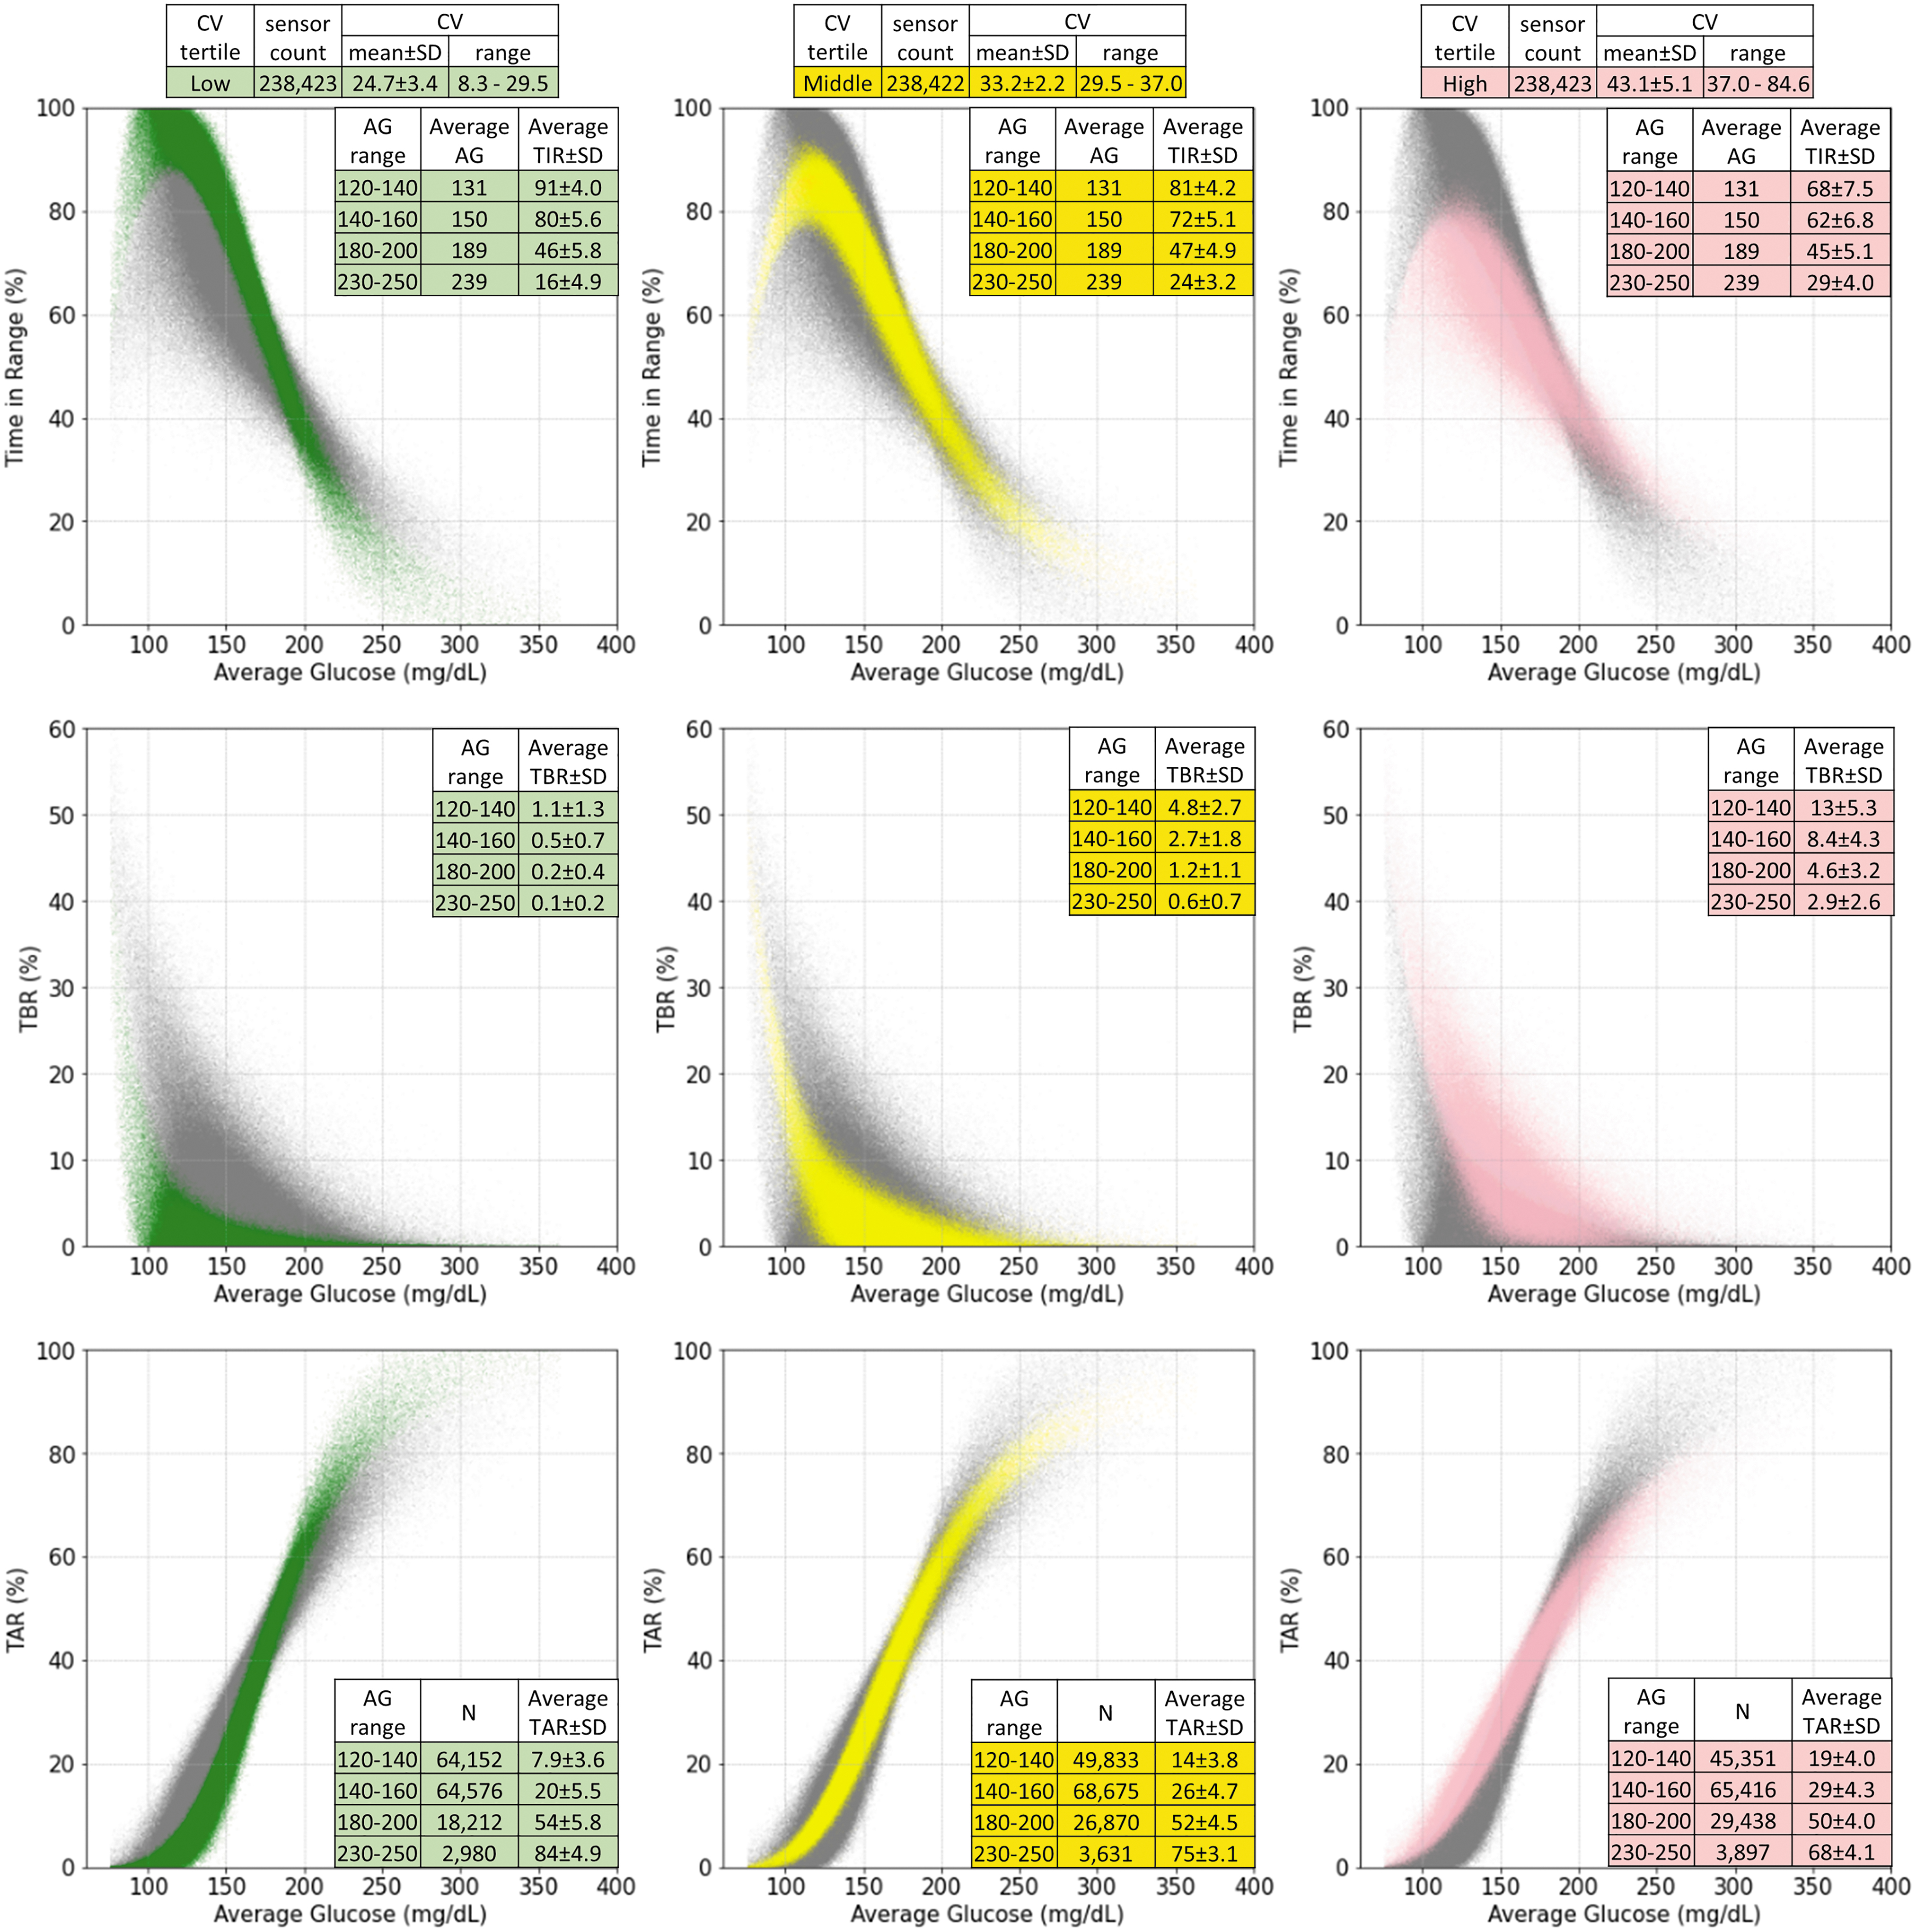
AG (horizontal axis) versus TIR, TBR, and TAR. The TIR versus AG, TBR versus AG, and TAR versus AG plots are presented in first, second, and third rows. Sensors in the first, second, and third CV tertiles are plotted in green, yellow, and pink in the first, second, and third columns, respectively. Sensors not in the specified shaded CV tertiles are shown in gray for comparison. AG, average glucose; CV, coefficient of variation; TAR, time above range; TBR, time below range; TIR, time in range.
Effects of glucose variability on the relationship between AG and TAR/TBR
For TBR (Fig. 1, middle row), higher CV was associated with increased TBR at each AG range, with the largest differences observed at lower AG ranges. For AG 120–140 mg/dL, there was over 10% difference in TBR for low, middle, and high CV tertiles (1.1% ± 1.3%, 4.8% ± 2.7%, and 13.0% ± 5.3%, respectively; P < 0.0001). In contrast, the difference in TBR was <3% comparing low, middle, and high CV tertiles in AG range of 230–250 mg/dL (0.1%, 0.6%, and 2.9%, respectively). For TAR (Fig. 1, bottom row), we observed a trend similar to TIR. TAR increased as CV increased for AG ranges of 120–160 mg/dL; however, TAR decreased as CV increased for AG ranges above 180 mg/dL.
Assessment of the different models of the glucose distribution function
Taking all CGM readings, the fitDist calculation produced Akaike information criterion (AIC) scores for the seven distributions studied. Gamma distribution gave the best AIC score of 6.94 × 10⁶. Inverse Gaussian and log-normal distributions gave similar but slightly less accurate AIC scores at 6.95 × 10⁶. Other distributions gave significantly worse AIC scores that were greater than 7.1 × 10⁶ (Supplementary Table S2). Therefore, we focused our further analysis on gamma, inverse Gaussian, and log-normal distributions.
From sensor AG and CV, we derived the CDF for the three top-ranked distributions: gamma, inverse Gaussian, and lognormal. The corresponding TIR, TAR, and TBR were estimated based on each CDF using AG and CV from each sensor. Predictions of these variables were most accurate using the gamma distribution, as shown in Figure 2. In this analysis, we used the accuracy thresholds of 4% (58 min/day) for TBR since TBR <4% is the recommend clinical goal, 6 and 5% (72 min/day) for TIR. 4 Since TIR and TAR are usually tightly coupled, the same 5% threshold was used for TAR. For TBR, the fraction of accurate predictions was 94% for the gamma distribution compared to 86% for both inverse Gaussian and log-normal distributions. For TIR, the gamma distribution was 86% accurate compared to 72% accuracy for the other two distributions. For TAR, the gamma distribution was 96% accurate compared to 88% for the other two distributions. The most accurate 50% of data points are shown in dark grids of Figure 2, demonstrating the gamma distribution estimates to be more symmetrical and closer to the unity lines. In contrast, the inverse Gaussian and log-normal distribution models tended to underestimate TAR and TBR while overestimating TIR.
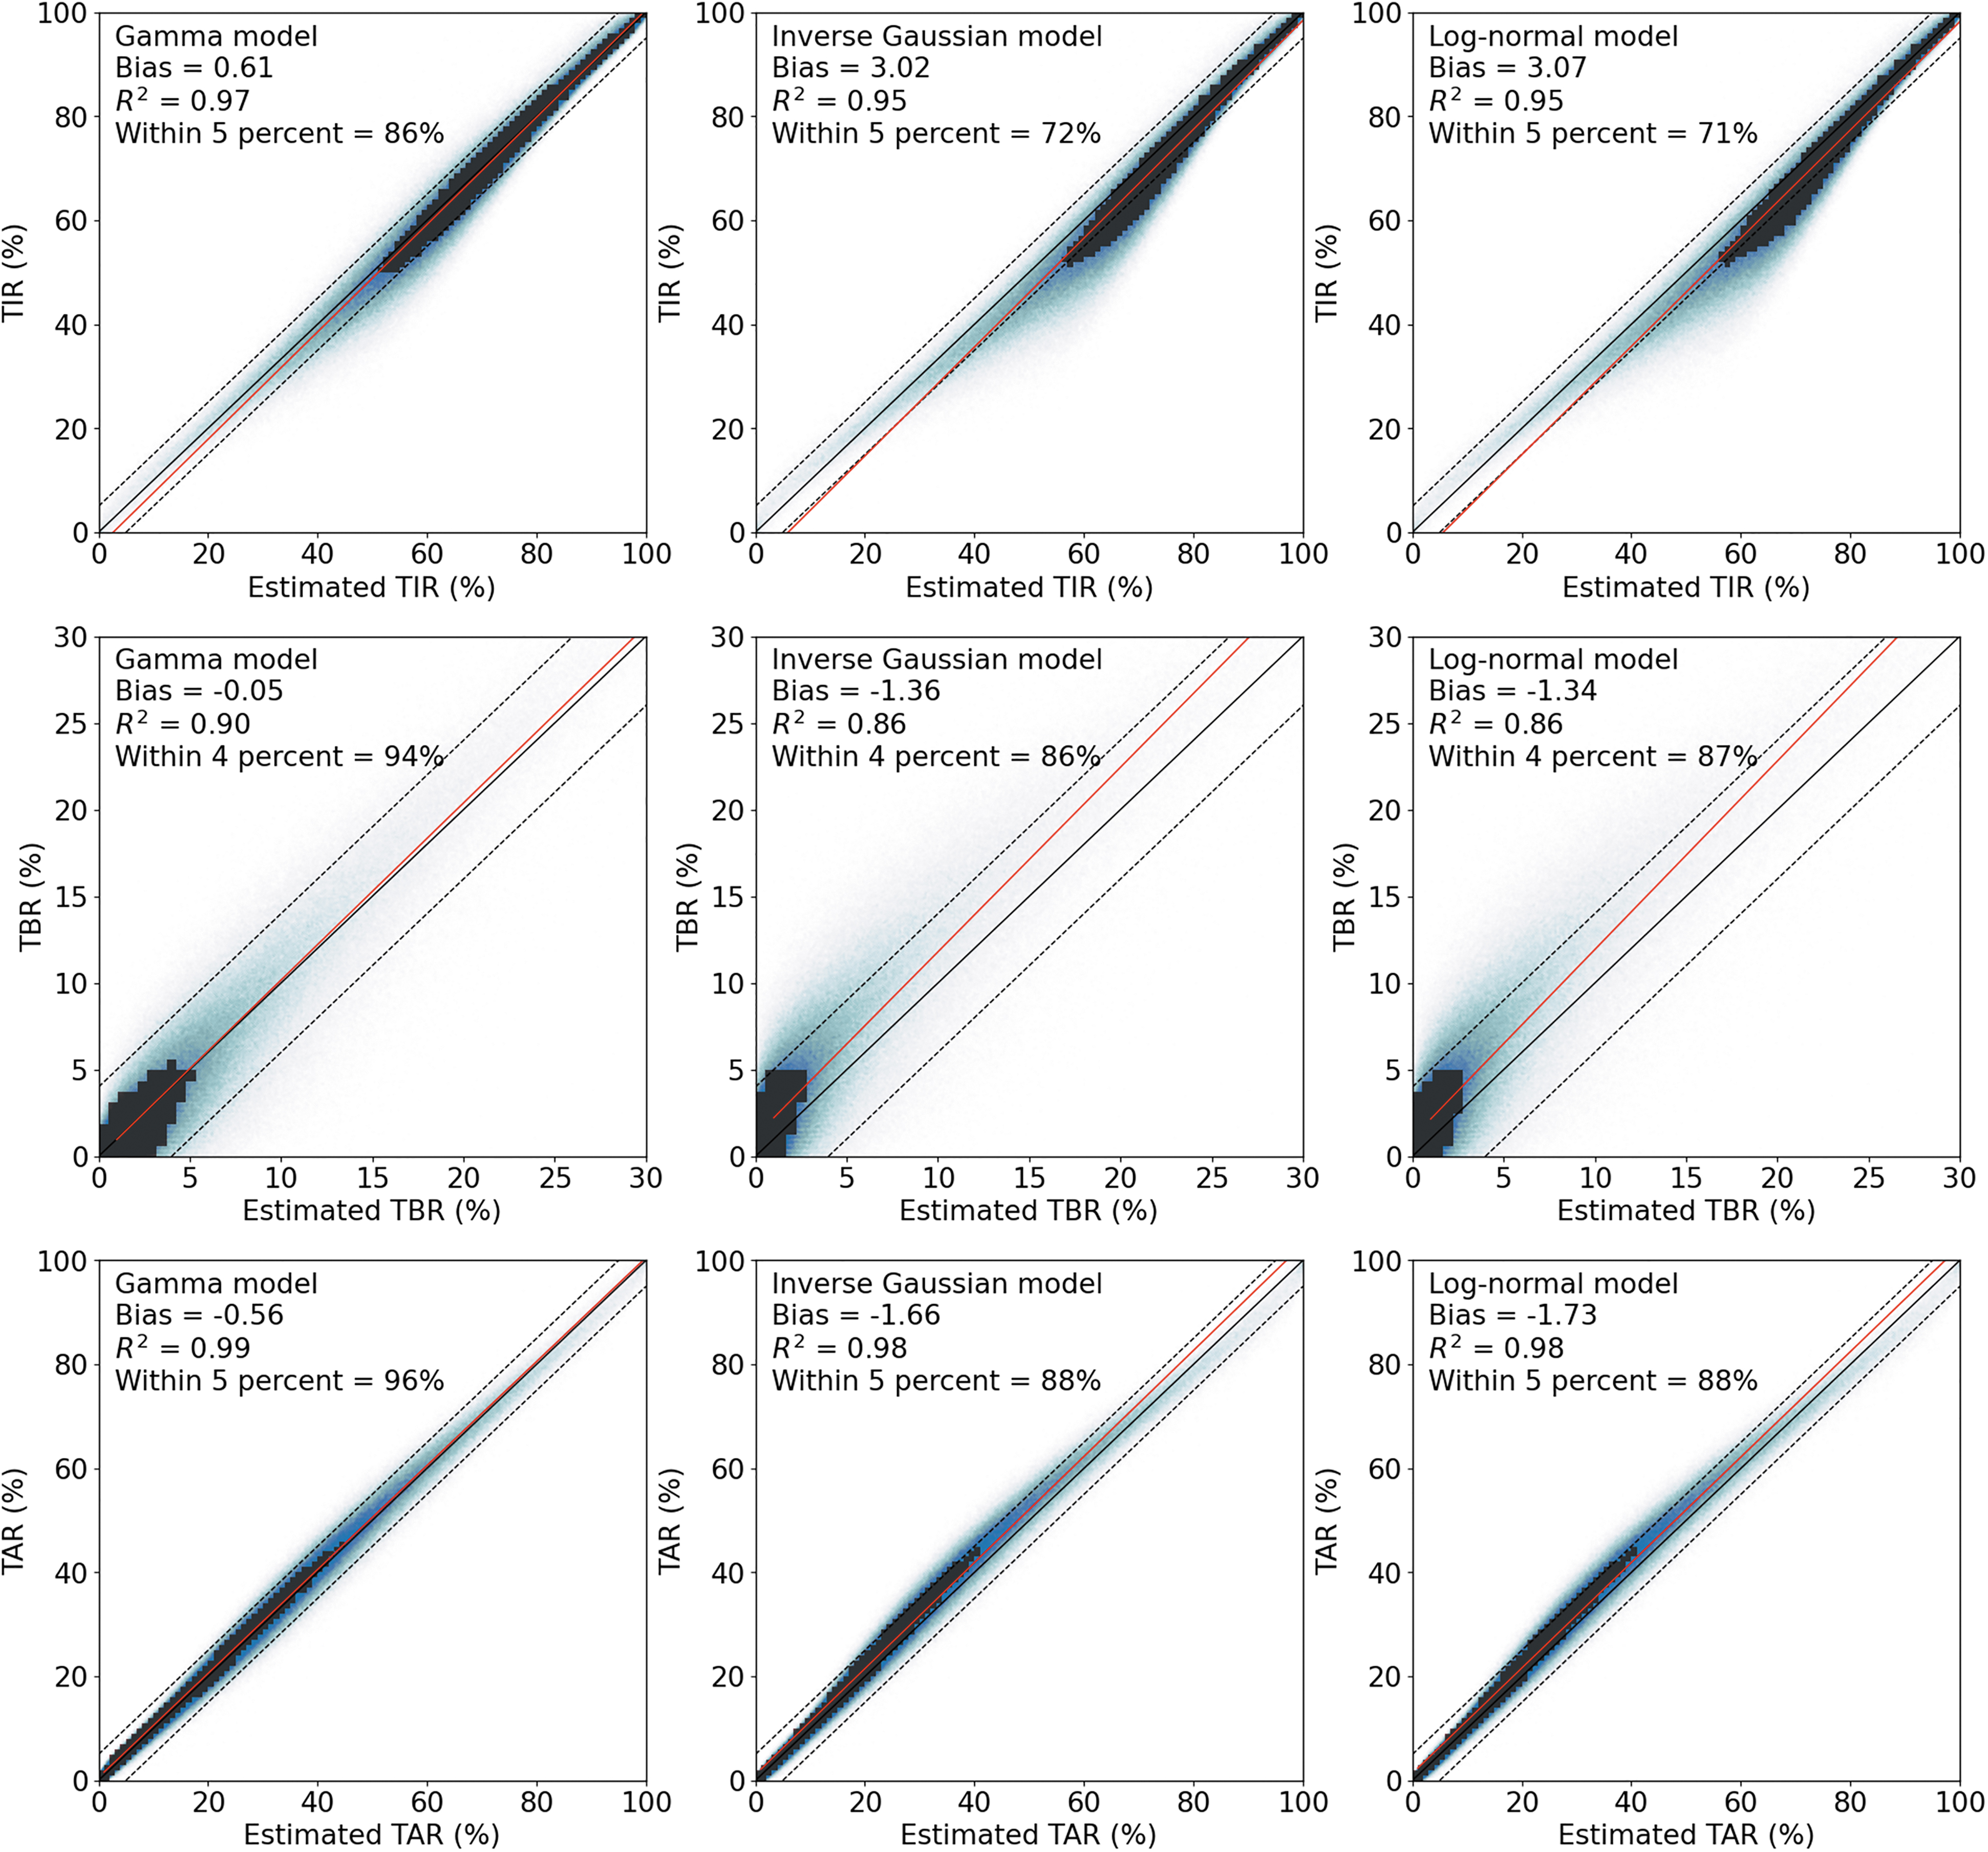
Accuracy comparisons in gamma (left column), inverse Gaussian (middle column), and log-normal (right column) models for TIR (top row), TBR (middle row), and TAR (bottom row). Estimated values (x-axis) from each model are plotted against corresponding observations. Red solid lines are linear regressions. Unity lines are plotted in solid black. In TIR and TAR plots, ±5% deviation boundaries are shown as dotted lines. In TBR plots, ±4% deviation boundaries are shown as dotted lines. In each plot, dark grids indicate the densest area that covers 50% of subjects.
The accuracy comparison shows that the gamma model identifies individuals with TIR >70% or TBR <4% better than inverse Gaussian and log-normal-based estimates (Table 1), with higher ROC area-under-the-curve (AUC) values (P < 0.05). The gamma model also had higher overall accuracy (P < 0.0001), identifying those concurrently with TIR >70% and TBR <4%, with the advantage of low false positive and high true negative rates compared to the other distribution models. When comparing the three diabetes groups of T1D, T2D, and gestational/others, the gamma model had consistently the highest accuracy (Supplementary Table S2B).
Performance Comparison Among Three Glucose Distribution Models by Time in Range >70% and Time Below Range <4% Using Receiver Operating Characteristic Curve Analysis and Confusion Matrix
Bold numbers indicate the best values among three models in each column.
TBR, time below range; TIR, time in range.
AUC, area-under-the-curve; ROC, receiver operating characteristic curve.
The relationship between AG- and CGM-derived glycemic markers
Once the shape of the glucose distribution has been established, through the use of two glycemic markers, other glucose parameters can be derived. Selecting the gamma-shaped glucose distribution results in defined relationships between AG and TIR, TBR, and TAR at different CV values (Fig. 3). To further clarify, Table 2 is provided to estimate TIR, TITR and TBR given AG and CV under the gamma distribution. In Supplementary Table S3E, we also provide a version with glycemia risk index zone. 16
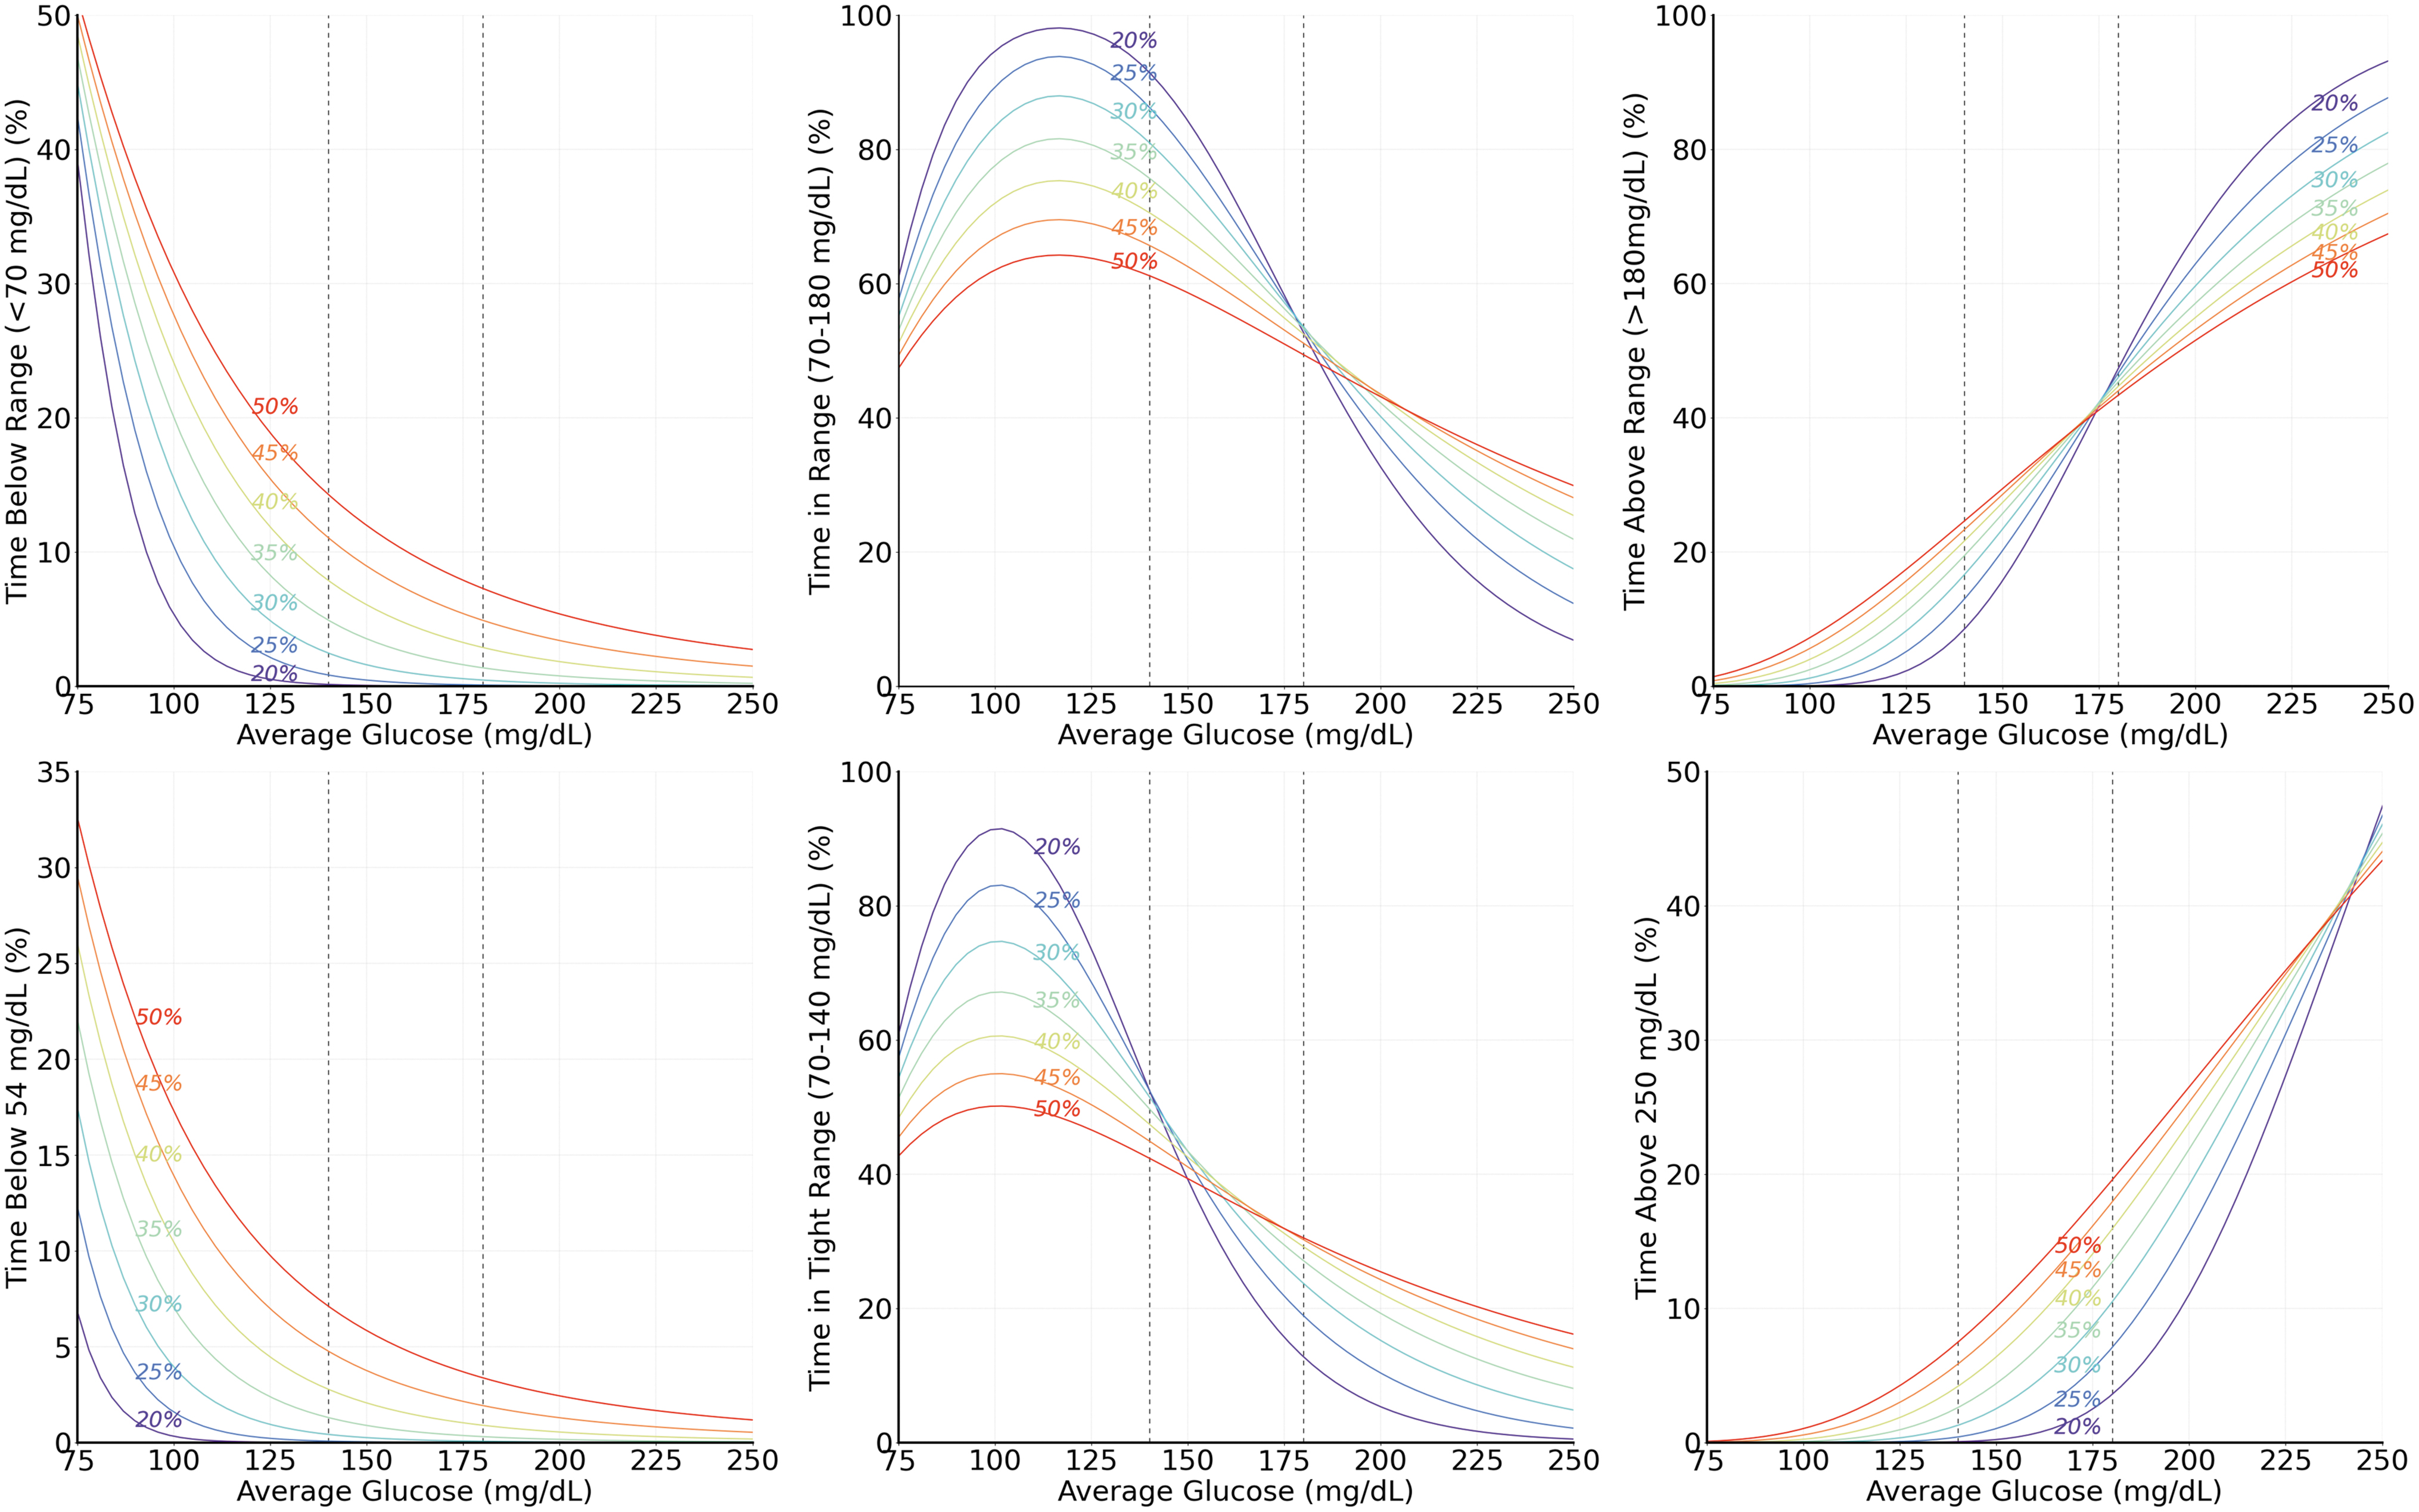
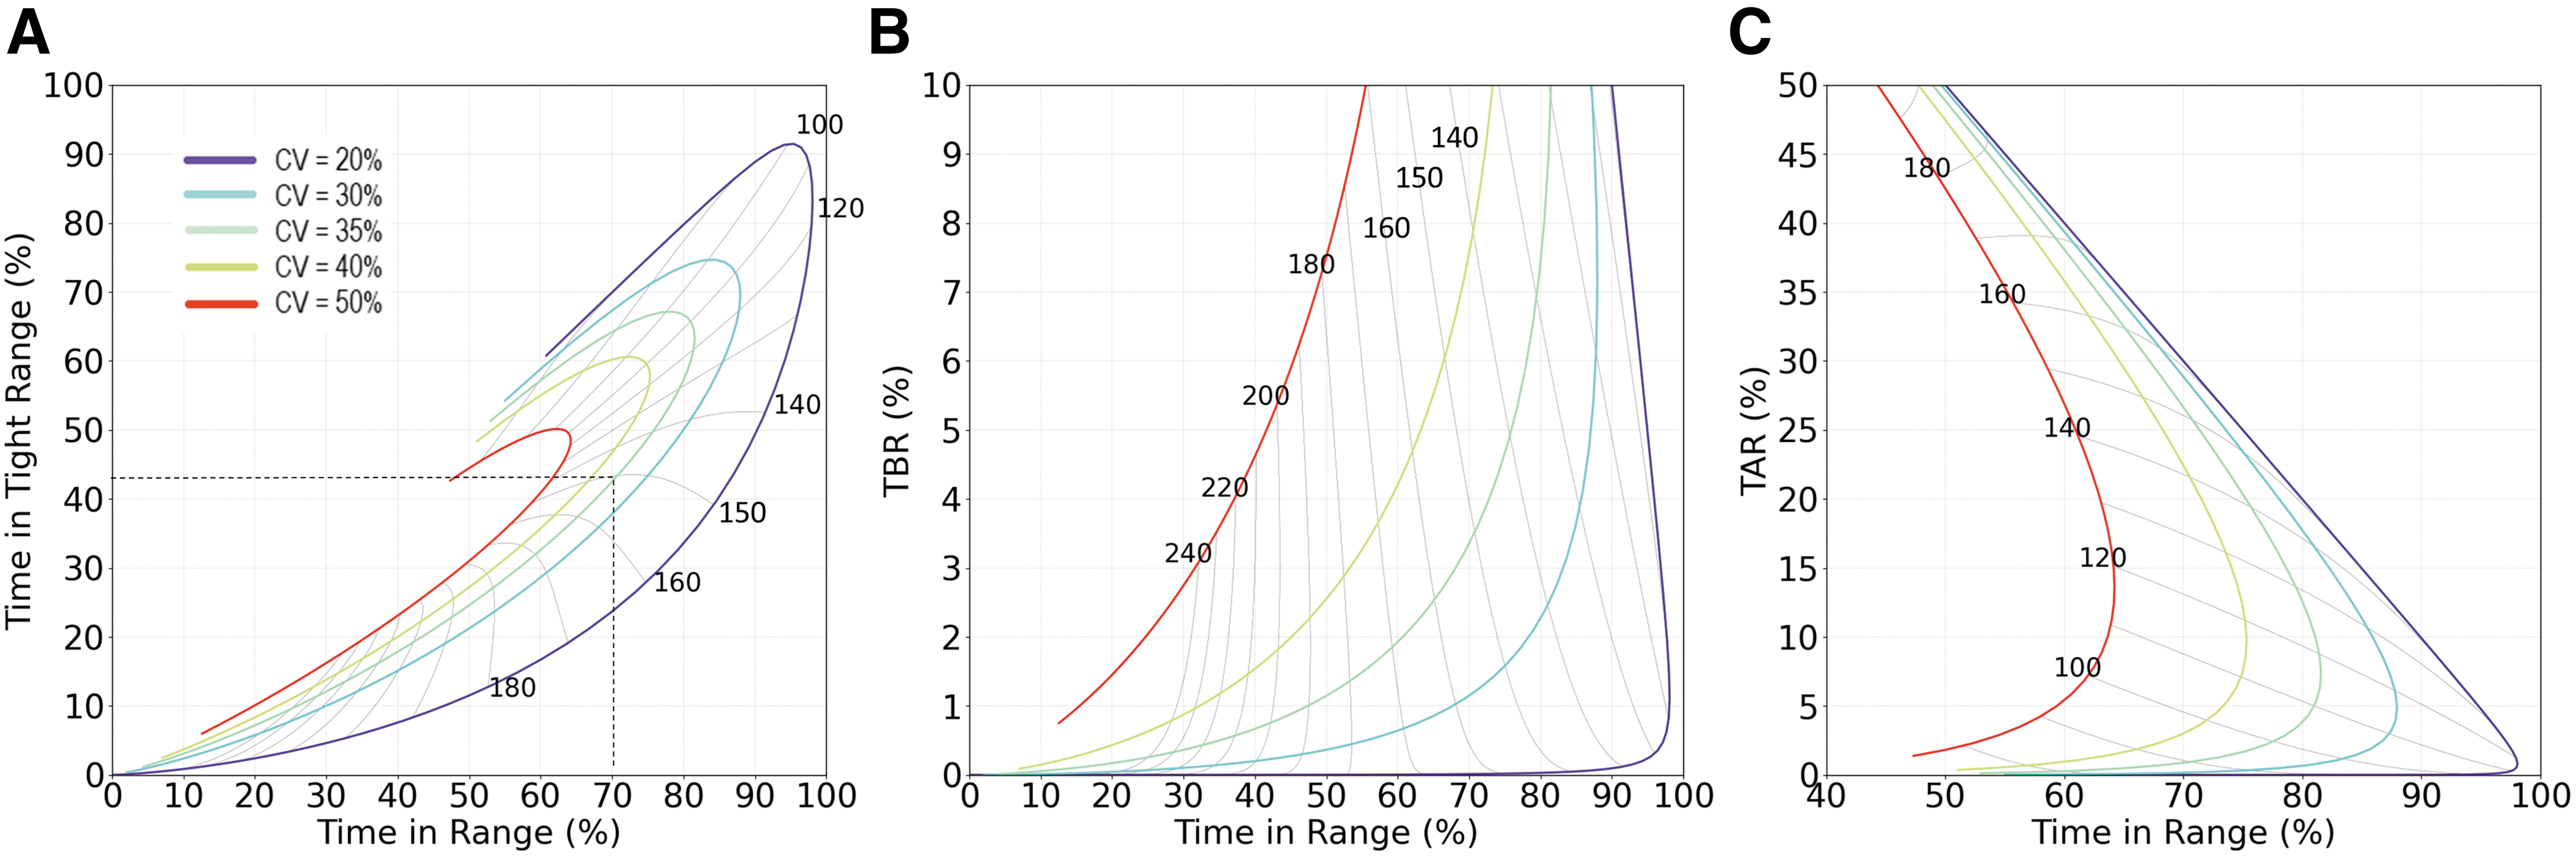
Theoretical relationships between AG and TBR, TIR, TAR, time below 54 mg/dL, TITR, or time above 250 mg/dL under gamma distribution and specific CVs. Curves from red to purple correspond to CV of 50% to 20% in steps of 5%. TITR, time in tight range.
Estimated Time in Range 70–180 mg/dL (3.9–10.0 mmol/L), Time in Tight Range 70–140 mg/dL (3.9–7.8 mmol/L), and Time Below 70 mg/dL (3.9 mmol/L) Across Range of Average Glucose and Glucose Coefficient of Variation Based on Gamma-Shaped Glucose Distribution
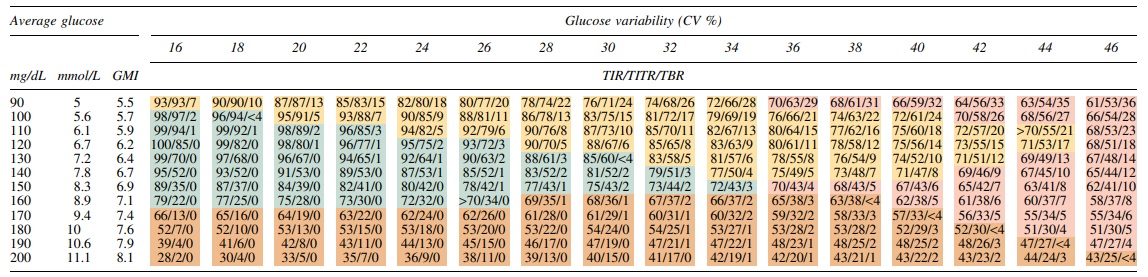
TITR, time in tight range.
The relationship between TIR and other and CGM-derived glycemic markers
The expected relationships between the key glycemic markers of TIR, TITR, TBR, TAR, AG, and glucose CV are shown in Figure 4. Clinical insights can be found by evaluating the relationships across clinically relevant ranges. For instance, a key landmark point is at guideline targets of TIR = 70%, CV = 35%, and inspection of Figure 4A finds the expected AG = 150 mg/dL and TITR = 42%. A change in CV significantly alters these relationships with TIR varying by 25% for the same AG. To further support derived TIR and TITR relationship in Figure 4A, we plotted the observed data with matched pattern in Supplementary Figure S3.
Relationship of TIR, AG, CV and TITR, TBR, TAR assuming gamma distribution of glucose values.
CV also has a strong effect on TBR (Fig. 4B); at TIR of 70%, an increase in CV from 35% to 40% would be expected to double TBR from about 4% to 8%, limiting the appeal of the apparent improvement of AG from 150 to 140 mg/dL.
The effect of CV on TAR is shown in Figure 4C. At constant AG values 170 mg/dL or lower, increasing CV (moving left on colored lines in Fig. 4C) results in lower TIR and higher TAR. However, for AG of 180 mg/dL or higher, TAR should be expected to reduce despite increasing glucose variability. Therefore, TAR may improve due to the variability increasing but at the expense of a significant increase in TBR from near 0 to around 7%.
The relationship between diabetes duration and AG/CV/TIR/TITR in T1D and T2D
Since diabetes type and duration information were captured, it was possible to investigate the sensitivities of AG, CV, TIR, and TITR against the disease progression. Since most of subjects were self-identified as T1D or T2D, we limited our investigation in these two groups. The AG, CV, TIR, and TITR changes over diabetes duration were plotted in Figure 5. The estimated TIR and TITR from corresponding AG and CV using gamma, log-normal, and inverse Gaussian models were also plotted. Again, gamma model has better agreement with observed average TIR and TITR in most of subgroups (Fig. 5). The tight standard error ranges suggest high certainty of the trend reflected by the mean values. The wide interquartile ranges suggest large individual variation. At the beginning of diagnosis, comparing to T1D, T2D group has lower AG and CV, higher TIR and TITR. Both T1D and T2D groups have increasing AG and CV, decreasing TIR and TITR over time within the first 10 years of diagnosis, indicating the progression of diabetes. In the first 5 years, T2D group had significantly faster AG increase and TITR decrease, at about twice the rate of the T1D group. The fast initial disease progression in T2D suggests the importance of early monitoring and intervention with TITR in this group. All four glycemic parameters reached a plateau between 10 and 20 years of diabetes duration. These parameters recovered slightly in T1D after 20 years. However, such recoveries were not observed in T2D group.
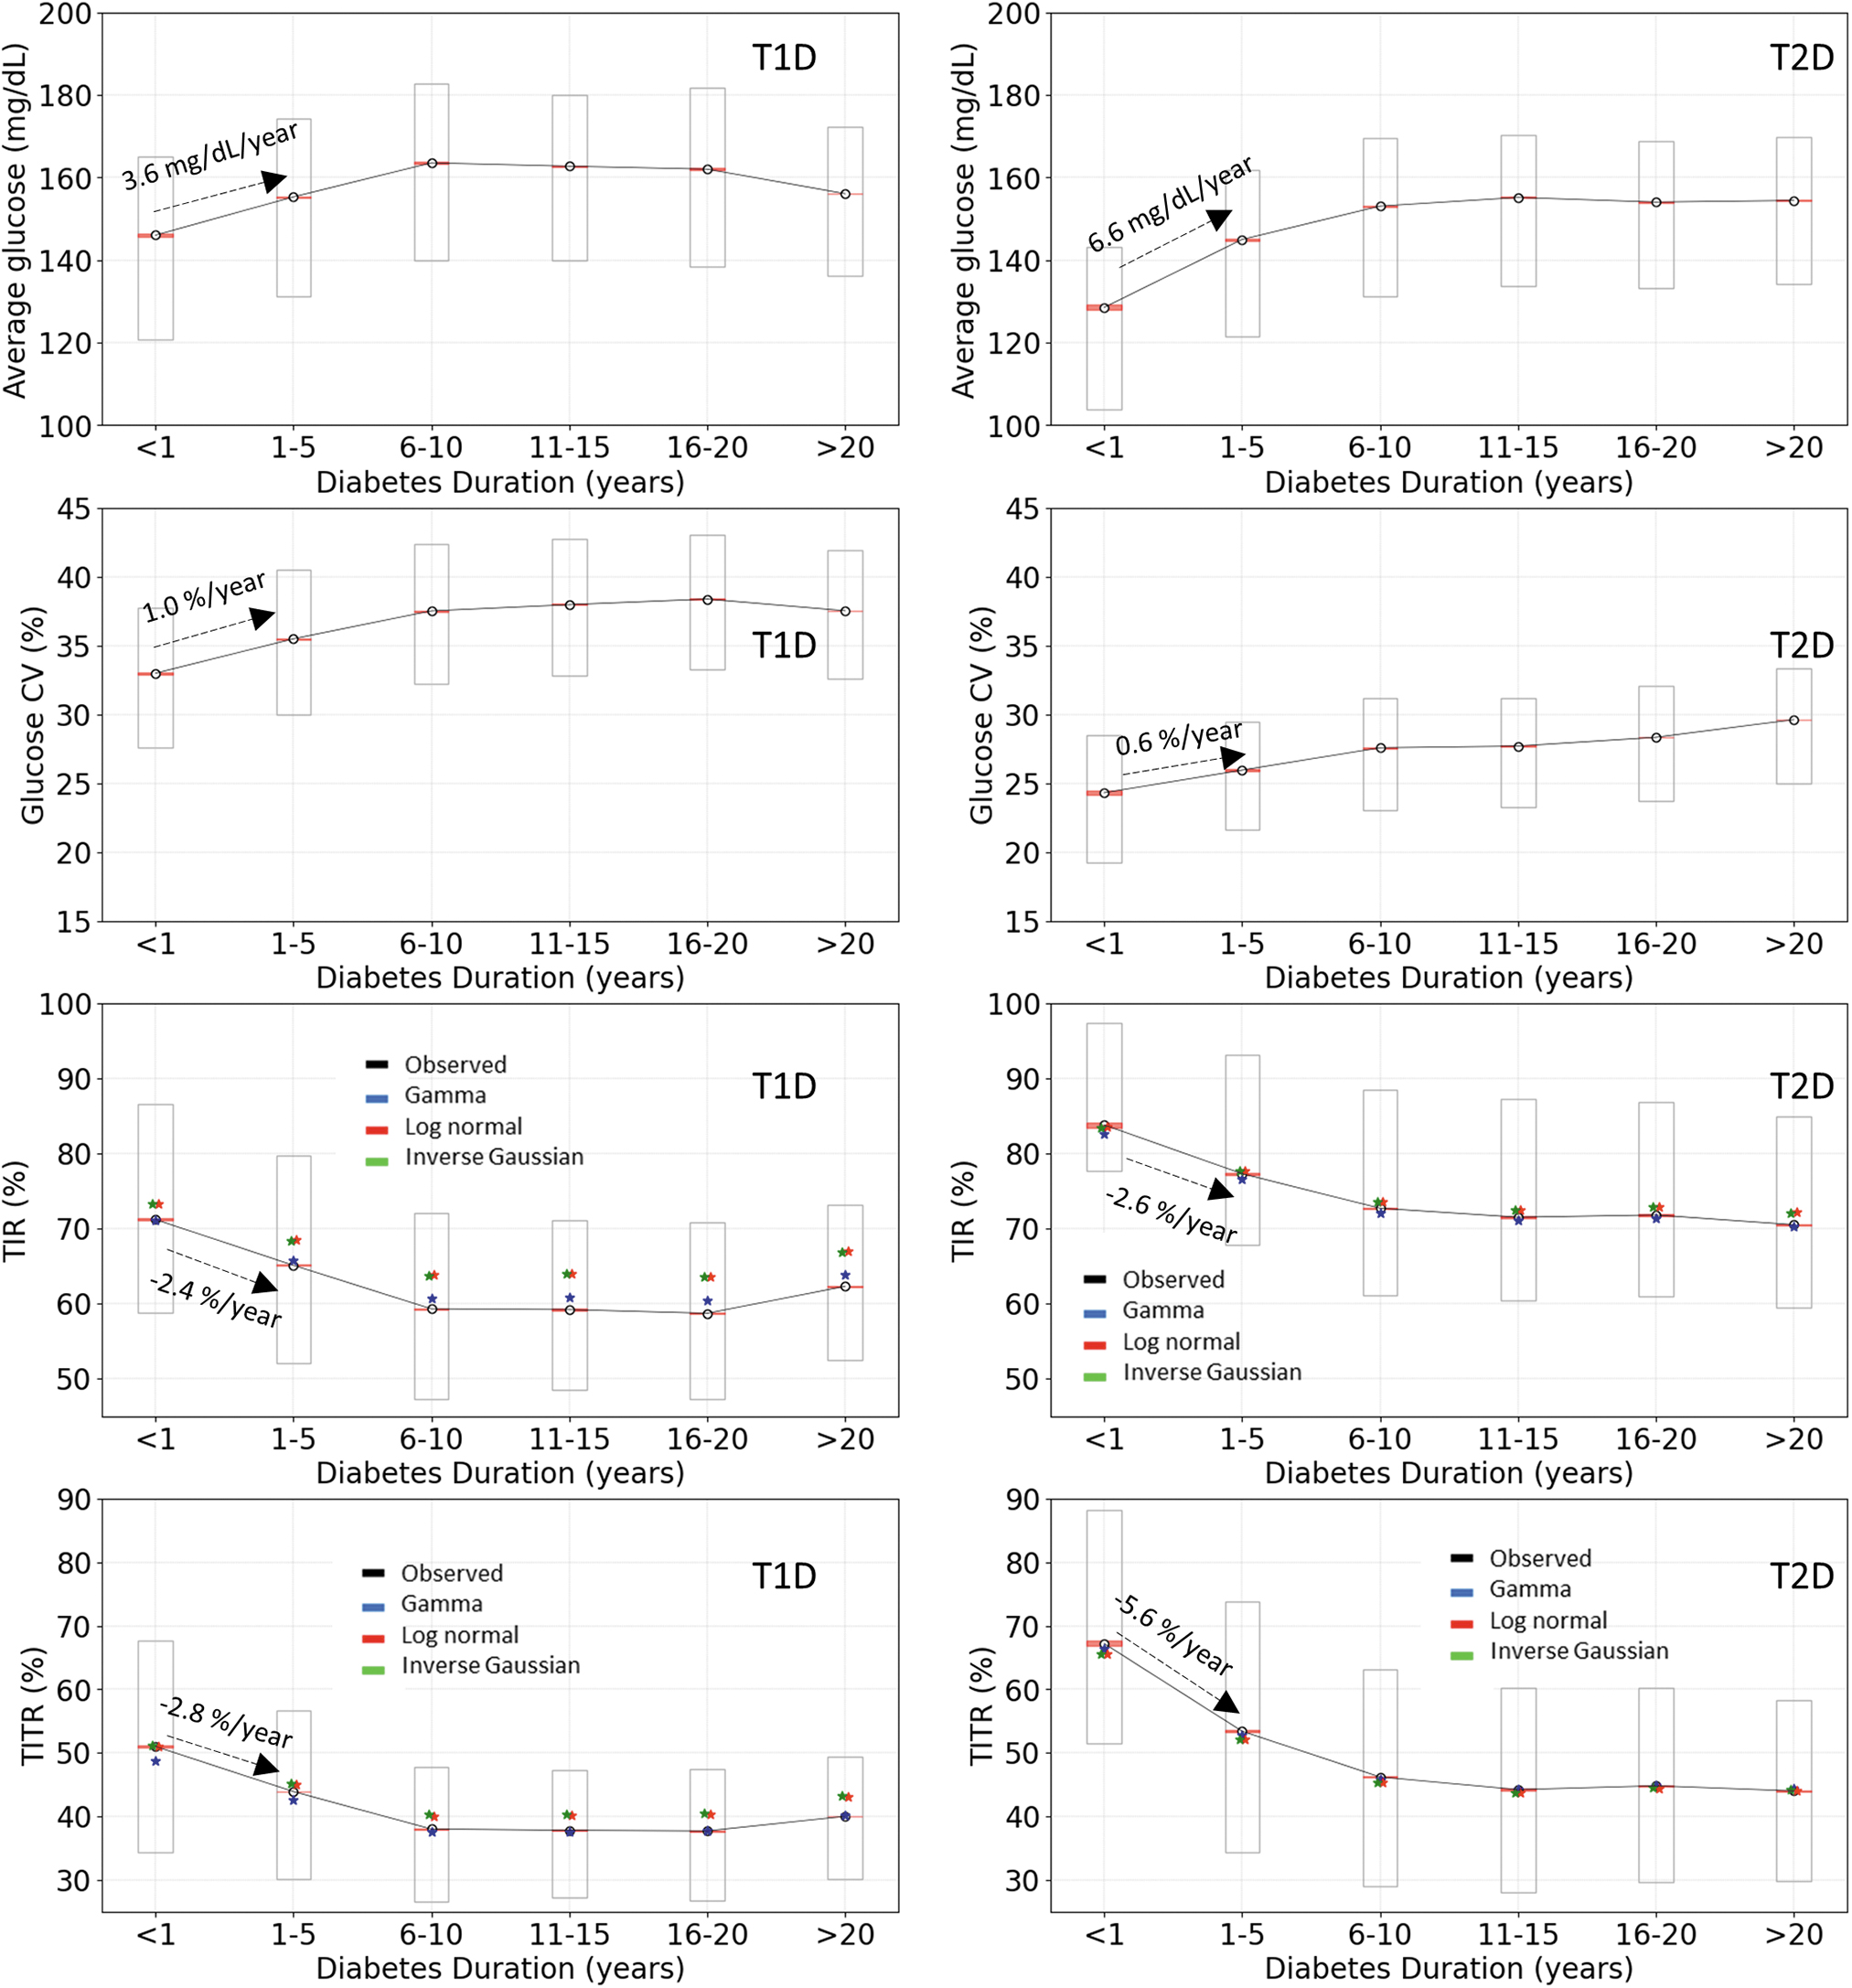
Longitudinal changes in AG, CV, TIR, and TITR with duration of diabetes in T1D and T2D. Left column: T1D. Right column: T2D. Levels of AG, CV, TIR, TITR changes over diabetes duration are shown in rows 1 to 4. Observed mean values, ±1 standard errors of the mean (±1sem), and interquartile ranges are shown in black circles, pink bands, and rectangles, respectively. The estimated average TIR and TITR values calculated using AG and CV for each subject are shown in colors: Gamma distribution: blue; Log-normal distribution: red; Inverse Gaussian distribution: green. T1D, type 1 diabetes; T2D, type 2 diabetes.
Discussion
Since the more widespread use of CGM for diabetes management, there has been an increase in clinically relevant glycemic parameters 4 with relatively little exploration of how these glucose measures interact. Therefore, this work is focused on elucidating the relationships between the different glycemic markers, which may, in turn, help to further optimize glycemic management in diabetes.
Some of observations in this work confirm previous reports but our results have the advantage of conducting the analyses on a large real-world dataset. For example, we conclusively confirm the nonlinear relationship between TIR and AG that was documented by Robard and Varghese et al. 9,17 Rodbard 9 derived the nonlinear relationship between TIR and AG using Gaussian or log-normal distributions which demonstrated a similar “hook” shape. In the same article, Rodbard also derived TBR and median glucose relationship as well as interactions of CV with TAR and AG. The similarities between their findings and ours are not surprising since log-normal distribution reasonably reflects overall glucose distribution. Although relatively lower in accuracy, particularly in lower glucose range affecting TBR (Fig. 2), log-normal distribution, and even Gaussian distribution, leads to similar interactions and nonlinear relationships in AG, CV, TIR, TBR, and TAR as shown in Figures 1 and 3, as well as TIR maximum or ceiling at high CV, and prediction of the effects of CV on TBR for specified levels of AG. 9
We first investigated the factors influencing TIR, particularly given the clinical observation of a disconnect between this glycemic marker and HbA1c/AG in a significant number of diabetes patients. 1 We demonstrate that the relationship between TIR and AG is affected by fluctuation in glucose levels, as higher CV generally results in lower TIR for a given AG. There are a large number of factors that can cause dissociation between AG and HbA1c, including RBC defects and changes to cellular lifespan, 18 and any factor that may affect intracellular glucose concentration or hemoglobin glycation rate. 19 –21 However, given that AG closely reflects HbA1c, the clinical disconnect between TIR and HbA1c can be due to glucose variability, which should be closely examined in such a scenario. Moreover, our data suggest that achieving TIR >70% is seemingly impossible with CV >45%, regardless of AG levels, and therefore, in such cases, the clinical focus should be on reducing glucose variability to improve TIR. Of note, our data explain findings from previous studies that show dissociation between HbA1c and TIR. For example, in the IMPACT trial in T1D, 22 HbA1c in study population was well controlled at 6.7%, but TIR was only 63%, which was lower than expected. However, it is now clear that this discrepancy was likely related to the high CV of 43% in study population. Another example is the HypoDE study, 23 in which TIR remained unchanged at ∼58% despite an increase in AG from 163 to 172 mg/dL, likely related to a drop in CV from 39% to 34%.
To add to the complexity, the effects of glucose variability on the disconnect between HbA1c and TIR are also dependent on AG levels. An increase in glucose variability can either reduce or increase TIR, dependent on whether AG is below or above the upper limit of this glycemic marker. More specifically, when AG is lower than the upper boundary of TIR (180 mg/dL), more variability tends to reduce TIR, while the opposite is observed once AG climbs above 180 mg/dL.
While TITR followed a similar pattern to TIR, its AG turning point is lower at 140 mg/dL, again in line with the upper limit of this range. Moreover, our data show that achieving TITR >70% may be possible in clinical practice, but only with CV <33% and AG between 90 and 126 mg/dL. Therefore, these relationships between CGM-derived glycemic metrics should be taken into account when recommendations are made on treatment targets.
TAR has been suggested as a better marker of glycemic control, particularly at near normal AG levels. 9 We found that TAR increased as CV increased for near-normal AG ranges. However, TAR decreased as CV increased for high AG ranges above 180 mg/dL. Therefore, the relationship between CV and TIR or TAR heavily relies on AG levels.
We have also demonstrated a strong relationship between TBR and CV, which has been documented before, 9,24 but our data are now able to more accurately define this association. Higher CV was associated with increased TBR, particularly at near-normal glucose levels with over 10% difference in TBR comparing low and high CV tertiles, despite identical AG. This difference still existed with higher AG levels, but the difference was <3% when comparing low and high CV. Taken together, it is now clear that the relationship between TIR and AG is heavily dependent on CV values, with higher values decreasing TIR when AG values are below 180 mg/dL (the upper cut-off of TIR). Conversely, high CV values increase TIR when AG values are above 180 mg/dL. Therefore, intervention strategies to optimize CV should be given more emphasis when managing patients with diabetes, particularly in the presence of a disconnect between TIR and AG (or HbA1c; Supplementary Table S4). Despite repeatedly highlighting the importance of CV, 25 this glycemic marker receives less attention than other metrics such as TIR and TBR. However, CV has a significant impact on TIR and TBR; for example, having high glucose variability with CV of 50% makes it near impossible to reach TIR target >70%, and in such cases, the focus should be on lowering CV that will consequently improve TIR (provided AG <180 mg/dL). The key to minimizing glucose variability is the use of CGM to visualize and then specifically address any recurring patterns of hypoglycemia and glucose excursions. Attention can be given to diet (education on carbohydrate counting and, in some cases, instituting a lower carbohydrate diet), targeted exercise regimens (e.g., walking after a meal with a consistent pattern of postprandial hyperglycemia), and the selection of medications like GLP-1RAs, SGLT2 that can reduce glucose excursions while minimizing the risk of hypoglycemia. 26 In addition, patients using insulin can be educated on both optimizing each dose of insulin (such as how to refine an insulin: carbohydrate ratio or the use of CGM trend arrows to optimize premeal insulin doses) and the timing of insulin delivery (bolus insulin given before meals) and working hard not to miss insulin doses. 27
We investigated the best model to predict interactions between the different glycemic metrics. Gamma, inverse Gaussian, and log-normal functions have modeled glucose distribution reasonably well; however, when we compared the estimations of TIR, TAR, TBR, and TITR from AG and CV, the gamma model consistently performed the best across all analyses. The gamma glucose distribution model connects AG, CV, TIR, TITR, TBR, and TAR. As long as two CGM-derived glycemic parameters are known, the gamma model can, relatively accurately, predict the rest.
Using the gamma-shaped glucose distribution, TIR-AG, TBR-AG, and TAR-AG relationships were found to be overall nonlinear. This is consistent with Figure 1, where we observed nonlinear patterns between TIR-AG, TBR-AG, and TAR-AG under different CV ranges. However, this can become linear with a limited spread of the data, such as CV ranging between 20% and 50% and AG ranging between 120 and 220 mg/dL (Fig. 3). In practice, diabetes patients, particularly those on insulin therapy, display wider glucose ranges and therefore a linear model, while catering for the majority, will not be accurate for all.
This work has a number of strengths. First, the sample size is large, and the distribution of the glucose metrics is wide, allowing for a full assessment of the interaction between glycemic markers. Second, these were real-life, unselected data and, therefore, representative of routine clinical practice. Third, glucose data collected were from multiple sensors over an extended period of >1 year. In addition to allowing a better understanding of the interactions between different glucose metrics, this work may also have implications for enhancing the algorithms incorporated in closed-loop systems, the use of which is expanding in the T1D population. However, there are weaknesses to be acknowledged. First, more complex distribution models, such as mixed distribution functions and those that require more than two parameters, may have superior performance for aligning measured and estimated glycemic metrics, which have not been investigated. However, given the high accuracy of the gamma model, it is unlikely that these more complex models will provide significant advantages. Second, the data are focused on individuals with diabetes, and it is unclear at this stage whether this applies to those with prediabetes or normal glucose metabolism. Of note, such individuals will have far less fluctuation in glucose levels and hence lower glucose variability; therefore, the relationship between AG and TIR is likely to be stronger with limited mismatch. Finally, we analyzed the relationships between glycemic parameters for both T1D and T2D as one entity, and it is possible that differences exist in these two populations. However, given that individuals self-identified as T1D and T2D, we have not conducted a subgroup analysis in this article, and this remains an area for future research.
Conclusion
Using real-world CGM data in individuals with T1D and T2D patients, we show that CV can significantly influence the relationship between AG and TIR and TITR. However, this relationship is complex, with increased CV reducing TIR at lower glucose levels while increasing this glycemic marker at higher glucose levels. TAR follows a similar but opposite pattern, while TBR is also closely linked to alterations in CV, particularly at near-normal glucose levels. We also show that the gamma model for glucose distribution is superior at predicting the interactions between glycemic metrics compared with six other distributions evaluated. Moreover, as long as two glucose parameters are available, for example, AG, CV, TIR, TAR, TBR, TITR, TB54, and TA250, the gamma model can predict the entire glucose distribution and other CGM-derived glucose metrics.
Data from this study have the potential to help the clinical management of individuals with diabetes, particularly in cases of mismatch between AG and TIR. Logically, TIR can be improved by focusing on reduction of CV, once AG falls below 180 mg/dL, which is demonstrated by the data.
Footnotes
Acknowledgment
The authors thank Kalvin Kao for his efforts in retrieving and formatting real-world data.
Authors' Contributions
Y.X. and T.C.D. designed the study. Y.X. designed the method and performed calculations. All authors contributed to the result discussion, data interpretation, writing, editing, and reviewing of the manuscript.
Author Disclosure Statement
Y.X., A.C., Y.D., and T.C.D. are employees of Abbott Diabetes Care. R.A.A. received no specific funding for this work but declares research support for other projects and Honoraria from Abbott Diabetes Care. R.M.B. has received research support, has acted as a consultant, or has been on the scientific advisory board for Abbott Diabetes Care, Ascensia, DexCom, Eli Lilly, Hygieia, Johnson & Johnson, Medtronic, Merck, Novo Nordisk, Onduo, Roche, Sanofi, and United Healthcare. R.M.B.'s employer, nonprofit HealthPartners Institute, contracts for his services and no personal income goes to R.M.B.
Funding Information
This work was funded by Abbott Diabetes Care.
Supplementary Material
Supplementary Material SD1
References
Supplementary Material
Please find the following supplemental material available below.
For Open Access articles published under a Creative Commons License, all supplemental material carries the same license as the article it is associated with.
For non-Open Access articles published, all supplemental material carries a non-exclusive license, and permission requests for re-use of supplemental material or any part of supplemental material shall be sent directly to the copyright owner as specified in the copyright notice associated with the article.