
Abstract
Background and Aims:
Carbohydrate counting is a well-established tool for self-management of type 1 diabetes (T1D) and can improve glycemic control and potentially reduce long-term complication risk. However, it can also be burdensome, error-prone, and complicated for the patient. A randomized controlled trial was conducted to investigate glycemic control with carbohydrate counting (“flex”) versus simplified meal announcement (“fix”) in adolescents with T1D using the MiniMed™ 780G system. The present study reports follow-up data to 12 months.
Methods:
Adolescents with T1D were randomly assigned 1:1 to use the MiniMed™ 780G system alongside the flex versus fix approaches. Participants were followed for 12 months with outcomes recorded at 3, 6, 9, and 12 months. The primary endpoint was the difference in time-in-range (TIR), and secondary endpoints included glycated hemoglobin (HbA1c) and other glucose and insulin metrics.
Results:
At 12 months, TIR (proportion of time with sensor glucose 70–180 mg/dL) was significantly lower in the fix versus flex group (72.9% vs. 80.1%, respectively; P = 0.001). There was no significant difference in HbA1c between the fix (6.8% ± 0.5%) and flex groups (6.5% ± 0.5%) at 12 months (P = 0.092), and mean HbA1c was below 7% at all time points in both arms.
Conclusions:
Glycemic control with simplified meal announcement was maintained over 12 months. On average, the international consensus targets were met in both arms for all time points. The simplified approach represents a viable alternative to carbohydrate counting, particularly in people who find the latter burdensome; however, carbohydrate counting resulted in superior TIR.
This study is registered with ClinicalTrials.gov, number NCT05069727.
Introduction
Carbohydrate counting is a well-established tool for self-management of type 1 diabetes (T1D) and is currently considered the ideal basis for calculating prandial insulin doses, facilitating dietary flexibility and potentially reducing the burden of the disease. 1,2 The Diabetes Control and Complications Trial (DCCT) showed that carbohydrate counting coupled with intensive insulin therapy was highly effective at maintaining normoglycemia, and to a higher degree than other nutritional interventions. 3 Subsequent studies showed that more precise carbohydrate counting was associated with lower glycated hemoglobin (HbA1c) in both pediatric and adult populations, 4,5 while other studies, such as the GIOCAR randomized controlled trial (RCT), went on to show that carbohydrate counting can improve patient quality of life, reduce body mass index, and waist circumference and, in those people who use carbohydrate counting and continuous subcutaneous insulin infusion consistently, improve HbA1c. 6
Alongside the potential benefits, however, carbohydrate counting can also be burdensome, prone to errors, and complex for many people with T1D, possibly contributing to a tendency toward underestimating carbohydrate intake and missing bolus doses, particularly in children and adolescents. 7,8 These challenges have resulted in programs such as the Dose Adjustment For Normal Eating (DAFNE) course (and associated scientific research program) and studies such as the DIET-CARB Study to identify the most effective educational methods for training individuals in carbohydrate counting. 9,10
Meanwhile, the advent and adoption of hybrid closed loop (HCL) systems has meaningfully improved glycemic control outcomes in people with T1D, when compared with either glucose monitoring in combination with multiple daily injections (MDI) of insulin, or treatment with a sensor augmented pump. 11 –13 The MiniMed™ 780G system is an advanced HCL system with SmartGuard™ technology, which can administer autocorrection boluses every 5 min in response to high sensor glucose readings in addition to controlling basal insulin. However, as with all current HCL systems, the MiniMed™ 780G system is not fully automated and requires users to enter the estimated amount of carbohydrate consumed for meal announcement. 14
Given the lack of complete automation, there has recently been heightened interest in simplifying the approach to meal announcement in people using HCL systems and understanding the abilities and limits of HCL systems regarding unannounced snacks and meals. The use of simplified systems for physicians, paramedical personnel, and/or patients for carbohydrate counting to assist in with self-adjustment of insulin dose was introduced many years ago. 15 For instance, in 2022, Tornese et al. reported the findings of a study, in which children and adolescents using the MiniMed™ 780G system were instructed to consume unannounced carbohydrate snacks, finding that snacks containing up to 20 g of carbohydrate were well tolerated by the MiniMed™ 780G system, with people avoiding changes in blood glucose of ≥50 mg/dL for 2 h after the meal. 16
In 2023, Shalit et al. reported on the findings of a study investigating unannounced meal challenges in 14 people; these corroborated the findings of the Tornese et al. study with regard to snacks containing up to 20 g of carbohydrate, with the additional finding that consuming unannounced meals containing up to 80 g of carbohydrate was safe, although it significantly reduced the time in which blood glucose was in the range of 70–180 mg/dL (time-in-range [TIR]). 17
Further to this growing research interest in simplifying meal announcement, we have previously reported data from a 3-month RCT comparing glycemic control in adolescents with T1D using the MiniMed™ 780G system with a simplified meal announcement system versus conventional carbohydrate counting. 18 The key limitation of the first presentation of the data was the relatively short 3-month follow-up period, which provided limited insights on the durability of the glycemic control outcomes over longer time periods. The aim of the present study was therefore to present glycemic control outcomes, data on meal announcement and insulins use, and MiniMed™ 780G system performance characteristics from the same RCT after a follow-up period of 12 months, including outcomes at 6 and 9 months after enrollment.
Methods
Study design and participants
The study design has been reported previously.
17
The trial was registered in
Participants were recruited consecutively at regular clinic visits and assigned, using a permuted block randomization scheme, to using either a set of three fixed, personalized, preset carbohydrate amounts corresponding to a regular meal, large meal, or snack (the “fix” group), or to precise carbohydrate counting (the “flex” group). The fixed carbohydrate amounts were tailored to the patient based on a 7-day food and insulin diary created during the run-in period, but always within prespecified ranges: the carbohydrate content of a regular meal was set between 40 and 70 g, a large meal between 60 and 90 g, and a snack between 15 and 20 g. The specific approach to calculating fixed carbohydrate amounts has been reported previously. 17 Participants in the precise carbohydrate counting were instructed to count carbohydrates with increments of 1 g.
Details on the design and execution of the study with regard to treatment initiation protocols, visit timings and locations, and settings of the MiniMed™ 780G system at system initiation have been published previously. 17,20 The majority of patients were initiated and encouraged to use optimal MiniMed™ 780G system settings as outlined by Castañeda et al. with a glucose target of 100 mg/dL and an active insulin time of 2 h. 21 After the initial study period of 3 months, participants were asked if they wanted to continue using the assigned meal announcement approach or to switch back to carbohydrate counting. Outcomes were then recorded at 6, 9, and 12 months.
Endpoints
The primary outcome was the intergroup difference in TIR (70–180 mg/dL) over the entire period between testing time points. Secondary endpoints were intergroup differences in HbA1c, time above range, time below range (TBR), mean sensor glucose values, metrics for meal announcement and insulin use (number of announced meals, announced grams of carbohydrates, total daily dose [TDD] of insulin, and a breakdown of the delivered insulin in autobasal, autocorrection, and manual bolus), system setting metrics (including insulin-to-carbohydrate ratio, active insulin time, glucose target, and sensor use), and safety. HbA1c was measures using a DCA Vantage Analyzer at the point of care (Siemens Healthineers, Erlangen, Germany), while insulin and continuous glucose monitoring data were collected from the CareLink™ diabetes therapy management software.
Statistical analyses
Statistical power assumptions and calculations to determine a sufficient study size have been reported previously. 17 Accordingly, the study aimed to enroll 34 participants.
Per-protocol analyses were conducted on the entire study population at each time point. The significance of intergroup differences was tested using paired Student's t tests for normally distributed outcomes or paired Wilcoxon tests in case of non-normality. A two-sided α-level of 0.05 was used without application of a multiplicity adjustment.
As a post hoc analysis, a mixed model for repeated measures (MMRM) analysis was conducted capturing the meal announcement group (treatment), visit, baseline HbA1c (as previously reported), along with “baseline HbA1c by visit” and “treatment by visit” interactions, as fixed effects.
All analyses were performed using Statistica 12 (StatSoft, Tulsa, OK).
Ethics approval
The study protocol was reviewed, and the study was approved, by the Institutional Review Board at Sidra Medicine and the National Ethics Committee of the Qatar Ministry of Public Health. All participants and their guardians read and signed an informed consent form before enrolment in the study.
Results
After assessment of 41 participants for eligibility, 34 study participants were ultimately randomly assigned to either the fix (n = 17) or flex (n = 17) groups between November 2021 and February 2022. The baseline characteristics of the participants have been previously reported; in brief, baseline HbA1c was mean ± standard deviation 8.0% ± 2.1% (64 ± 26.2 mmol/mol) in the fix group (n = 17) and 7.9% ± 1.5% (63 ± 18.6 mol/mol) in the flex group (n = 17). There were no significant differences in mean age (14.2 years vs. 13.9 years for the fix and flex groups, respectively), body mass index (20.8 kg/m2 vs. 21.4 kg/m2), use of MDI therapy (71% vs. 65%), nor in the mean number of meals per day (4.5 vs. 4.1) or the quantity of carbohydrate consumed daily (165 vs. 169 g). 17
All 34 patients were followed for the full 12-month follow-up period, with no mortality or drop-outs. After 3 months, two patients chose to switch arms from the fix group to the flex group.
Glycemic control
Mean TIR (70–180 mg/dL) was significantly lower in the fix group than the flex group at all time points, while time spent with sensor glucose levels of 180–250 mg/dL was significantly higher in the fix group at the 6-, 9-, and 12-month time points, and the proportion of time spent with sensor glucose >250 mg/dL was significantly higher in the fix group at the 3- and 9-month time points (Fig. 1 and Supplementary Table S1). TBR remained <1% (at <54 mg/dL) and <3% (at <70 mg/dL) in both groups at every time point, with no significant differences between groups.
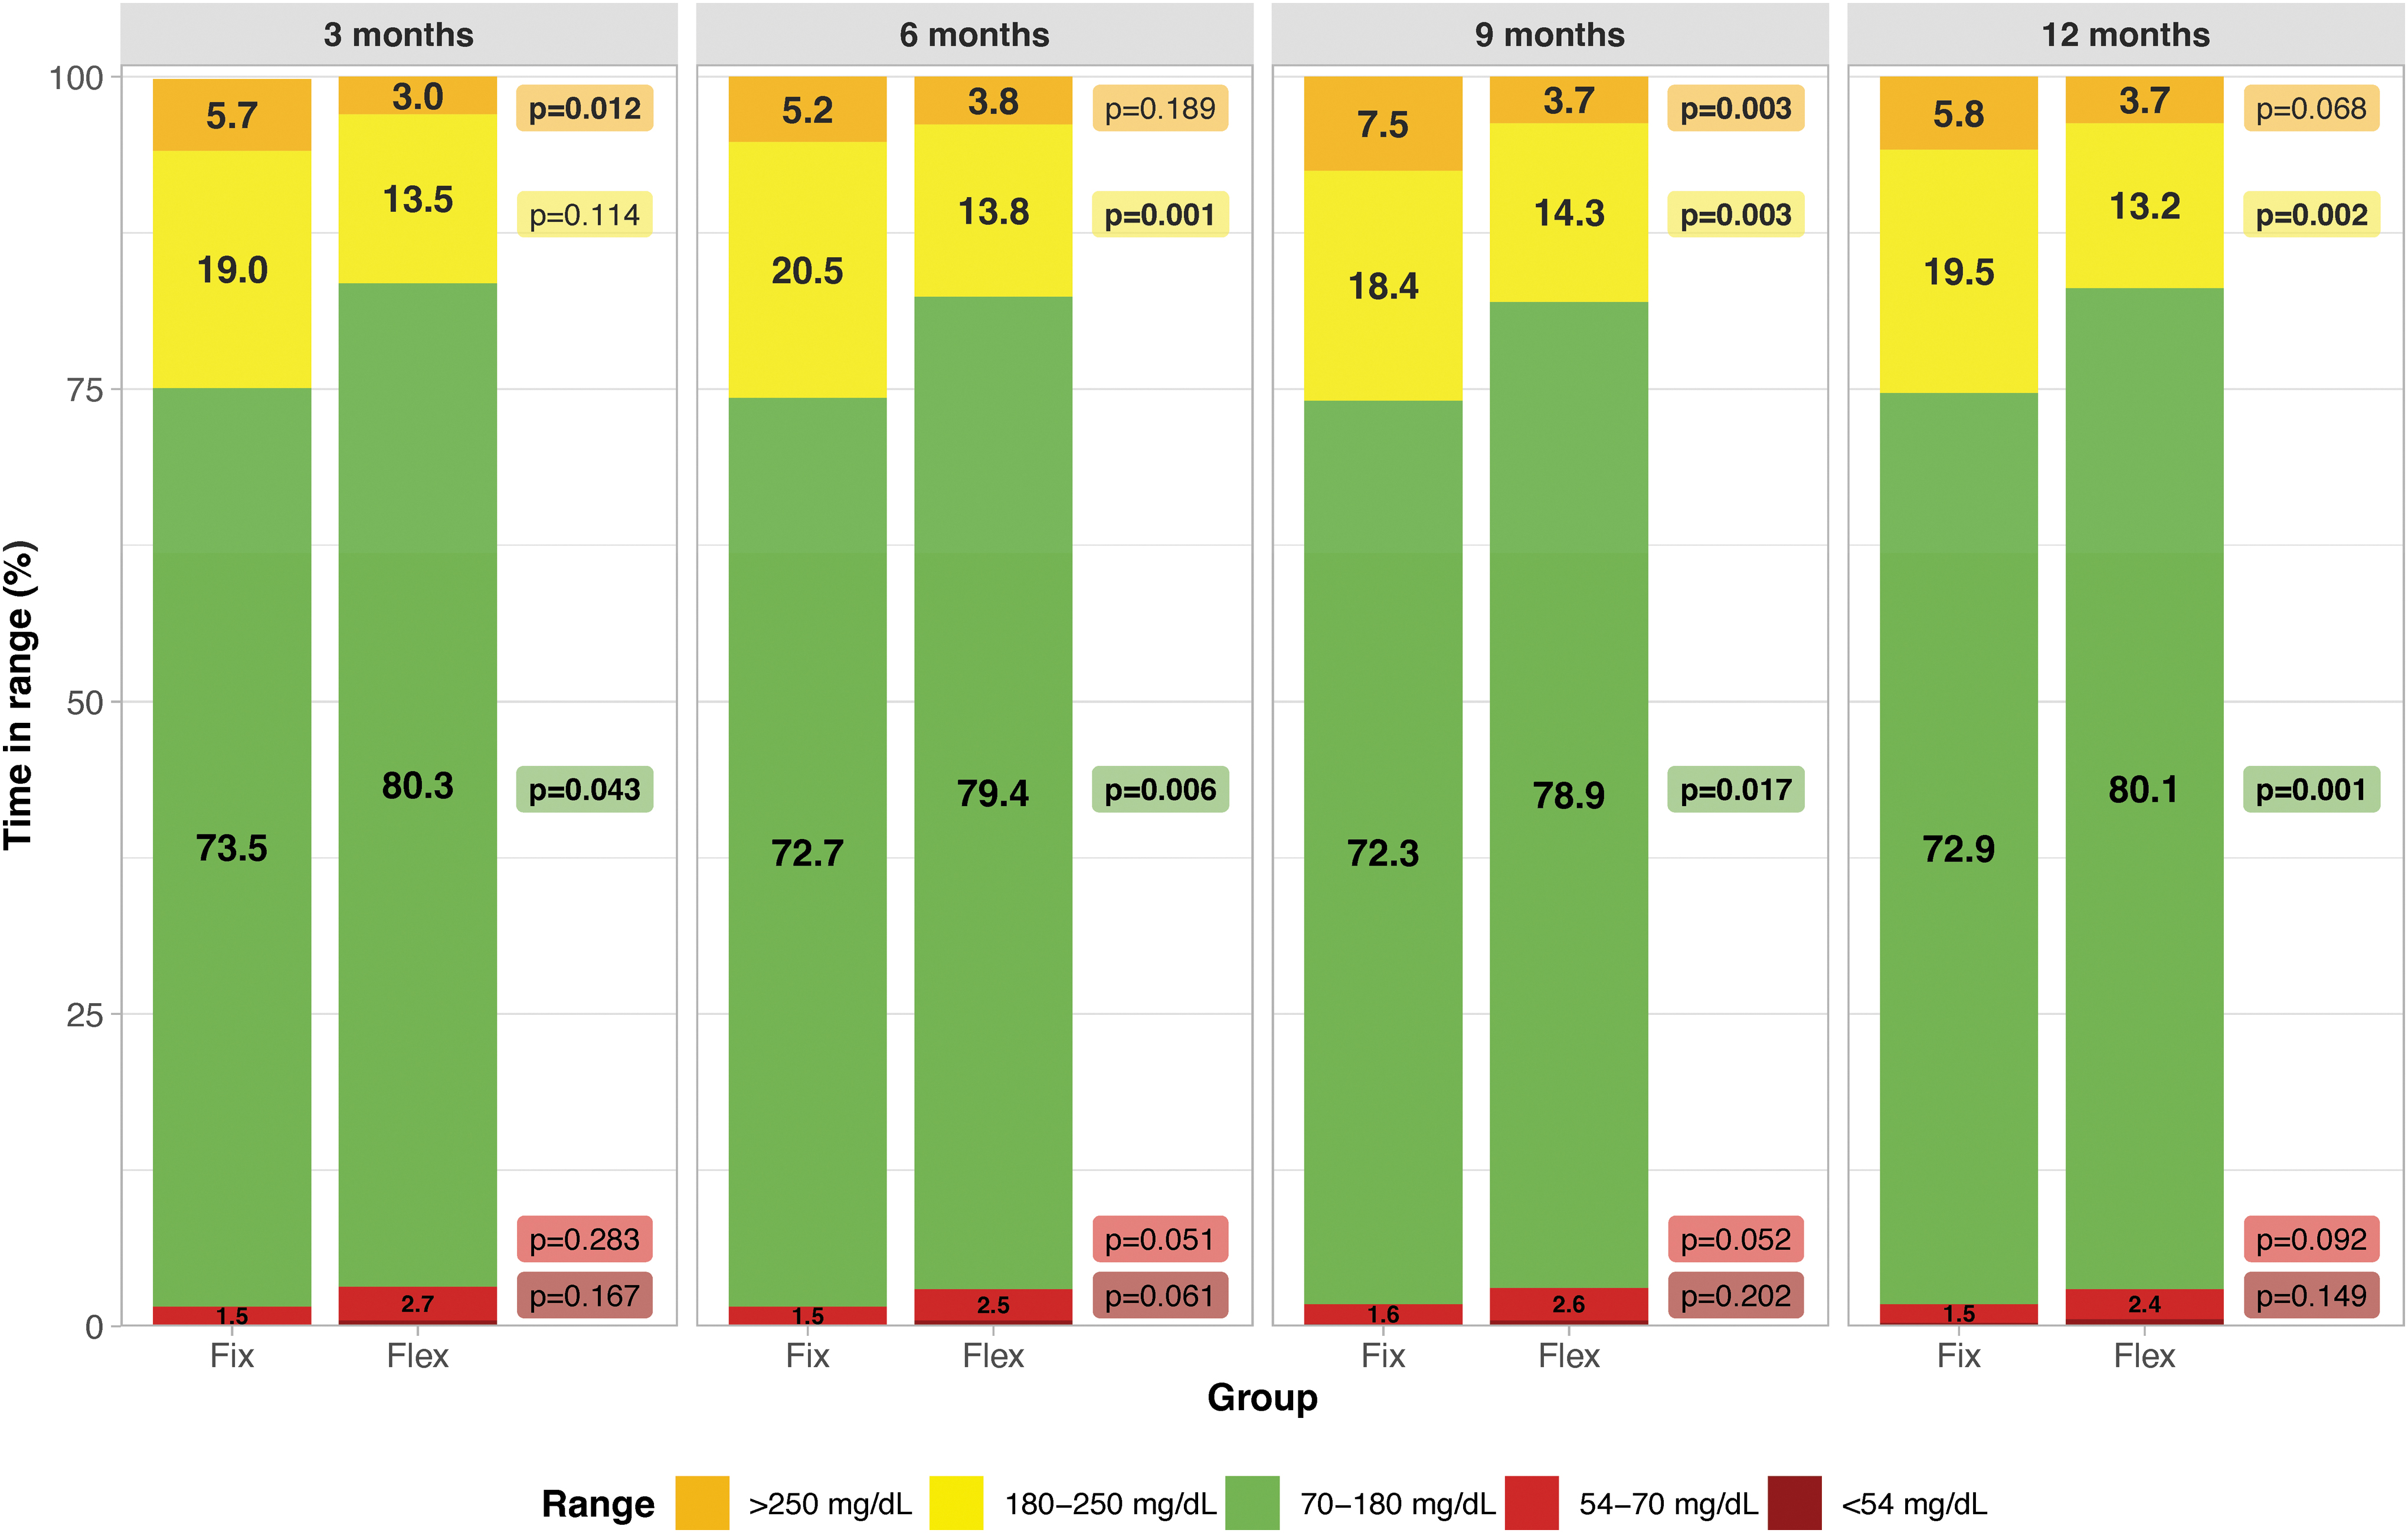
Proportion of time in ranges over the four study periods. Values are shown as percentage of time spent in ranges during the interval. Time with glucose values <54 mg/dL are not shown on the graph and are as follows, fix versus flex: 0.1% ± 0.3% versus 0.5% ± 0.3%, P = 0.167 at 3 months, 0.1% ± 0.4% versus 0.5% ± 0.7%, P = 0.061% at 6 months, 0.2% ± 0.3% versus 0.5% ± 0.4%, P = 0.202 at 9 months and 0.3% ± 0.4%, P = 0.149 at 12 months.
Mean HbA1c was between 0.1% and 0.3% lower in the flex group at all time points, but none of the differences reached statistical significance based on either the prespecified Student's t tests at each time point or the post hoc MMRM analysis at each time point or overall (overall P = 0.097; Table 1, Fig. 2 and Supplementary Fig. S1). HbA1c trajectories for each patient are presented in Supplementary Figure S2. There were also no significant differences in mean sensor glucose readings between the fix and flex groups (Table 1).
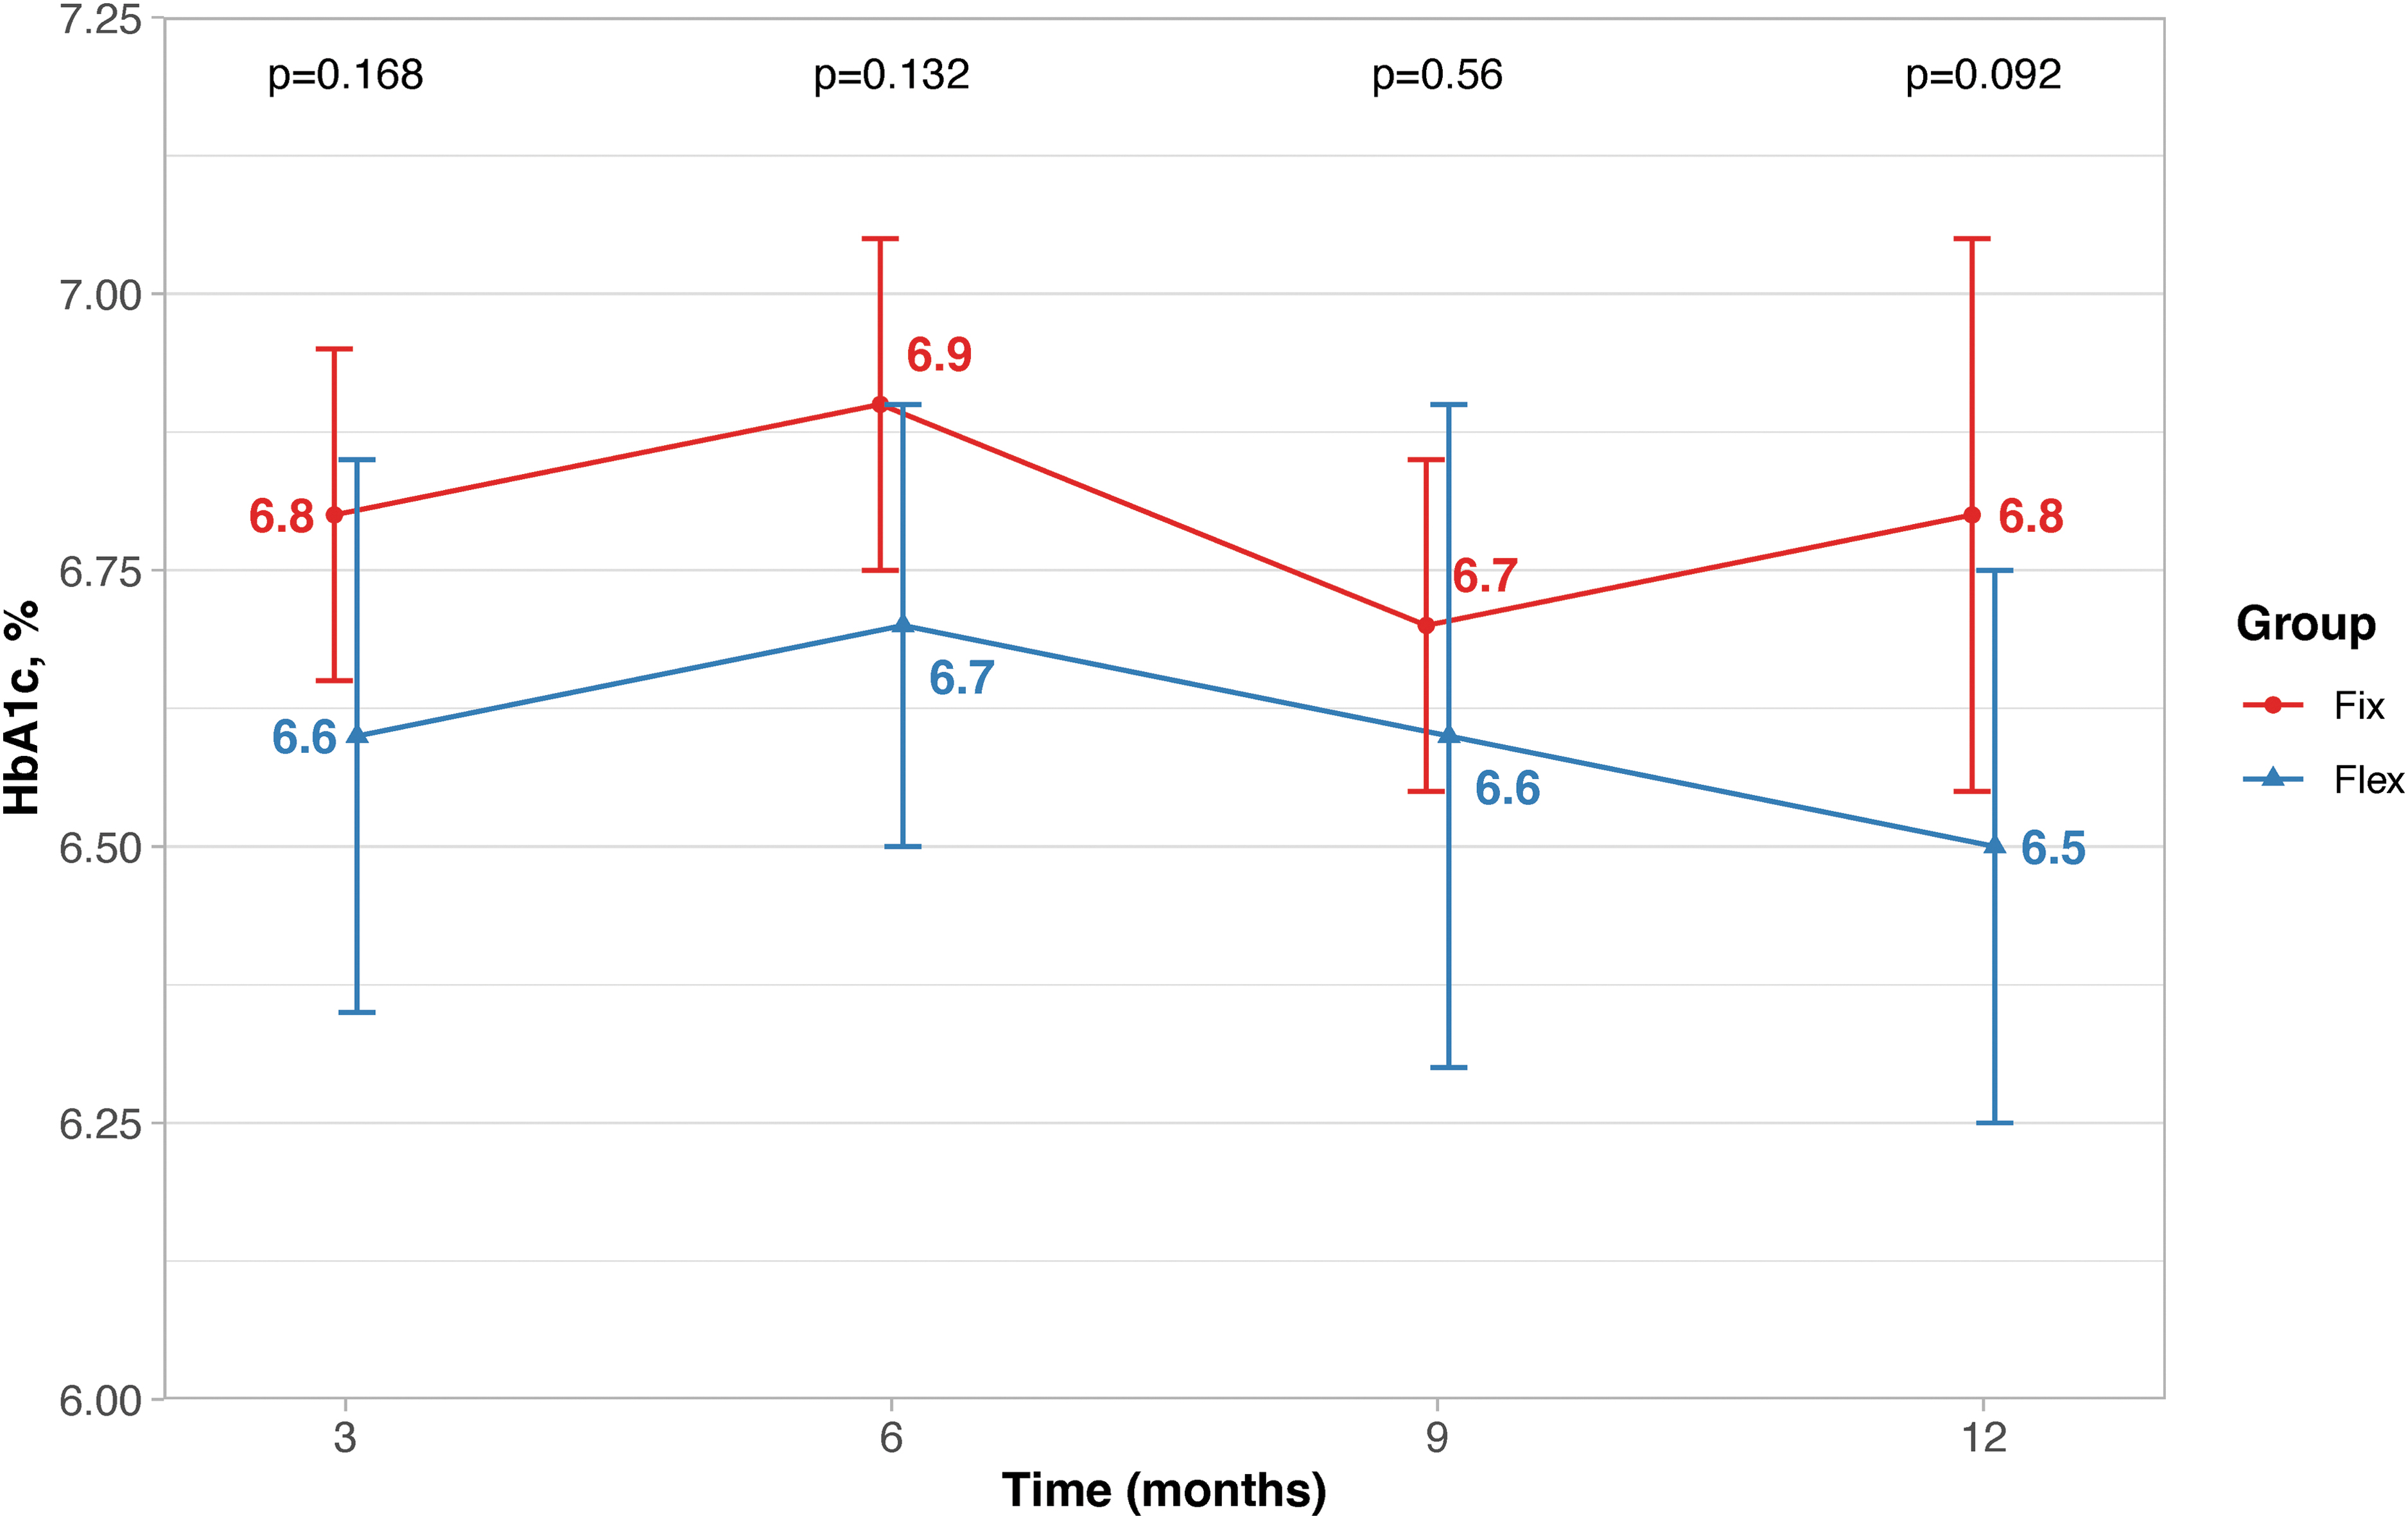
Mean glycated hemoglobin over time. Error bars represent one standard deviation centered around the mean.
Glycated Hemoglobin and Sensor Glucose Outcomes at Each Time point
Values are shown as mean ± SD, unless otherwise specified. Bold P values denote P < 0.05.
CI, confidence interval; HbA1c, glycated hemoglobin.
Insulin delivery and meal announcement
TDD per kilogram per day stayed constant at 1.1 U/(kg·day) in both arms at each time point (Table 2). There was, however, a significant difference in the quantity of insulin that was administered as autocorrection doses at every time point (Fig. 3 and Table 2), with participants in the fix group receiving 16.7 U/day at 12 months versus 8.3 U/day in the flex group (P = 0.001). Conversely, participants in the flex group administered significantly more insulin as manual doses than those in the fix group at all time points, with participants in the flex group administering 34.0 U/day at 12 months versus 26.0 U/day in the fix group (P = 0.008; Fig. 3 and Table 2).
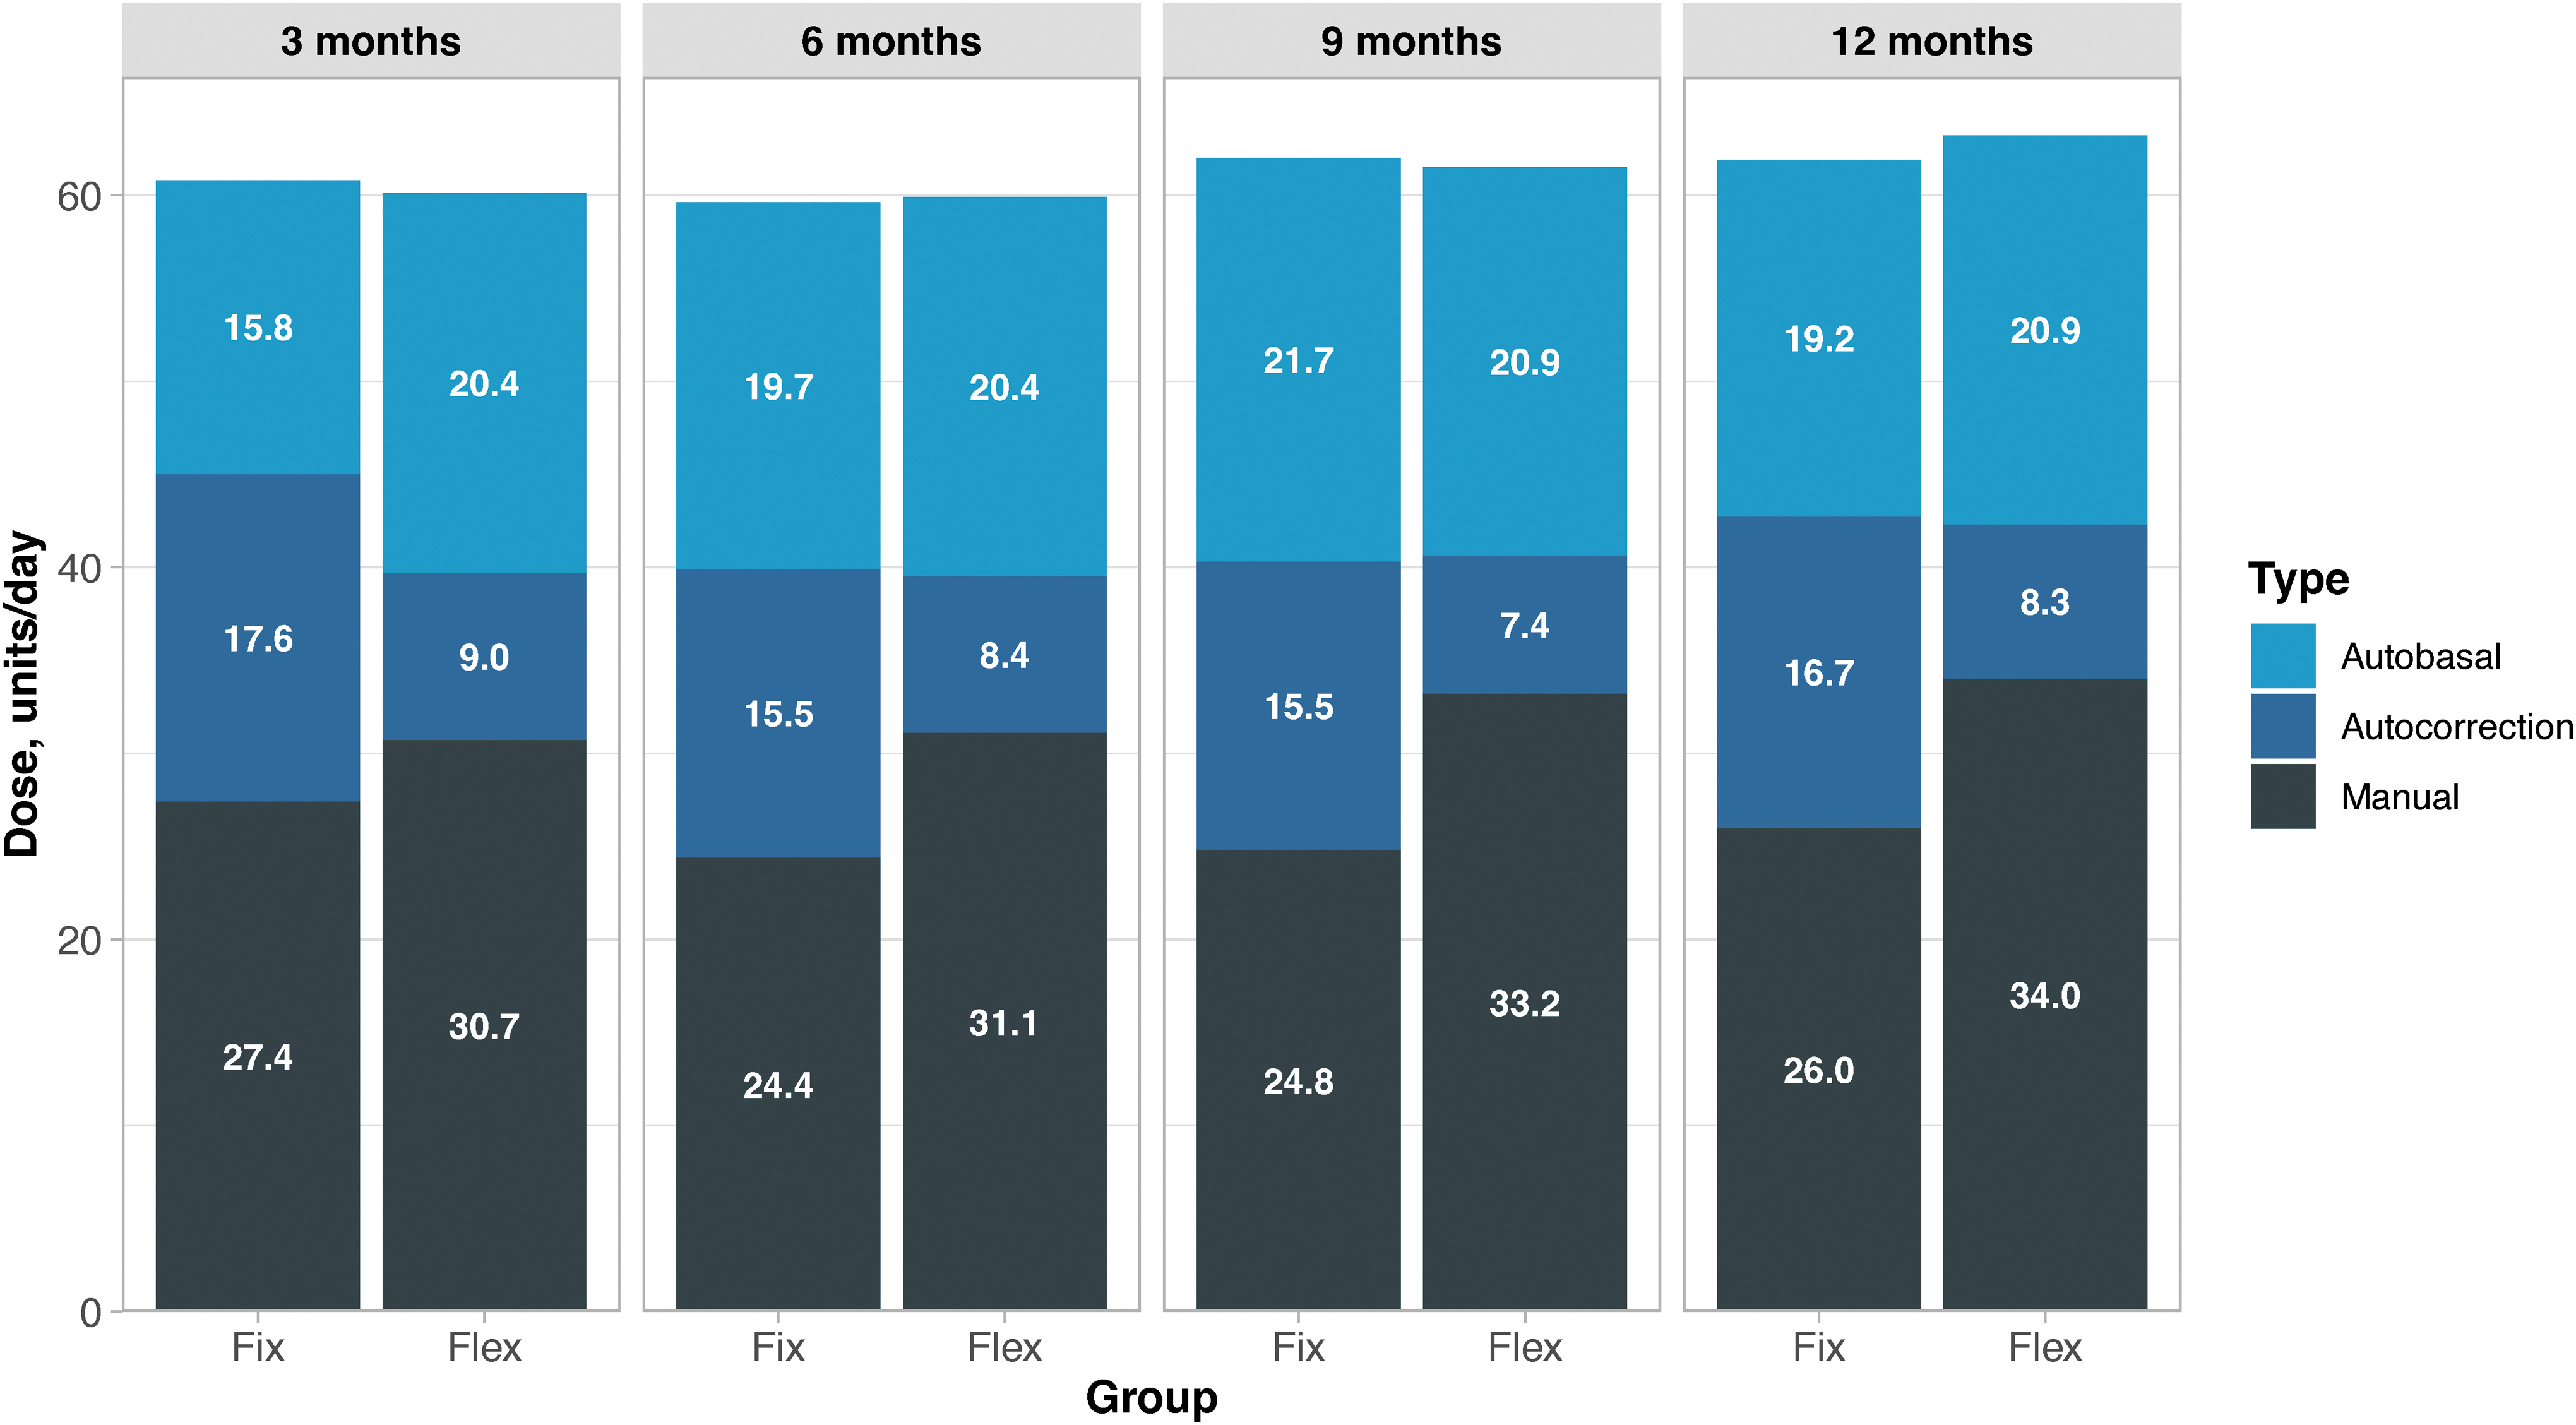
Number of daily units of insulin administered as basal, autocorrection, and manual doses with the MiniMed™ 780G system.
Insulin Dosing, Use of Autocorrection Boluses, and Patient Weight
Values are shown as mean ± SD, unless otherwise specified. Bold p values denote P < 0.05.
TDD, total daily dose.
The number of meals recorded per day was also significantly different at all time points, with patients in the fix group reporting significantly fewer meals per day than those in the flex group (3.8 vs. 5.5 at 12 months, P = 0.003; Supplementary Table S2).
MiniMedTM 780G system use and settings
There were no significant differences in the MiniMed™ 780G system use or settings at any time point. As in the 3-month study, participants wore the CGM sensor >92% of the time and were in advanced HCL mode (with SmartGuard active) for >90% of the time in both arms at every time point (Supplementary Table S3). The number of advanced HCL “exits” per patient per week also did not differ between groups, with both groups reporting 0.7 exits per week at 12 months (P = 0.984; Supplementary Table S3).
After the initial decrease in the daily number of self-monitoring of blood glucose tests conducted in both groups from baseline over the course of the 3-month study (from 0.8 tests/day to 0.4 tests/day and from 0.7 tests/day to 0.3 tests/day in the fix and flex groups, respectively), 17 the mean number of tests remained between 0.5 and 0.7 tests/day for both groups throughout the 3- to 12-month follow-up period (Supplementary Table S3).
In terms of optimal pump settings, most participants were using the recommended optimal settings. At the 3-month follow-up, 94% of patients used the system with an active insulin time of 2 h and glucose target of 100 mg/dL, and these settings were maintained through the 12-month follow-up.
Discussion
To our knowledge, this study represents the longest follow-up of any study investigating simplified meal announcement versus carbohydrate counting in adolescents with T1D using an HCL system. The study found that results from the 3-month study were maintained over the full 12-month duration of the study; significant differences in TIR (70–180 mg/dL) and time with sensor glucose between 180 and 250 mg/dL were present at the 6-, 9-, and 12-month time points. However, there were no significant differences in HbA1c, with intergroup differences ranging from 0.1% at 9 months to 0.3% at 12 months.
The findings of lower TIR in the fix group should be placed in the context of the results from the 3-month study, which saw a substantial and significant improvement from baseline TIR in both treatment groups as soon as 1 week after initiation of the advanced HCL. During the 7-day run-in period, mean TIR (70–180 mg/dL) was 47.5% in the fix group versus 49.1% in the flex group. In weeks 5–8 after initiation of the advanced HCL, mean TIR had increased to 74.8% in the fix group (an increase of 27.3% from baseline) and 80.7% in the flex group (an increase of 31.6% from baseline). 17
The present study showed that these levels were maintained over the full 12-month follow-up period, with TIR at 72.9% in the fix group and 80.1% in the flex group at 12 months. Regardless of the meal announcement method assigned to the patient, use of the MiniMed™ 780G system resulted in significant and clinically meaningful improvements in TIR relative to continuous glucose monitoring in combination with the patient's previous insulin administration approach, either MDI or pump. Furthermore, on average, both groups managed to achieve international targets for glycemic control, both in terms of HbA1c and TIR. 22
In the present study, 94% of participants used the optimal settings (glucose target of 100 mg/dL and active insulin time of 2 h) during the 12-month follow-up, which likely contributed to the high glycemic outcomes. These settings are known to be predictors for a higher TIR. 20
The two patients who switched from the fix group to the flex group present an interesting case study for the adoption of simplified meal announcement in real-world practice. While carbohydrate counting can be complex and place a substantial burden on the patient, patients who are well-trained and familiar with this method may be more comfortable with precise carbohydrate counting for a variety of reasons. However, after 3 months of the study, the majority individuals in the fix group (15/17) decided to continue using simplified meal announcement, despite their previous experience with carbohydrate counting, which demonstrates patients' satisfaction with this new approach of meal announcement.
Regarding the findings in a broader context, one other recent small-scale randomized study, conducted over a shorter follow-up period, demonstrated that a simplified “qualitative meal-size estimation” strategy failed to reach noninferiority versus carbohydrate counting in patients T1D using the iPancreas system for automated insulin delivery. 23 The simplified method used four carbohydrate categories of low, medium, high, or very high, with prandial insulin boluses, then administered based on individualized insulin-to-carbohydrate ratios. Mean TIR in the study was 74.1% with carbohydrate counting versus 70.5% with the simplified method. Noninferiority of the qualitative meal-size estimation approach was not confirmed based on a predefined noninferiority margin of 4%, but the authors concluded that the qualitative approach still achieved a high time in range and low time in hypoglycemia. 22
As noted in the original report on the 3-month follow-up period, the specific approach to simplified meal announcement adopted in the study may have room for some improvement. The announcement of significantly fewer meals in the fix group versus the flex group (3.7 vs. 5.1 per day, respectively, after 3 months) continued for the duration of continuation phase, with significant differences between arms at every time point. The fix group reporting is likely an underrepresentation of the true number of meals, potentially arising from user trepidation to record meals where they did not align with the user's perception of the fixed carbohydrate categories of regular meal, large meal, or snack.
The study had some limitations that should be acknowledged. Some of the limitations of the 3-month study remained, including the relatively small cohort, and the exclusion of patients with limited experience of carbohydrate counting. The exclusion of participants during the 7-day run-in period, whose estimated carbohydrate intake deviated >20% from the actual ingested amount of carbohydrate would likely have increased the accuracy of the carbohydrate intake estimates input into the MiniMed™ 780G system. The results in the flex group are therefore likely to have been enhanced relative to a population without this inclusion criterion.
Only 3 of the 41 (7.3%) otherwise eligible patients were excluded from the trial on these grounds and the effect of these exclusions is therefore likely to have been relatively small in the present study; however, it is conceivable that these excluded participants—as opposed to patients accomplished in carbohydrate counting—may have been ideal candidates for the simplified meal announcement strategy. Finally, the small sample size reduced the power of the analysis and precluded multiplicity adjustments for the analyses of secondary outcomes and outcomes over multiple time points.
Despite the limitations, one of the key strengths of the study was the randomized, controlled design; the randomization resulted in patient characteristics that were similar in the two groups at baseline, increasing the likelihood that differences in glycemic control over the course of the study were attributable to the assignment of meal announcement method. One of the other key strengths of the present study was the length of follow-up, confirming that many of the findings from the 3-month study period were ultimately maintained over 12 months.
Conclusions
The present follow-up study confirmed that glycemic control in adolescents with T1D using simplified meal announcement versus carbohydrate counting was maintained over the longer 12-month follow-up period. Mean TIR (70–180 mg/dL) was significantly lower in the fix group than the flex group at all time points; however, at each of the 3 monthly intervals over a 12-month follow-up period, individuals in the fix group did not have significantly different HbA1c from participants using carbohydrate counting, and mean HbA1c in both arms remained below 7% at all reported time points.
Despite the significantly higher TIR (70–180 mg/dL) with carbohydrate counting versus simplified meal announcement, participants in both groups achieved international glycemic control targets in terms of both HbA1c and TIR. This suggests that training patients to accurately estimate carbohydrate intake is still an important objective with current HCL systems, but the simplified meal announcement approach may have utility in patients who find carbohydrate counting particularly burdensome or challenging.
Footnotes
Acknowledgments
The authors thank Covalence Research Ltd for editorial and statistical support.
Authors' Contributions
G.P. coordinated the study. G.P. and J.C. designed the study and interpreted the results. G.P., J.C., M.P., F.U., M.H., and A.K. screened and enrolled participants, arranged informed consent from the participants, and took samples. G.P., J.C., and K.H. contributed to the data and statistical analyses. G.P., J.C., K.H., T.v.d.H., and S.N.E. wrote the article. All authors critically reviewed the article. G.P. and J.C. are the guarantors of this work and, as such, had full access to all the data in the study and take responsibility for the integrity of the data and the accuracy of the data analyses.
Author Disclosure Statement
G.P. received speakers' bureau honoraria from Sanofi, Abbott, Novo Nordisk, Medtronic, and Dexcom along with travel and accommodation expenses from Dexcom. J.C. received travel and accommodation expenses from Dexcom, Abbott, and Medtronic. T.H. and S.E. are employees of Medtronic. No other potential conflicts of interest relevant to this article were reported.
Funding Information
This study was funded by Sidra Medicine. Preparation of the article and the article publishing fees were funded by Medtronic International Trading Sàrl.
Supplementary Material
Supplementary Figure S1
Supplementary Figure S2
Supplementary Table S1
Supplementary Table S2
Supplementary Table S3
References
Supplementary Material
Please find the following supplemental material available below.
For Open Access articles published under a Creative Commons License, all supplemental material carries the same license as the article it is associated with.
For non-Open Access articles published, all supplemental material carries a non-exclusive license, and permission requests for re-use of supplemental material or any part of supplemental material shall be sent directly to the copyright owner as specified in the copyright notice associated with the article.