
Abstract
Objective:
Previous studies revealed that hemoglobin A1c (HbA1c) increased overall in the United States in the past decade. In addition, health inequities in type 1 diabetes (T1D) outcomes by race/ethnicity and insurance type persist. This study examines the trends in HbA1c from 2016 to 2022 stratified by race/ethnicity and insurance in a large multicenter national database.
Research Design and Methods:
We analyzed glycemic outcomes and diabetes device use trends for >48,000 people living with type 1 diabetes (PwT1D) from 3 adult and 12 pediatric centers in the T1D Exchange Quality Improvement Collaborative (T1DX-QI), comparing data from 2016 to 2017 with data from 2021 to 2022.
Results:
The mean HbA1c in 2021–2022 was lower at 8.4% compared with the mean HbA1c in 2016–2017 of 8.7% (0.3% improvement; P < 0.01). Over the same period, the percentage of PwT1D using a continuous glucose monitor (CGM), insulin pump, or hybrid closed-loop system increased (45%, 12%, and 33%, respectively). However, these improvements were not equitably demonstrated across racial/ethnic groups or insurance types. Racial/ethnic and insurance-based inequities persisted over all 7 years across all outcomes; comparing non-Hispanic White and non-Hispanic Black PwT1D, disparate gaps in HbA1c (1.2%–1.6%), CGM (30%), pump (25%–35%), and hybrid-closed loop system (up to 20%) are illuminated.
Conclusion:
Population-level data on outcomes, including HbA1c, can provide trends and insights into strategies to improve health for PwT1D. The T1DX-QI cohort showed a significant improvement in HbA1c from 2016 to 2022. Improvements in diabetes device use are also demonstrated. However, these increases were inconsistent across all racial/ethnic groups or insurance types, an important focus for future T1D population health improvement work.
Introduction
Several studies have shown that, on average, people with type 1 diabetes (PwT1D) in the United States do not meet the current American Diabetes Association hemoglobin A1c (HbA1c) goal of <7%. 1 –3 The T1D Exchange Clinic Registry (T1DX-Registry) and other multicenter U.S. registry studies demonstrated a worsening longitudinal trend in HbA1c across the lifespan from 2010 to 2018. 4 –6 International comparisons have revealed that PwT1D in the United States had worse glycemic outcomes than those in Sweden, Germany, Austria, England, and Wales. 7 –9 Few studies have demonstrated U.S. outcomes by race/ethnicity and insurance.
T1D Exchange Quality Improvement Collaborative (T1DX-QI) is a T1D multicenter data-sharing collaborative that was established in 2016 10,11 to promote quality improvement (QI), implement best practices, and use center-wide deidentified electronic medical records (EMRs) data for outcomes benchmarking and population health improvement. 10 –14 T1DX-QI has grown from 10 centers in 2016 to >50 pediatric and adult centers across 21 states in the United States.
To our knowledge, no large multicenter study in the United States has been published to describe recent trends in glycemic outcomes since the well-known T1DX-Research study showed an increase in mean HbA1c from 2010 to 2018. 4 In addition, few studies have explored longitudinal glycemic outcomes by race and ethnicity and insurance type. In this study, we describe recent trends in glycemic outcomes and diabetes technology use within the T1DX-QI database of >48,000 PwT1D and assess differences in these outcomes by race/ethnicity and insurance type.
Methods
Data source
The T1D Exchange Quality Improvement Collaborative (T1DX-QI) differs from the T1DX-Research in a few keyways. Notably, the T1DX-QI represents EMR data from all persons receiving care from participating centers, whereas T1DX-Research represents ∼35% of the clinic population that signed up to participate in the registry. 4 In addition, data from the T1DX-QI EMR database are available to T1DX-QI centers for QI, population health analysis, benchmarking, and visualization in a provider-facing QI Portal, as opposed to the T1DX-Research, which was primarily designed as a clinical research study registry. Furthermore, T1DX-QI has a higher proportion of pediatric centers participating (52%) than the T1DX-Registry (20%). 2,4,7,10,15
In 2016, T1DX-Research centers were invited to participate in the T1DX-QI. Ten academic pediatric and adult centers across the United States formed the first T1DX-QI cohort. The establishment of the T1DX-QI network, quality improvement initiatives, and real-world data collection processes has been described in previous publications. 10 –13,15,16 Currently, there are >50 T1DX-QI centers recruited through various means, including targeted outreach to safety net hospitals to increase racial diversity and geographical representation.
T1DX-QI centers share patient-level deidentified EMR data per T1DX-QI data specifications after completing an extensive data mapping and validation process, which has been well described. 15 EMR data files include information on deidentified individual-level demographics (including patient-reported race/ethnicity, insurance type, and T1D diagnosis date) and diabetes-related variables, including HbA1c among other laboratory values, diabetic ketoacidosis, and severe hypoglycemia hospitalization rates, and diabetes technology use. 15 –17
To be included in this study, centers must have been affiliated with the T1DX-QI during the study period and completed data mapping. This filtered the number of eligible centers to 12 pediatric and 3 adult active in the network for both periods in the analysis. All 15 included centers identified as academic medical institutions serving urban areas. We included PwT1D from these centers with at least one HbA1c measurement available from each reported year. PwT1D aged <1 year, had a duration of diabetes <1 year, or had missing data were excluded from the analysis; reported percentages are based on available data (described in Supplementary Table S1). The T1DX-QI has published previous studies describing this database. 16 –19
The primary outcome measure for this study is longitudinal trends in HbA1c. Additional details about inclusion criteria for our study cohort are described in Supplementary Figure S1. This study was completed according to the STROBE guidelines for reporting observational studies. 20,21
The Western Institutional Review Board centrally approved this as an exempt population-based study with HIPAA consent waived, as no identifiable information was used. The centers also obtained necessary ethical approvals to share deidentified data with T1DX-QI.
Data analysis
The mean duration of T1D in years was calculated using the documented date of T1D diagnosis. Mean and median HbA1c for each age group were calculated using each individual's most recent HbA1c during the study period (2016–2022). The percentages of PwT1D with HbA1c <7% or >9% are also presented. We analyzed the use of a continuous glucose monitor (CGM), insulin pump, and hybrid-closed loop system (HCLS) across each of the 7 years. As appropriate, the paired t-test or McNemar's test was used for significance testing when comparing demographic groups. Figures depicting HbA1c trends show variation in outcomes by presented group using error bars (25th and 75th percentiles).
Glycemic control was analyzed and compared for the periods 2016/2017 and 2021/2022. For PwT1D with multiple HbA1c values during either reporting period, the mean HbA1c for that period was determined for each individual and then used in the analysis. PwT1D were grouped by 1-year age categories to compute mean HbA1c cross-sectionally and examine HbA1c distribution across the age span. Locally weighted smoothing (LOESS) smoothing was performed for the graphs.
Finally, differences in glycemic control by race/ethnicity and insurance type were examined during each reporting period. Results are displayed in age groups to account for age ranges (1–15, 16–25, 26–40, and 40+ years). Linear regression was used to calculate adjusted mean HbA1c by race/ethnicity groups, adjusting for age, gender, and duration of diabetes in model A and adjusting for age, gender, duration of diabetes, insurance, and technology use in model B. Results are presented as mean HbA1c with corresponding 95% confidence intervals (CIs).
PwT1D were propensity score matched using 1:1 matching with the nearest neighbor approach and a caliper of 0.1. PwT1D were matched by age (years), gender (female/male), and insurance type (private/public) into two race/ethnicity groups (non-Hispanic White [NHW] and non-Hispanic Black [NHB]/Hispanic). Similarly, PwT1D were matched for age (years), gender (female/male), and race/ethnicity (NHW, NHB, Hispanic) into two insurance groups (public and private). Analysis was completed using R statistical program version 2.4.1.
Results
The mean HbA1c in 2021–2022 was lower at 8.4% compared with the mean HbA1c in 2016–2017 of 8.7% (0.3% improvement) for all PwT1D seen in the included centers; P < 0.01 (Fig. 1A). The proportion of PwT1D with HbA1c <7% increased from 20% in 2016/2017 to 26% in 2021/2022. In the same time frame, the percentage of PwT1D with HbA1c >9% decreased from 43% to 31%. An analysis of glycemic change only among PwT1D who contributed data in both study periods also demonstrates significant improvement (mean HbA1c of 8.4% in 2021/2022 compared with 8.5% in 2016/2017 (P < 0.01, Fig. 1B).
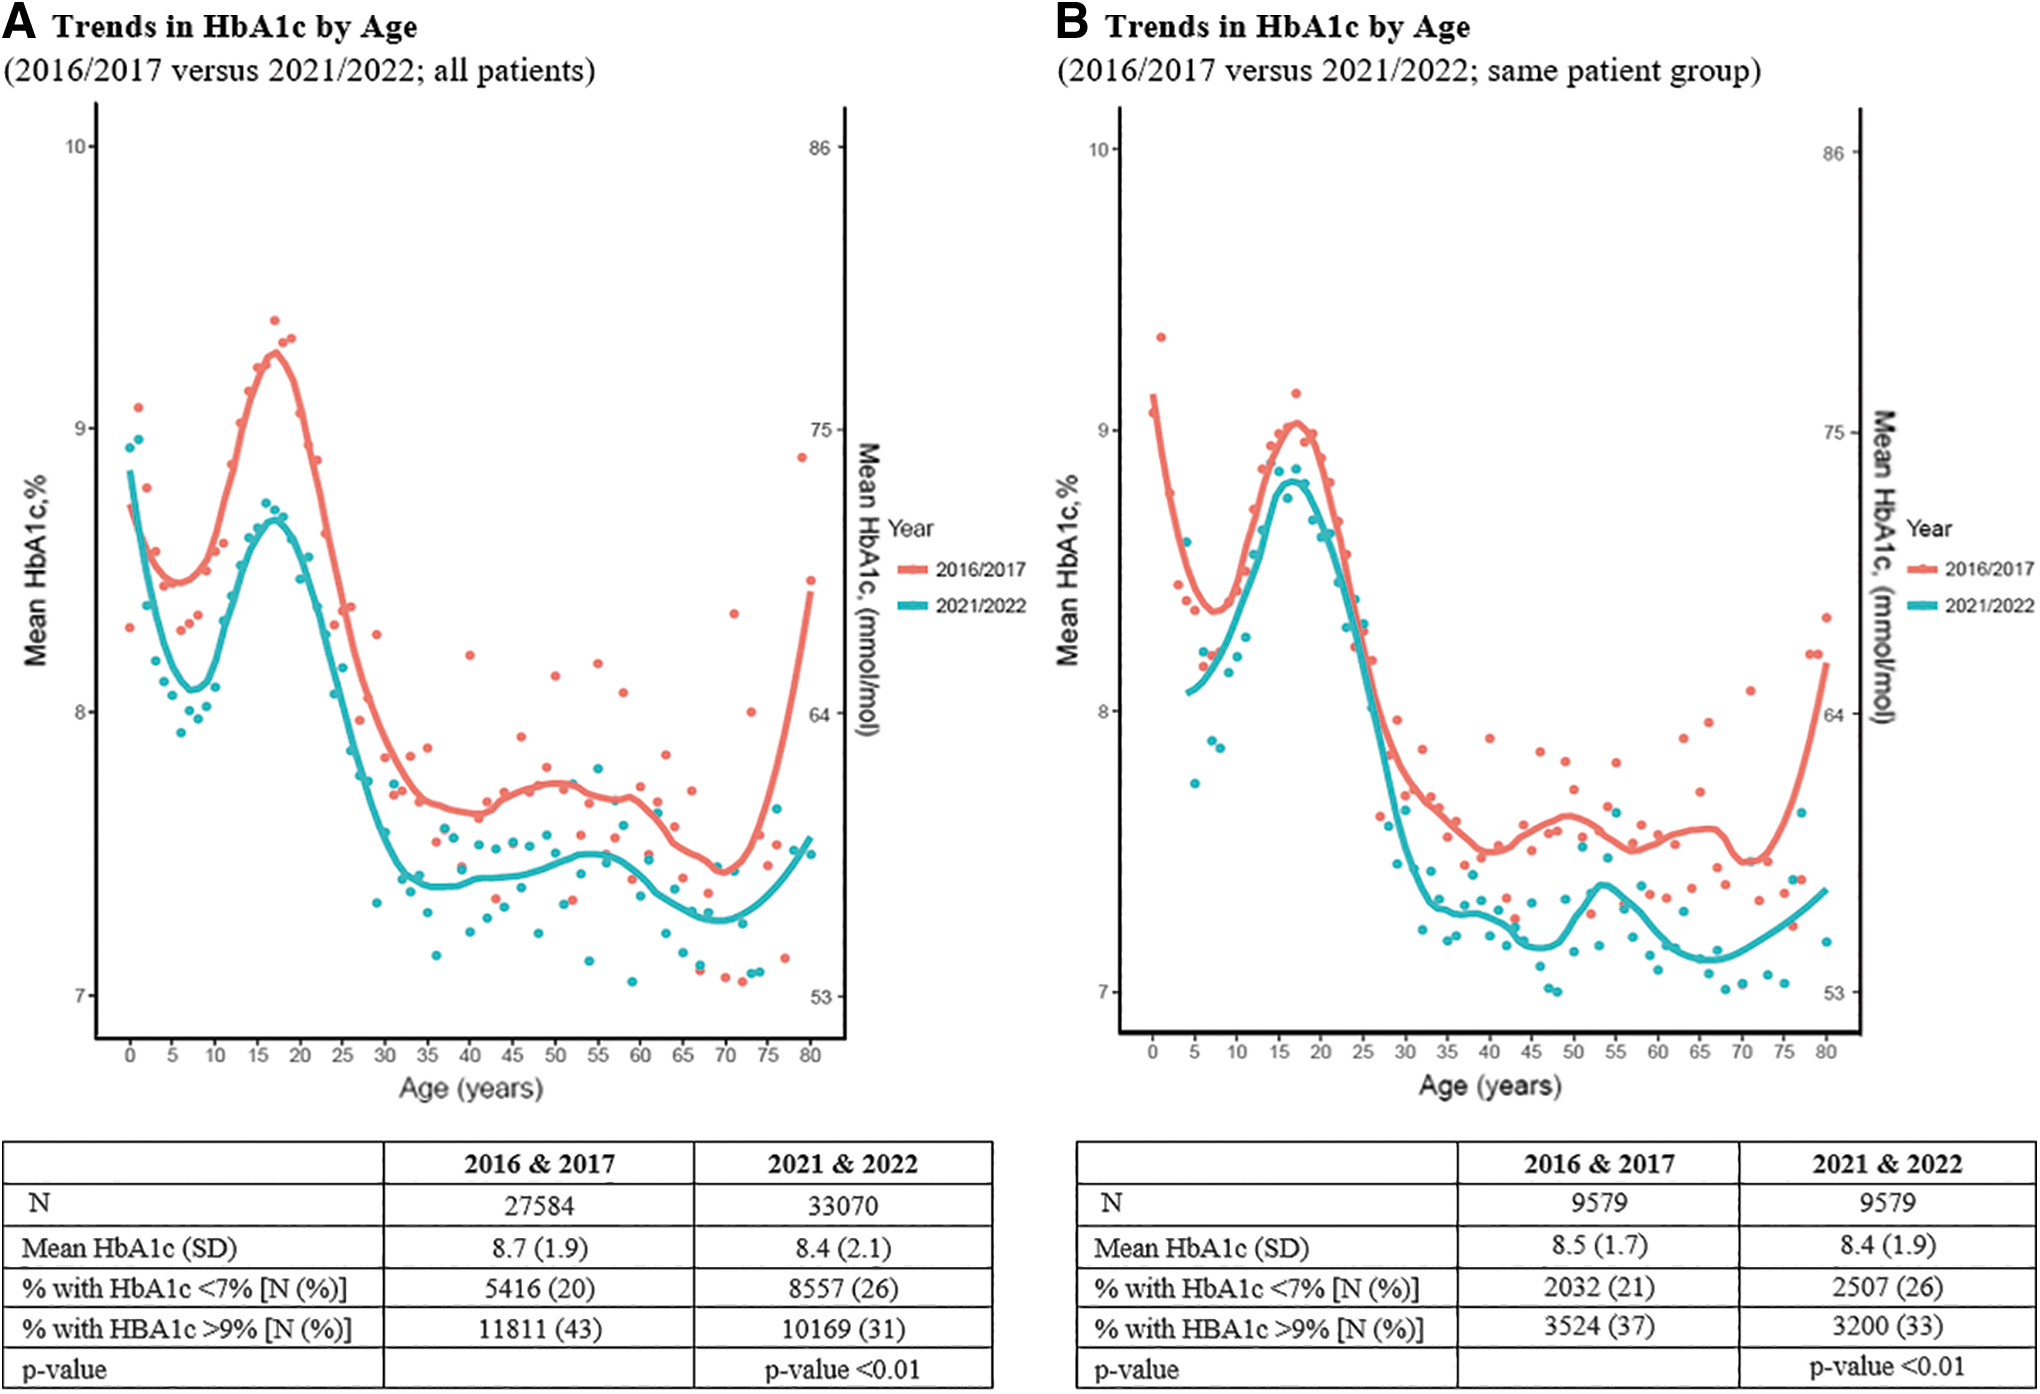
Trends in HbA1c by age 2016/2017 versus 2021/2022. This figure depicts trends in HbA1c by age comparing time periods (2016/2017 vs. 2021/2022).
This group saw a 5% increase in the percentage of PwT1D with HbA1c <7% and a 4% decrease in the percentage of PwT1D with an HbA1c >9%. Table 1A demonstrates mean differences in HbA1c by age group. Young adults aged 16–25 years experienced the most considerable difference in mean HbA1c (−0.6%) between the two periods. All four age groups (1–15, 16–25, 26–40, and 40+ years) experienced a statistically significant decrease in mean HbA1c. Table 1B demonstrates mean differences in HbA1c by age group and insurance type between the two study periods. Across most age groups, PwT1D with private insurance experienced a larger favorable HbA1c reduction than those who are publicly insured.
Mean Differences in Hemoglobin A1c
Unadjusted data presented.
HbA1c, hemoglobin A1c; SD, standard deviation; SE, standard error.
Supplementary Table S1 presents demographic information by major racial/ethnic groups. Most NHW people were privately insured (59%), compared with 30% and 35% of NHB and Hispanic PwT1D, respectively. The average duration of T1D varied by racial/ethnic group (10.6 years in NHW, 7 years in NHB, and 8.4 years in Hispanic PwT1D). A higher proportion of NHW and Hispanic PwT1D was reported using technology compared with NHB PwT1D (respectively, 55% and 49% compared with 29% CGM use, 62% and 46% compared with 29% pump use, and 13% and 11% compared with 3% HCLS use).
While Figure 1 and Supplementary Table S1 demonstrate an improvement in HbA1c levels at every age, Supplementary Figures S2 and S3 illustrate that inequities persist despite overall improvement across various racial/ethnic groups or insurance types. Specifically, mean HbA1c decreased between 2016/2017 and 2021/2022 for PwT1D identified as NHW (from 8.6% to 8.0%) and Hispanic (9.0% to 8.6%), but mean HbA1c for NHB PwT1D remained relatively stable over this period (9.8% to 9.6%).
In addition to differences in trends, racial inequities persisted over all 7 years, with mean HbA1c for NHW PwT1D averaging 0.5% and 1.4% lower than Hispanic and NHB groups, respectively. Mean HbA1c decreased over the 7 years regardless of insurance type; however, the decrease was more prominent for privately insured individuals (0.5% difference, compared with 0.3% for publicly insured PwT1D).
Over the same period, CGM use increased between 2016/2017 and 2021/2022 across all major racial/ethnic groups (Fig. 2A). As with HbA1c, racial/ethnic inequities in CGM use persisted across this period; an ∼30% difference in CGM use persists between NHW and NHB PwT1D across all seven presented years. A moderate increase (12%) in use for all groups and similar racial/ethnic inequities are also seen in insulin pump use (Fig. 2B). All racial groups experienced increased HCLS use, though at disparate rates (Fig. 2C).
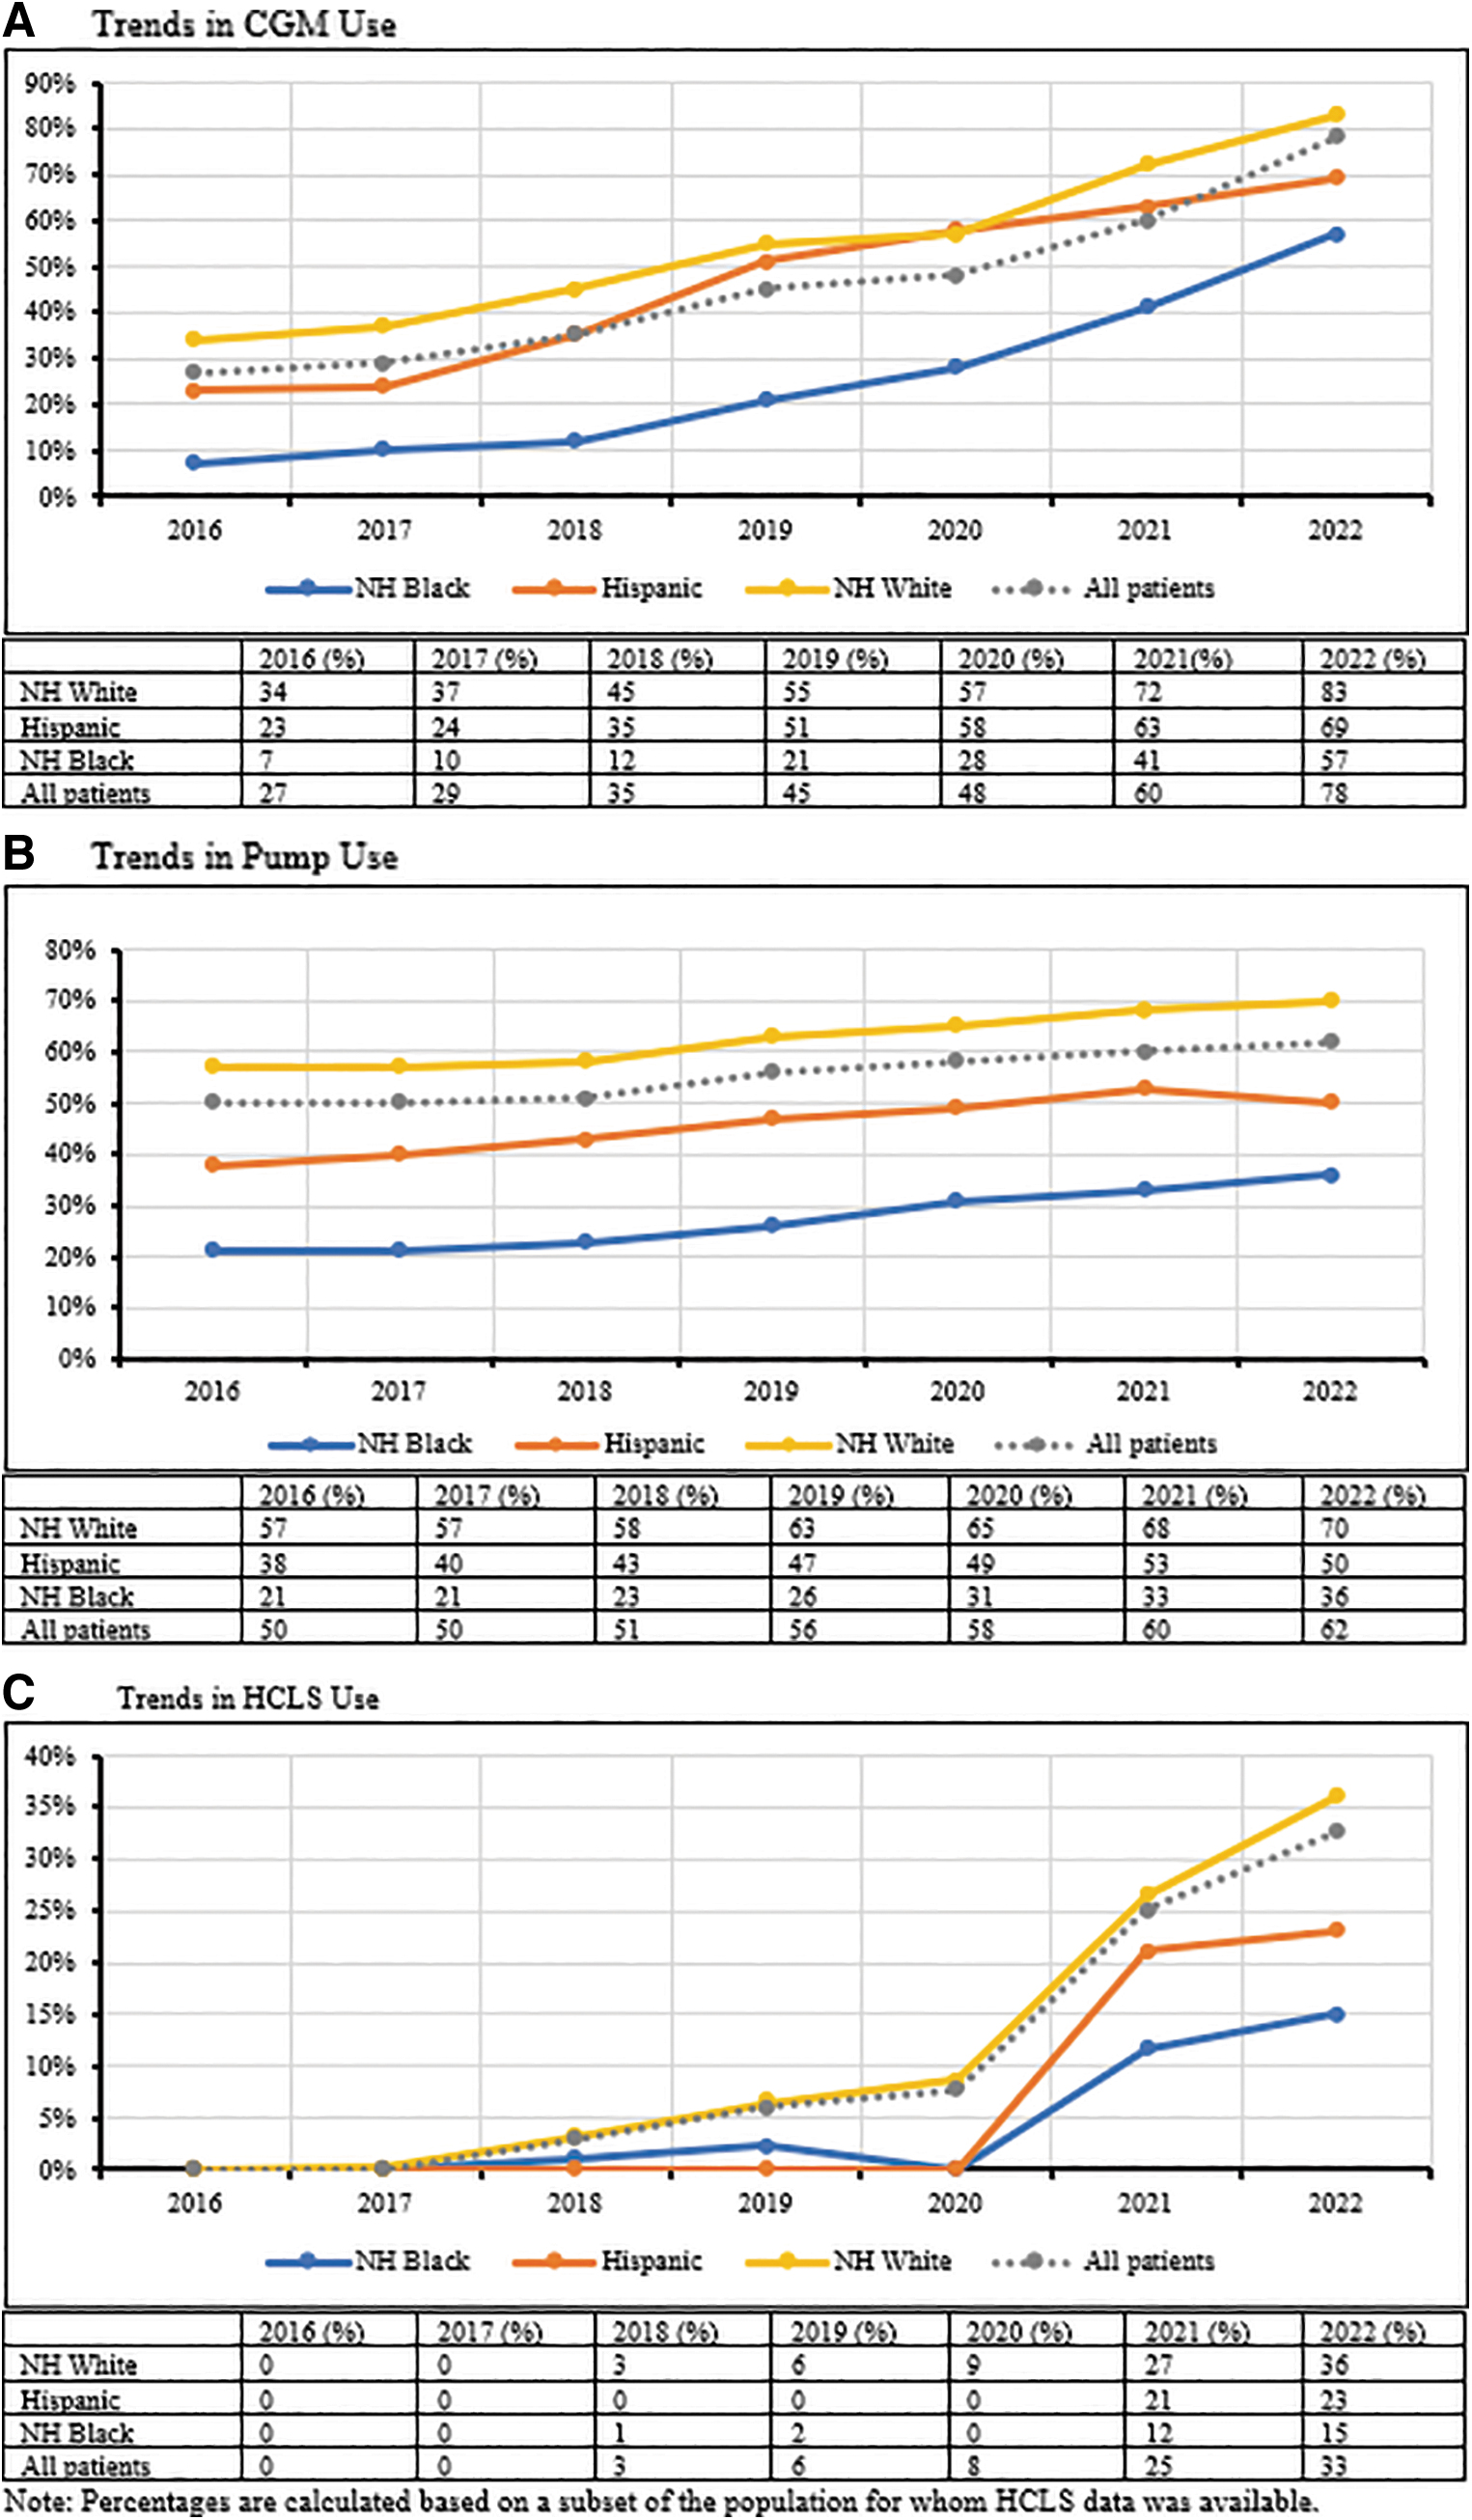
Trends in device use by race/ethnicity 2016–2022. This figure depicts trends in device use by race/ethnicity from 2016 to 2022, displayed by year and device type
Table 2A indicates that racial/ethnic disparities remain in HbA1c when controlling for age, gender, and duration of diabetes. Table 2B adjusts factors commonly associated with race/ethnicity, such as insurance type and use of diabetes technology. Although these factors help explain the racial/ethnic disparity to a degree, they do not account for the entire difference in HbA1c outcomes. Each racial/ethnic group experienced a statistically significant improvement in HbA1c. Despite this improvement, we see a considerable inequity in HbA1c and diabetes device use between NHW and NHB/Hispanic PwT1D across the study period (Supplementary Table S1).
Hemoglobin A1c by Race/Ethnicity Adjusted for Confounders 2016/2017 and 2021/2022
P < 0.0001.
CGM, continuous glucose monitor; CI, confidence interval; HCLS, hybrid-closed loop system; NHB, non-Hispanic Black; NHW, non-Hispanic White.
Table 3 shows more favorable glycemic outcomes for NHW PwT1D (mean HbA1c of 8.4%) as compared with their matched pairs who identified as NHB or Hispanic (mean HbA1c of 9.2). NHW PwT1D have significantly higher odds of having HbA1c <7% (odds ratio [OR]: 1.34, 95% CI: 1.23–1.45, P < 0.001) than NHB and Hispanic PwT1D. Similarly, privately insured PwT1D had more favorable glycemic outcomes (mean HbA1c of 7.9%) than their matched pairs on public insurance (mean HbA1c of 9%) in 2021/2022.
Glycemic Outcomes After Propensity Score Matching
Matched for age (years), gender (female/male), insurance (public/private).
Matched for age (years), gender (female/male), race/ethnicity (NHW, NHB, Hispanic).
PwT1D, People with Type 1 Diabetes.
PwT1D on private insurance have significantly higher odds of having HbA1c <7% (OR: 1.96, 95% CI: 1.84–2.09, P < 0.001) than publicly insured PwT1D. Although results for both propensity score matches were significant, odds of HbA1c <7% based on insurance status were slightly higher than based on race/ethnicity.
Discussion
This multisite analysis demonstrates improvement in glycemic outcomes and increases in diabetes technology use among PwT1D in T1DX-QI centers from 2016 to 2022. Although the HbA1c improvement over both study periods is slight (0.3%), it is positive, trending in the right direction, and clinically significant (due to the association with risk for micro- and macrovascular complications of diabetes). 22,23 In addition, the proportion of participants achieving an HbA1c <7% increased significantly from 21% to 26% during this time frame.
This study analyzes data from >48,000 PwT1D, roughly twice as many as in previous T1DX-Research publications. 2,4 This analysis also shows findings from a population that was both more racially/ethnically diverse and proportionately higher enrollment in public insurance between 2016 and 2022.
Although our findings present trends counter to previous U.S. analyses, 4,5 they are consistent with data from international registries that have demonstrated improvements in HbA1c and diabetes device use over a similar period. 7,24 Our findings are consistent with other studies highlighting the difficulty in achieving HbA1c <7%. 25
As evidence builds to demonstrate the correlation, increased adoption of advanced technologies could explain a portion of the observed improvement in HbA1c. 6,16,17,19,26 –29 Another explanation is that T1DX-QI has allocated resources toward multiple quality improvement projects over the past 3 years. T1DX-QI centers have implemented practice-wide interventions to improve care programs for high-risk PwT1D and to increase insulin pump and CGM use. 12,13 These projects support centers to reach glycemic targets in adult and pediatric populations and address disparities in the use of diabetes technology.
The positive impact of targeted QI projects such as these on glycemic outcomes is supported by several international publications. 30,31 The England/Wales National Pediatric Diabetes Audit, for example, demonstrated an improvement in HbA1c attributed to using QI strategies. 9
Significant differences in mean HbA1c by race and ethnicity are similar to those noted in the study by Foster et al. 4,6 This article also illustrates the adjusted racial/ethnic gap in HbA1c when controlling for factors such as insurance and diabetes device use. Previous publications by Foster et al. presented glycemic outcomes and device use adjusted for factors including race and ethnicity only. This analytic distinction is essential in demonstrating race as a social construct, and socioeconomic differences do not entirely explain health inequities.
This strengthens the need to advocate for funded studies that further evaluate the role of potential contributors and implement innovative programs to reduce the gap successfully. These findings align with previously published results demonstrating that insurance does not entirely account for racial/ethnic disparities in health outcomes. 17,32 –34
In 2021/2022, the odds of having HbA1c <7% were higher for PwT1D who identified as NHW or were privately insured than for propensity score-matched pairs.
Despite the HbA1c improvement across all age groups from 2016 to 2022, this study's observation of persistent gaps in glycemic outcomes has concerning implications PwT1D who identify as racial/ethnicity minorities or are publicly insured. These findings align with a large existing body of work that documents disparities in T1D-related outcomes within the United States. 25,35,36 In addition, although diabetes technology plays a crucial role in diabetes management, addressing technology coupled with insurance does not entirely account for the persistent and significant gap in HbA1c by race/ethnicity, even when accounting for age, gender, and duration of diabetes. 16,17,26 –29
Although this study presents a significant difference in mean HbA1c by race/ethnicity and insurance type, the distribution of the data (as illustrated in Supplementary Figs. S2 and S3) demonstrates major overlap between and considerable variability within groups. There is a need for future research to help identify the roles of potential contributors to diabetes outcomes. Contributors may include structural and systemic racism, utilization of various types of technology, and nature of principal care givers support. Furthermore, the role of health care providers, the impact of the coronavirus disease 2019 (COVID-19) pandemic, and PwT1D socioeconomic factors could be further studied. 6,37
Future research can evaluate the impact of equity-focused community interventions, including eliminating prior authorization for evidence-based interventions, timely initiation of diabetes technology, and broader policy advocacy to address barriers to care for minoritized racial/ethnic and publicly insured groups. In addition, the role of artificial intelligence to further support diabetes care (for example, predicting the 180-day risk of diabetes ketoacidosis-related hospitalization for youth with T1D) is worthy of future studies. 38
T1DX-QI centers are actively working to address some of the contributors to inequities among PwT1D by employing a multipronged approach, including using equity-adapted QI tools and an innovative 10-step equity framework. 39 –41 These approaches have demonstrated improvement in reducing inequities in diabetes technology adoption 42,43 and can potentially be applied in primary care setting and nonacademic centers.
Strengths and limitations
Major strengths of this study include the use of real-world epidemiological trends for multiple centers in the United States, a very large sample size, and the use of the same patients as their own control in a longitudinal format. This study also analyzes data from >48,000 PwT1D, roughly twice as many as included in previous T1DX-Research publications. 2,4 This analysis also shows findings from a more racially/ethnically diverse and proportionately higher publicly insured population, 4 and reports diabetes technology data including HCLSs. In addition, this study presents race/ethnicity-based outcomes controlled for socioeconomic confounders, which are closely tied to but do not account for race/ethnicity-based differences in outcomes.
Limitations of the study include the selection bias of the T1DX-QI centers (primarily academic institutions located mainly on eastern and western U.S. regions that agreed to participate in a national network), which affects the generalizability of the study. In addition, these data do not include primary care centers. These data do not include primary care or nonacademic diabetes centers. Future studies should include a broader network of diabetes centers. Finally, this observational study cannot demonstrate causality due to the risk of confounding from unmeasured and uncontrolled factors, including additional factors that explain racial/ethnic disparities. 44,45
Conclusion
This observational study demonstrates significant improvement in HbA1c from 2016–2017 to 2021–2022 and increases in diabetes technology use across age groups for PwT1D cared for at U.S. diabetes centers participating in the T1D Exchange Quality Improvement Collaborative. The presented data show opportunities to improve outcomes by race/ethnicity, insurance type, and age. Additional research will be needed to determine causality, identify contributing factors, and evaluate efficacious strategies to close health equity gaps in T1D outcomes.
Footnotes
Acknowledgments
We thank the Leona M. and Harry B. Helmsley Charitable Trust for supporting and funding the T1DX-QI. We also appreciate all members of the T1DX-QI, including principal investigators, QI coordinators, IT analysts, patients, and parents, who have all contributed to the success of the collaborative.
Authors' Contributions
O.E. developed the concept and the outline. O.E. and A.M. wrote the first draft of the article and S.R. analyzed the data. All authors critically edited and approved the final version of the article. O.E. is the guarantor of the data in this publication.
Author Disclosure Statement
O.E. is the PI for research projects funded through his institution by Dexcom, Eli Lilly, and Medtronic. O.E. is a member of the Medtronic Diabetes Health Inequity Advisory Board. R.S.W. participates in clinical trials, through her institution, sponsored by Insulet, Medtronic, Eli Lilly, Novo Nordisk, Boehringer Ingelheim, and Tandem, and uses Dexcom CGMs in clinical research studies. Other authors report no disclosures.
Funding Information
We thank the Loena M and Harry B Helmsley Charitable Trust for funding the T1D Exchange QI Collaborative.
Supplementary Material
Supplementary Figure S1
Supplementary Figure S2
Supplementary Figure S3
Supplementary Table S1
References
Supplementary Material
Please find the following supplemental material available below.
For Open Access articles published under a Creative Commons License, all supplemental material carries the same license as the article it is associated with.
For non-Open Access articles published, all supplemental material carries a non-exclusive license, and permission requests for re-use of supplemental material or any part of supplemental material shall be sent directly to the copyright owner as specified in the copyright notice associated with the article.