
Abstract
Insulin exposure varies over 3 days of insulin infusion set (IIS) wear making day-to-day insulin dosing challenging for people with diabetes (PWD). Here we report insulin pharmacodynamic (PD) and pharmacokinetic (PK) data extending these observations to 7 days of IIS wear. PWD (A1C ≤8.5%, C-peptide <0.6 nmol/L, ≥6 months pump use) were enrolled in a crossover euglycemic clamp pilot study comparing conventional Teflon angled IISs with an investigational extended-wear IIS. PK/PD data from six participants were obtained for 5 h postbolus. Although PD data were unstable, PK profiles (pooled data from both groups) of insulin lispro (0.15 U/kg bolus) showed statistically significant progressive decreases from days 0 to 7 for t
max (P < 0.001), C
max (P < 0.05), and mean residence time (P < 0.0001). Area under the insulin concentration curve (AUC0–300) declined by ∼24% from days 0 to 7 (P < 0.05). These results confirm/extend previous observations showing progressive acceleration of insulin exposure over IIS wear time. This may have implications for PWD and designers of closed-loop algorithms, although larger studies are necessary to confirm this. The study was registered in
Background
The variability of subcutaneously (SC) administered insulin absorption, even within the same person and the same insulin infusion set (IIS), presents a significant challenge for insulin pump users. 1 –4 Little data are available on the change in insulin pharmacokinetics (PK) and pharmacodynamics (PD) beyond 3 days of IIS wear. Available data have shown acceleration of insulin absorption over time. 5,6
In this study, we present PK/PD data generated from a proof-of-concept clamp study showing a very consistent change from immediately after insertion up to a full 7 days of IIS wear. We compared a commercially available angled 3-day Teflon IIS with an extended-wear IIS prototype and hypothesized that the area under the glucose infusion rate curve [AUC(GIR)]—and, therefore, the glucose lowering effect of insulin—would remain stable over 7 days of wear using the novel IIS.
Methods
The Capillary Biomedical, Inc. investigational extended-wear (CBX) IIS is a sterile single-use device for continuous SC insulin infusion. It contains a coil-reinforced soft polymer (Nylon-derivative) indwelling cannula with one distal and three proximal holes. CBX IISs are designed to be used with commercially available infusion pumps for an extended period (i.e., 7 days).
We performed a prospectively enrolled randomized sequence two-way crossover study of the investigational CBX (Capillary Biomedical, Inc., Irvine, CA) and a commercial angled Teflon (MiniMed™ Silhouette™; Medtronic Diabetes Care, Northridge, CA; indicated for 3-day use) IIS for two weeklong home use periods with four in-patient euglycemic clamp sessions during each of the 7-day periods. Between the two periods, there was a wash out of 14 days (Supplementary Fig. S1).
WCG IRB approved the protocol and all associated documents used by participants before initiation of the study (Study No. 1283383) and during the study were registered in
Euglycemic clamp experiments were performed at AMCR Institute (in Escondido, CA.) on days 0, 3, 5, and 7 in each treatment period (eight clamps per participant). Participants were admitted to AMCR the evening before the clamp study and glucose was stabilized overnight with intravenous (IV) insulin or glucose as needed. Personal pumps were set to 0.1 U/h overnight and throughout the clamp experiment. Once glucose was stable (95 ± 15 mg/dL) in the morning, IV insulin was stopped 20 min before administering a bolus of 0.15 U/kg of insulin lispro (Eli Lilly, Indianapolis, IN) by pump. Glucose was clamped at 95 ± 15 mg/dL for 300 min or terminated early if runaway hyperglycemia occurred.
Per participant and clamp, 30 plasma samples were collected in regular intervals and stored at −70°C. Samples were analyzed elsewhere (Northern Lights Mercodia Lispro ELISA, Mercodia AB, Uppsala, Sweden; lowest limit of quantification (LLOQ) = 1.0 mU/L, 94% accuracy 7 ). Owing to the small sample size and the intrinsically greater variability in pharmacodynamic measures, the PK results are the only results detailed in this report.
PK parameters (area under the insulin concentration curve [AUC] over the first 60 or 300 min, respectively; time to maximum insulin concentration [t max]; maximum insulin concentration [C max]; time to half-maximum insulin concentration, early and late [t 50%], and mean residence time [MRT]) were tested for treatment effects. Parameters were log transformed as data distribution was found to be skewed. Estimated means were then back transformed and the ratio between treatments/days (equality means a ratio of 1) tested for significance using mixed model for repeated measures (two-sided, α = 0.05). For simplicity reasons, all data are presented as median (25th–75th percentiles) or mean ± standard deviation.
Results
An initial sample size calculation determined n = 24 to generate 90% power for a comparison of changes in glucose infusion rate (GIR) over time. The study was terminated early due to difficulties executing clamp procedure as planned. Specifically, the lag time between manual glucose testing and subsequent GIR adjustment proved more difficult than anticipated. Of 19 screened participants, 12 participants failed screening and 7 participants (average [ ± SD] age 40.2 ± 9.2 years, diabetes duration 23.5 ± 16.7 years, and body mass index 27.6 ± 16.7 kg/m2, two females) were enrolled. During Control IIS use, 5 participants completed 4 clamps, and 1 participant completed 3 clamps of which 2 clamps were used for analysis (22 total).
One participant completed 1 clamp in the Control group but none in the CBX group and this data set was excluded from the analysis. In the CBX group, 5 participants completed 4 clamps, and 1 participant completed 3 clamps (23 total). Ultimately, data from 6 participants (per-protocol population) and 45 clamp procedures were used for the analysis. Multiple comparisons of PD parameters between days were not done due to unstable baseline glucose (Supplementary Fig. S2), making it difficult to execute clamp procedures efficiently (GIR curves shown in Supplementary Fig. S3) and resulting in nonrobust PD data (Table 1).
Median Key Pharmacokinetic and Pharmacodynamic Parameters with Interquartile Range
The ratios of estimated means were compared between day 0 (day of insertion, n = 6) and day 7 (day of removal, n = 5) using Mixed Models for Repeated Measures for statistical significance testing. For simplicity, the medians and 25th to 75th percentile are presented here. There was no statistically significant difference between pharmacokinetic parameters of each group (CBX vs. Control on days 0 and 7, respectively). The last column shows statistical comparison of day 7 and day of insertion pooling the data from both IIS types.
AUC0–t , area under the insulin concentration curve from 0 min until specified time point; C max, maximum insulin concentration; CBX, CapBio Extended, Wear; GIRmax, maximum glucose infusion rate; IIS, insulin infusion set; MRT, mean residence time; PP, per-protocol; t max, time to maximum insulin concentration; t 50% (early), time to reach 50% of C max before peak; t 50% (late), time to reach 50% of C max after peak; t max(GIR), time to reach GIRmax; t 50% (GIR, early), time to reach 50% GIRmax before peak; t 50% (GIR, late), time to reach 50% GIRmax after peak; AUC0–300(GIR), area under the GIR curve from 0 to 300 min.
Mean (±SD) time in tight glucose range (80–110 mg/dL) during clamp procedures was 85% ± 9% on day 0, 77% ± 15% on day 3, 80% ± 15% on day 5, and 70% ± 20% on day 7 averaged over all executed clamps. Average daily insulin dose and sensor glucose are shown in Supplementary Figure S4.
We found statistically significant changes in PK parameters between day of IIS insertion (day 0) and day 7 of wear in each group (Fig. 1, Table 1, and Supplementary Fig. S5). However, there were no meaningful differences between IIS types for any of the parameters and data were pooled to highlight the significant changes in PK parameters over 7 days of IIS wear (last column in Table 1). By day 7, median time to peak insulin concentration (t max) was accelerated by 61% (from 65.0 to 25.0 min) in the CBX group (P ≤ 0.001) and by 63% (from 67.5 to 25.0 min) in the Control group (P = 0.001), and median early exposure (AUC0–60) increased by 59% (CBX, P = 0.05) and 34% (Control, P = 0.07), respectively.
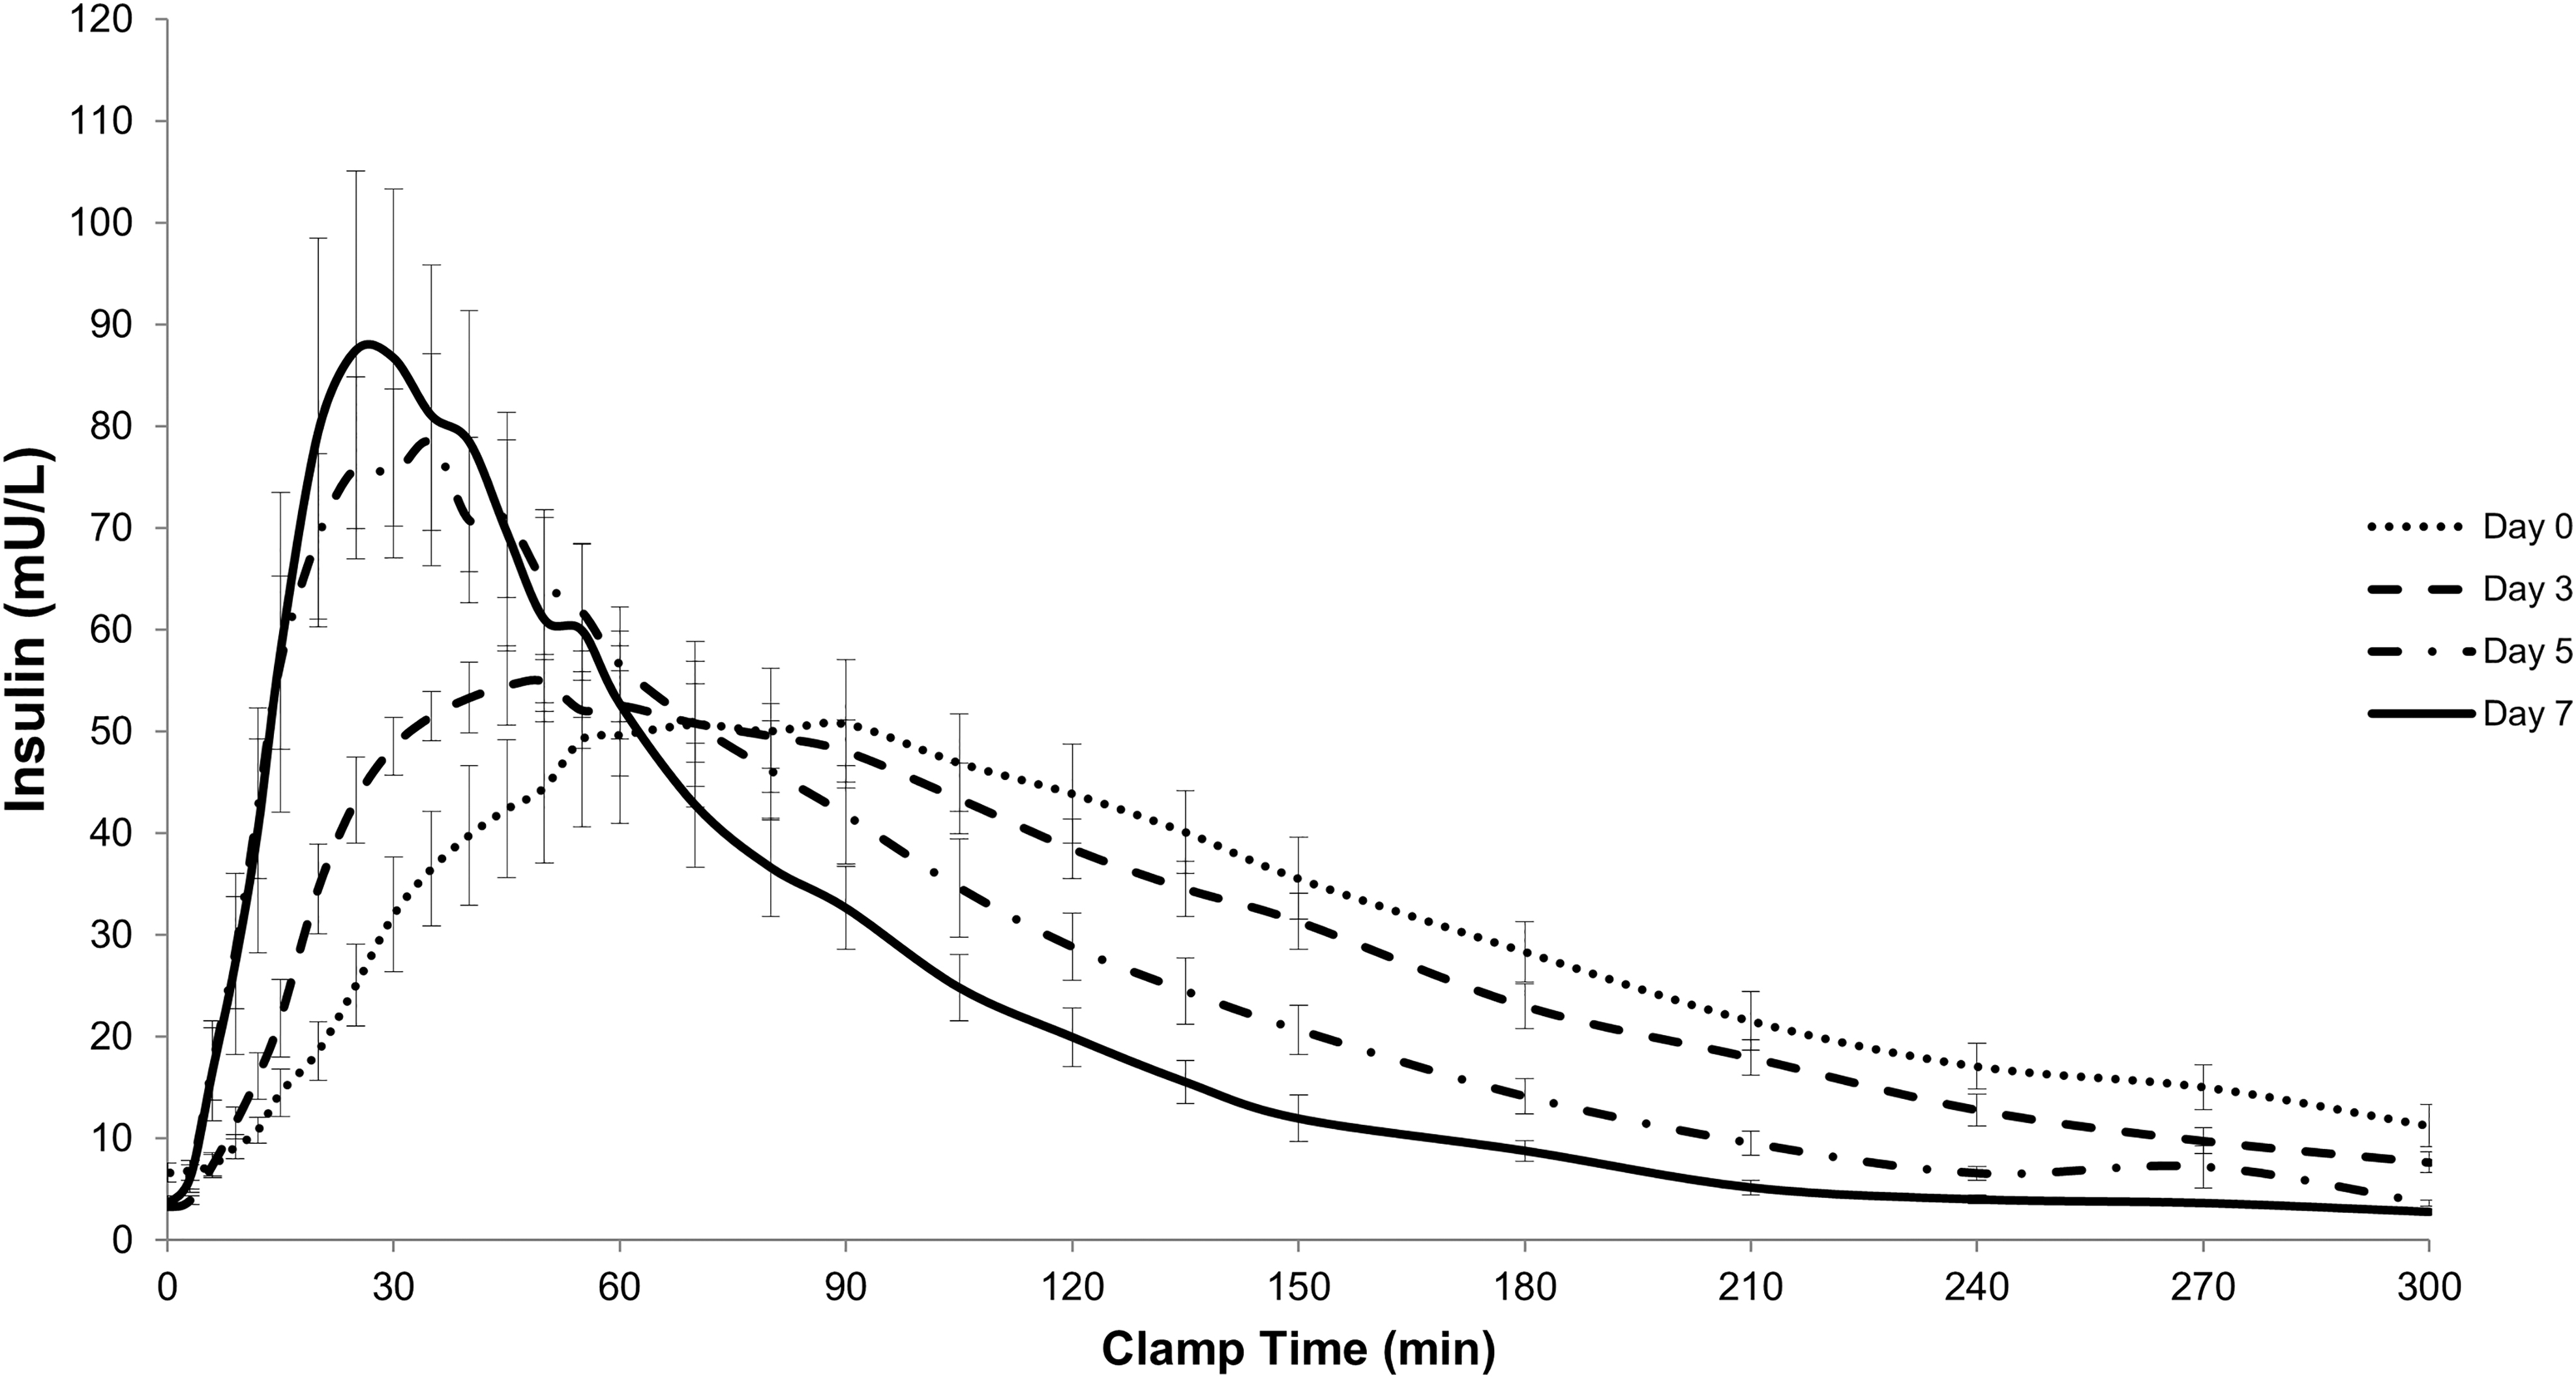
Insulin exposure over clamp time for combined data set (investigational CBX and Control infusion sets). Curves show average insulin concentration with Standard Error of the Mean. CBX, CapBio extended-wear.
Median MRT decreased over time by 42% in the CBX and 37% in the Control group, indicating significantly shorter insulin exposure by day 7 in both groups (both P < 0.0001). Median total insulin exposure (AUC0–300) showed a trend to decline by 22% (CBX, n.s.) and 26% (Control, n.s.), respectively, from days 0 to 7; when both infusion sets were analyzed together, this decline over 7 days was significant (P = 0.023). Peak insulin concentration (C max) increased by 36% in both groups over 1 week of IIS wear (n.s. individually but significant when combined, P = 0.049).
No severe or serious adverse events occurred during the study. A summary of all reported device-related events is given in Supplementary Table S1.
Conclusions
Insulin absorption (PK) is known to show intrapatient variability on each of 3 days of IIS wear during insulin pump therapy. 1,4,6 In this study, we extended PK observations to 7 days of IIS wear performing 4 euglycemic clamp experiments on days 0, 3, 5, and 7 of IIS wear after SC insulin bolus administration. Despite a small sample size, the PK data are robust, and showed a consistent and statistically significant progressive change in insulin bolus time–exposure profile parameters over 7 days of IIS wear. Owing to difficulties executing the clamp procedure and variable baseline glucose profiles, the PD data presented herein were not robust enough for extensive intra- and inter-IIS type statistical comparison.
We observed a reduction in overall insulin AUC during the 5 h postbolus but insulin absorption in the first hour significantly increased and accelerated as a function of IIS wear time. Insulin absorption from the tissue into the vasculature and lymphatics is influenced by various factors including SC blood flow, age of infusion site, location, and acute and ongoing inflammation. 1,6,8 –11 In the controlled in-patient setting in this study, marked differences in insulin exposure were observed over IIS wear time.
Interestingly, we found no difference in insulin PK/PD between the two IIS types. Although one IIS was designed for extended wear, we assume that the main factor for the ability to extend infusion set wear is the individual user and/or the permission to wear a 3-day IIS beyond its indication. This remains a topic to be further investigated.
Our PK findings confirm and extend previous observations of acceleration of insulin exposure in both humans and swine as infusion set wear time increases. 5,6,10 Currently, more research is being conducted to develop extended-wear IISs to decrease patient burden caused by frequent site rotation, loss of infusion sites due to scarring, and increased cost. 5,12 –15 As insulin requirements change with extended IIS wear, information on the change in insulin PK is crucial to develop an optimal system for users.
It may be of importance to combine extended-wear IISs with automated insulin delivery (AID, artificial pancreas) to assist people with diabetes (PWD) with changes in bolus insulin dose and timing to maintain optimum glucose control. We have previously shown that conservative manual insulin dosing can lead to deteriorating glucose control and decreased time in range when using an IIS for longer than 3 days. 12
In conclusion, this study confirms previous findings of significant changes in insulin absorption that we believe should be taken into consideration by PWD using IIS, those who care for them, and designers of AID systems.
Footnotes
Acknowledgments
The authors thank all study participants and the AMCR staff, including Jenine Yager-Stone NP, Kirsten Olsen RN, Luz Mejia CCRC, Cecelia Echon RN, Andrew Eskeland, and Susan Albrecht.
Authors' Contributions
J.R.K. contributed to study conceptualization, drafted the protocol, oversaw data analysis, and drafted the article. T.S.B. contributed to study and protocol conceptualization, oversaw recruitment and experimental procedures, and critically revised the article. P.S. and L.S. drafted the statistical analysis plan, carried out statistical data analysis, and critically revised the article. K.A.O. contributed to study and protocol conceptualization and critically revised the article. P.J.S. contributed to study conceptualization and critically revised the article. J.I.J. conceptualized the study, drafted the protocol, advised the study team, and critically revised the article. D.B.M. contributed to study conceptualization, acted as medical monitor, oversaw data analysis, helped draft the article, and is the guarantor of this study.
Author Disclosure Statement
J.R.K. is a consultant to Capillary Biomedical and received stock options as well as funding from Capillary Biomedical as a postdoctoral fellow while planning this study. T.S.B. is a consultant to Capillary Biomedical and receives stock options. P.S. is an equity owner of Capillary Biomedical. KAO is an equity owner and employee of Capillary Biomedical. P.J.S. is a founder, equity owner, and employee of Capillary Biomedical. J.I.J. is a founder, equity owner, and consultant to Capillary Biomedical and has received research support. D.B.M. is a consultant to Capillary Biomedical and an equity owner. L.S. has no competing interests.
Funding Information
Funding for this study was by NIDDK award 2R44DK110969-02.
Supplementary Material
Supplementary Figure S1
Supplementary Figure S2
Supplementary Figure S3
Supplementary Figure S4
Supplementary Figure S5
Supplementary Table S1
References
Supplementary Material
Please find the following supplemental material available below.
For Open Access articles published under a Creative Commons License, all supplemental material carries the same license as the article it is associated with.
For non-Open Access articles published, all supplemental material carries a non-exclusive license, and permission requests for re-use of supplemental material or any part of supplemental material shall be sent directly to the copyright owner as specified in the copyright notice associated with the article.