
Abstract
Objective:
We assessed the economic impact of using the newest flash continuous glucose monitoring (CGM) among Medicaid beneficiaries with diabetes treated with intensive insulin therapy (IIT).
Research Design and Methods:
A budget impact analysis was created to assess the impact of increasing the proportion of Medicaid beneficiaries with diabetes on IIT, who use flash CGM by 10%. The analysis included glucose monitoring device costs, cost savings due to reductions in glycated hemoglobin, severe hypoglycemia events, and hyperglycemic emergencies such as diabetic ketoacidosis. The net change in costs per person to adopt flash CGM for three populations treated with IIT (adults with type 1 diabetes [T1D] or type 2 diabetes [T2D], and children and adolescents with T1D or T2D) was calculated; these costs were used to estimate the impact of increasing flash CGM use by 10% to the U.S. Medicaid budget over 1–3 years.
Results:
The analysis found that flash CGM demonstrated cost savings in all populations on a per patient basis. Increasing use of flash CGM by 10% was associated with a $19.4 million overall decrease in costs over the year and continued to reduce costs by $25.3 million in years 2 and 3.
Conclusions:
Our results suggest that the new flash CGM system can offer cost savings compared to blood glucose monitoring in Medicaid beneficiaries treated with IIT, especially T1D adults, and children and adolescents. These findings support expanding access to CGM by Medicaid plans.
Introduction
Medicaid is a public insurance program that provides health care coverage to low-income families and individuals. Administered by the Centers for Medicare and Medicaid Services (CMS), the program is jointly funded by the federal government and the states, with each state operating its own Medicaid program within federal guidelines.
According to 2020 data from CMS, 73,469,597 adults and 6,681,177 children and adolescents were enrolled in the Medicare and Children's Health Insurance Program (CHIP). 1 Within the Medicaid/CHIP population, 7,373,871 people carry a diagnosis of diabetes: 400,754 adults with type 1 diabetes (T1D), 2 6,812,815 adults with type 2 diabetes (T2D), 2 and 176,331 children and adolescents with T1D (n = 160,302) 3 or T2D (n = 16,029). 3 An estimated 93% of the T1D 4 and 11% of the T2D 5 beneficiaries are treated with intensive insulin therapy (IIT), either multiple daily insulin injections or insulin pump.
Although current clinical guidelines recommend glycated hemoglobin (HbA1c) levels of <7.0% as the measure of glycemic control for children and adolescents and most adults with diabetes, 6 the median percentage of Medicaid/CHIP beneficiaries with HbA1c levels >9.0% within the 29 states that report this measure is estimated to be 38.8%. 7 This is considerably higher than the national average of 15.5%, 8 who have HbA1c levels >9.0%, and most concerning given the severe consequences of poorly controlled diabetes.
As demonstrated in large clinical studies, persistent elevation of HbA1c levels is associated with the acute complications of diabetes, including severe hypoglycemia events (SHEs) and diabetic ketoacidosis (DKA), 9 –11 as well as chronic microvascular and macrovascular disease. 12 –15 While the chronic complications of diabetes develop over time, SHE and DKA occur rapidly and can lead to severe morbidities and mortality if not treated immediately. 16,17
Because each state differs in their reporting, it is difficult to accurately assess the total diabetes-related costs among Medicaid beneficiaries. Data from a 2018 report showed higher DKA hospitalization rates over time for Medicaid beneficiaries compared with privately insured individuals. 18 Analyses of the 2012 Medicaid claims data 19 and MarketScan multistate Medicaid database 20 also report significantly higher costs for adults and children and adolescents with diabetes (with and without a disability) compared with those without diabetes.
In a recent report by Ng et al., the diabetes-related cost was significantly higher among adults with diabetes and no disability compared with no diabetes or disability ($9,530 vs. $4,545, P < 0.001). 19 Similar findings were reported by Shrestha et al., who found even greater cost disparities between children and adolescents with diabetes and those with no diabetes ($24,093 vs. $14,149, P < 0.001). 20
These disparities are likely related to differences in access to care between individuals living in low-income versus high-income communities. 21 A recent study by Nguyen et al. reported that individuals living in low-income urban and rural areas were more likely to have fewer primary care physicians in their communities (0.5% and 7.4%, respectively) than those living in high-income areas. 22
Moreover, Medicaid beneficiaries have greater difficulty accessing specialists, such as endocrinologists, than those with private insurance. 21 This is significant because many primary care physicians are challenged to provide adequate diabetes care to individuals treated with IIT and often delay intensifying insulin therapy due to the complexity of these regimens. 23
Safe use of IIT regimens requires patients to perform frequent blood glucose testing throughout the day to calculate their insulin dosages and monitor their glucose levels to detect hypoglycemia and hyperglycemia. Currently, patients have two options for testing: blood glucose monitoring (BGM) with a meter and test strips and continuous glucose monitoring (CGM).
Although use of BGM remains the most common method for glucose testing, this approach is not effective in detecting asymptomatic hypoglycemia unless the individual is willing to test many times daily. Because many individuals find this both inconvenient and painful, adherence to prescribed testing regimens is poor. One study found that 61.9% of participants reported that they did not use BGM at home, 24 whereas CGM measures glucose continuously and provides information to the patient about their current glucose level, glucose trend, and information about the direction and velocity of changing glucose by rate-of-change arrows. 25 –27 Importantly, CGM devices alert patients when glucose levels are crossing above or below safe glucose thresholds. This allows patients to take immediate action to mitigate current or impending hypoglycemia and hyperglycemia.
Numerous clinical trials and real-world studies have shown that use of flash CGM systems (FreeStyle Libre, FreeStyle Libre 14-Day, Abbott Diabetes Care, Alameda, CA) in T1D and T2D treated with IIT improves glycemic outcomes 28 –33 with reductions in hypoglycemia, 32 –37 improved treatment satisfaction, 33,38 less hypoglycemia fear, 32,38,39 improvements in other health-related measures, 28,30,31,33,38 and decreased rates of diabetes-related events requiring hospitalization and/or emergency department (ED) services. 31,33
Given that the hospitalization costs to Medicaid for SHE and DKA average $406840 and $9733, 41,42 respectively, it was expected that reductions in these severe events would result in cost savings. Commercial plans pay even higher costs for SHE and DKA. Still, many Medicaid plans have remained hesitant to provide coverage for CGM technologies, despite rapid adoption by patients and commercial payers. As cost may be a concern, we assessed the economic impact of increasing adoption of the FreeStyle Libre® 2 flash glucose monitoring system, the newest flash CGM, by Medicaid members with diabetes treated with IIT over 1–3 years. This new flash CGM has real-time, optional alarms that can warn the user about low or high glucose levels when turned on. As the evidence supporting flash CGM was with prior versions of the FreeStyle Libre systems, this analysis assumes the alarms have been turned off.
Methods
This budget impact analysis was created using a hypothetical population covered under a Medicaid insurance plan. The results are presented as a net cost difference per person relative to the flash CGM compared with BGM. The analysis reports total costs for a current and alternative scenario, as well as the annual net budget reduction and cost per member per year (PMPY) over 3 years. A 3-year time horizon was applied to report difference in costs in the first year of flash CGM system use, which includes setup costs. Costs associated with flash CGM system are slightly lower in two subsequent years where no further setup costs are required. Costs were reported from a Medicaid payer perspective, considering the total U.S. Medicaid population of adult and pediatric persons with diabetes treated with IIT. 1
A Microsoft Excel®-based cost calculator was constructed to estimate the budget impact of increasing utilization by 10% of flash CGM to Medicaid adult beneficiaries with T1D or T2D and pediatric beneficiaries (4 to 18 years of age), treated with IIT. The cost calculator compared the flash CGM with BGM for managing T1D and T2D adults and children and adolescents.
The prevalence of diabetes in the general population and prevalence by insulin delivery modality were used to estimate the size of the adult population. 2 –5 The pediatric population was calculated using prevalence, assuming that all children and adolescents between 4 and 18 years of age treated with IIT may be eligible for the flash CGM.
Clinical inputs.
Diabetes prevalence and all clinical inputs are presented in Table 1. Hospital costs due to SHEs were calculated using a baseline rate for BGM and adjusting this for a treatment effect with CGM use. Baseline rates for SHE in the T1D and T2D adult populations and pediatric population using IIT were sourced from a U.S. real-world study in a commercial T1D population 43 and a real-world study in U.S. pediatric patients, 44 respectively. These rates were adjusted to apply a wider definition of SHE 45 and reflect a Medicaid population. 18 Details of the adjustments applied to calculate baseline risk are described in Supplementary Table S1. Hospital costs were calculated applying the proportions for treating SHEs in T1D and T2D 45 based on a large phase 3 clinical program. 45
Diabetes Prevalence and Clinical Inputs
Li et al. (2012) 5 reported that 22% of the U.S. T2DM population are insulin users. An unpublished Gfk-Roper report, reports 11% of the T2 DMI population are IIT.
Adjusted assuming a 2.4285 times increased risk of event in Medicaid population compared with commercially insured population and applying distribution reported in Heller et al. 45 Refer to supplement for further details of adjustment calculation.
Treatment effect on ADE used as proxy for treatment effect on SHE. Refer to supplement for further details of adjustment calculation.
Adjusted assuming a 2.4285 times increased risk of event in Medicaid population compared with commercially insured population and adjusted assuming a ratio of 0.619 between DKA hospital events for T1 and T2, sourced from MarketScan database. Refer to supplement for further details of adjustment calculation.
DKA or HHS, ER; IIT multiple daily injections or continuous subcutaneous insulin infusion.
ADE, acute diabetes-related events; CGM, continuous glucose monitoring; CHIP, Children's Health Insurance Program; DKA, diabetic ketoacidosis; ER, emergency room; IIT, intensive insulin therapy; PPPY, per patient per year; SHE, severe hypoglycemic event; T1D, type 1 diabetes; T2D, type 2 diabetes.
The rate ratios for reduction in SHE with the flash CGM system use were obtained from U.S. real-world studies, before and after using flash CGM for T1D 46 and T2D, 47 respectively, using reduction in acute diabetes-related events (ADE) as a proxy for reduction in SHE events. The treatment effect in the pediatric population was assumed to be the same as for the T1D adult population. The clinical inputs are reported in Table 1.
Hospital admissions for DKA and hyperosmolar hyperglycemia syndrome events were calculated using a similar approach to SHE hospital costs. For simplicity, these hyperglycemic emergencies were labeled as DKA. Similar to the baseline rate for SHE, the baseline rate of DKA admission in the T1D population was obtained from Pettus et al. 43 and adjusted for a Medicaid population. 18 To reflect risk in a T2D population, a query of a large payer administrative claims database, IBM Watson MarketScan, was performed using the dates Q4 2017 – Q2 2019. Rates for hospitalizations for hyperglycemia in T1D (ICD-9 250.x1, 250.x3; ICD-10 E10) and T2D (ICD-9 250.x0, 250.x2; ICD-10 E11.xx) on rapid- or short-acting insulin were calculated. The ICD-10 codes used to identify the hyperglycemic complications are listed in Supplementary Table S2.
Details of the adjustments applied are reported in Supplementary Table S1. The rate ratios for reduction in DKA events with the flash CGM system use were obtained from the French real-world studies, 48 before and after starting use of flash CGM. The baseline rate of DKA and treatment effect in the T1D population were assumed to be the same in the pediatric population (Table 1).
Baseline rates of HbA1c and treatment effect with the flash CGM system in adult T1D populations were sourced from a meta-analysis. 49 Baseline rates of HbA1c and treatment effect with the flash CGM system in adult T2D populations were sourced from Kröger et al., 29 a retrospective review of medical records in 18 European centers in T2D patients before and after starting flash CGM. The baseline rate and treatment effect in the pediatric population were sourced from a randomized trial of 153 individuals 14 to 24 years of age with T1D 50 (Table 1).
Cost inputs
The costs considered in the calculator include glucose monitoring costs, physician setup and follow-up costs, hospital costs for SHE, hospital costs for admission with DKA, and health care costs avoided for HbA1c reduction. Costs associated with BGM include test strips ($0.14/strip) and lancets ($0.07/lancet) at a usage rate of 5.6/day for T1D beneficiaries, 51 3.8/day for T2D beneficiaries, 36 and 7.3/day for pediatric beneficiaries. 52
Costs associated with the flash CGM system cover the reader unit ($70.00), which has a 3-year lifetime, 14-day sensor ($54.43 Wholesale Acquisition Cost), and cost of BGM as needed (test strips and lancets). The anticipated costs of BGM use in conjunction with the flash CGM associated include test strips and lancets at a usage rate of 0.5/day for T1D beneficiaries, 51 0.3/day for T2D beneficiaries, 36 and 0.5/day for pediatric beneficiaries. 52
Because these usage rates are based on clinical trials that assessed the first-generation flash CGM, we anticipate a lower usage rate due to the functionality of the optional alarms that integrated into the flash CGM system. Unit costs were sourced from 2020 price lists or inflated to 2020 prices using the consumer price index for medical care published by the Health Resources and Services Administration. 53 Unit costs and resource use assumptions are provided in Supplementary Table S3.
The 3-year costs for physician visits include the setup cost ($55.58 54 ), a one-time expense, and clinic visits ($518.63 55 per visit) at an assumed rate of four visits per year. Setup costs only apply to the flash CGM system (not BGM) and are only applied in the first year of treatment. All other costs are assumed to be the same in year 1 and subsequent years. All costs are adjusted to 2020 prices.
The health care utilization costs for SHE include ambulance service ($571.00), 56 ED service ($2,000.05), 57 and hospital admission ($4,068.00). 40 The cost per DKA event is $9,733.00. 41 The annual cost savings per 1.0% HbA1c reduction is $804.67. 58 All costs are inflated to 2020 prices.
Penetration projections
The penetration projections were hypothetical. The current scenario analyzed the costs assuming 23% flash CGM penetration, although this estimate was not based on market share data. The alternative scenario assumed a 10% absolute increase in flash CGM penetration. Costs for one cohort were calculated over 2 and 3 years, keeping market distribution constant to show that costs with flash CGM are higher in year 1 due to setup costs and decrease in subsequent years (year 2 onward) because no further setup costs are incurred.
One-way sensitivity analysis
One-way, deterministic sensitivity analysis (DSA) was performed on the primary inputs, varying each individually within an upper and lower bound of 20% in either direction.
Results
Base case analysis
Table 2 presents a summary of the difference in cost per patient per year (PPPY) treated with the flash CGM system relative to BGM in the T1D, T2D, and pediatric populations in year 1. In the T1D population, the annual acquisition costs are estimated to be $1052 PPPY higher with the flash CGM system compared to BGM. When health care resource costs (SHE and DKA) and cost off-sets from improved HbA1c are considered, the flash CGM system results in lower costs and the net difference is estimated to be $327 PPPY.
Difference in Cost Per Patient Per Year Treated with the Flash Continuous Glucose Monitoring System Relative to Blood Glucose Monitoring in the Type 1 Diabetes, Type 2 Diabetes, and Pediatric Populations in Year 1
Note due to rounding (e.g., $518.63 × 4 was rounded up to $2075 vs. $2074.52) some numbers may not add up as presented.
BGM, blood glucose monitoring; SHE, severe hypoglycemia event.
Similarly, in the T2D population, the annual acquisition costs are estimated to be $1175 PPPY higher with the flash CGM system compared to BGM. When health care resource costs, physician costs, and cost savings from improved HbA1c are considered, flash CGM is cost saving, resulting in cost decrease of $101 PPPY. In the pediatric population, the annual acquisition costs are estimated to be $922 PPPY higher with the flash CGM system compared to BGM. When cost offsets are considered, the cost savings with the flash CGM system are $323 PPPY. Table 2 presents the annual per patient cost, comparing the flash CGM system with BGM in the T1D, T2D, and pediatric populations.
Impact to budget
The base case simulated the budget impact for the total U.S. Medicaid population (plan size 73.5 million adults and 6.7 million children and adolescents) using the default values described in Table 1, which projected the plan would cover 367,348 T1D IIT users, 686,941 T2D IIT users, and 14,231 children and adolescents. These populations were assumed to be static over time. The market share assumptions assume that flash CGM system uptake would increase from 23% to 33% in all three populations with the rest assumed to use routine BGM.
The total costs for glucose monitoring, DKA, hypoglycemia, elevated HbA1c, and the provider visits described in the methods for the whole population over 1 year were $4131 million in the current scenario and $4112 million in the alternative scenario of increased utilization of the flash CGM system. Increasing the proportion treated with the flash CGM system was estimated to result in annual savings of $19.4 million in year 1. The cost savings increase to $25.3 million in years 2 and 3 on treatment because no further setup costs with the flash CGM system are required. The results of the budget impact analysis are illustrated in Figure 1. The net budget reduction was estimated to be $0.24 PMPY in year 1 and the reduction increases to $0.32 PMPY in subsequent years.
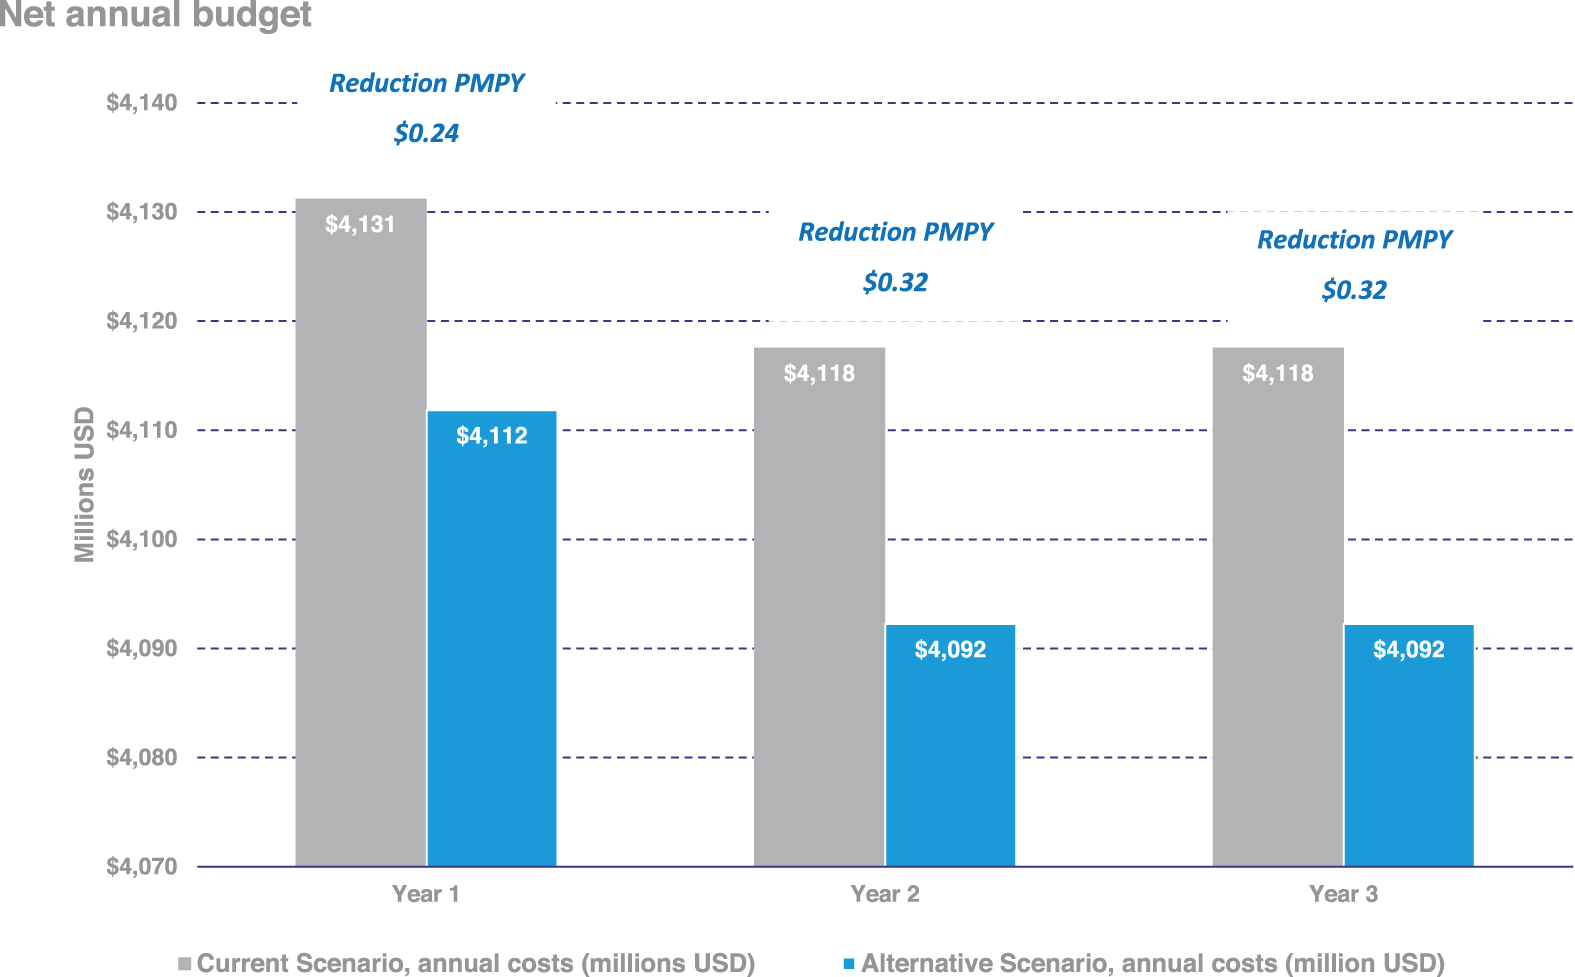
Net annual budget reduction when flash CGM market uptake is increased. Costs include glucose monitoring, hypoglycemia, DKA, elevated HbA1c, and the provider visits described Methods. The cost reductions amount to $0.27 in year 1 and $0.35 in years 2 and 3 on a PMPY basis. CGM, continuous glucose monitoring; DKA, diabetic ketoacidosis; PMPY, per member per year; HbA1c, glycated hemoglobin.
Impact on utilization
The current and alternative scenarios are also compared in terms of difference in the number of acute diabetes events (Table 3). The results suggest that increasing the proportion of the Medicaid population using the flash CGM system by 10% reduces the number of hospital events for SHE or DKA by 5.9% from 382,500 to 360,100.
Breakdown of Acute Diabetes Events When Flash Continuous Glucose Monitoring System Market Uptake Is Increased (1000 Events in U.S. Medicaid Population)
One-way sensitivity analysis
The results of the one-way DSA in the base-case per person analysis for T1D, T2D, and pediatrics comparing the flash CGM system with BGM are illustrated in Supplementary Figures S1–S3. Varying the following inputs had the greatest impact on the analysis in the T1 population: number of physician visits per year with the flash CGM and BGM, respectively, treatment effect with flash CGM on DKA, and the baseline incidence of DKA events. Flash CGM is more expensive when there are more physician visits than BGM per year, which is not expected. Varying any other input 20% in favor of BGM decreases the savings with flash CGM system, yet had no impact on the conclusion of cost savings associated with increased use of flash CGM.
This analysis was repeated for the T2D and pediatric populations and similar trends were observed. A small number of inputs were sensitive to a 20% variation in the T2D population because the difference in cost was closer to zero.
Discussion
Numerous clinical trials and real-world studies have shown that use of earlier generation flash CGM systems in T1D and T2D treated with IIT improves both outcomes glycemic outcomes 28 –37 improved treatment satisfaction, 33,38 enhanced quality of life, 28,30 –33,38 and lower rates of severe diabetes-related events. 31,33 Real-world studies have also shown that flash CGM increases the users' time in glucose range (TIR), 59,60 with reductions in time below range (TBR). 36,51 Both TIR (70–180 mg/dL) and TBR (<70 mg/dL and <54 mg/dL) are new CGM metrics of glycemic control endorsed by several international diabetes societies, including the American Diabetes Association, European Association for the Study of Diabetes, American Association of Clinical Endocrinologists, and International Society for Pediatric and Adolescent Diabetes. 61
Our analysis demonstrates both the clinical and economic impact of improvements in HbA1c, with reductions in SHE and DKA hospitalization rates to be expected with flash CGM use compared with BGM.
Findings from our analysis suggest that increasing use of flash CGM by Medicaid beneficiaries with diabetes treated with IIT will lead to significant cost savings. Although the glucose monitoring costs during the first year are notably higher for flash CGM compared with BGM (for example, for T1D, it is $1482 vs. $430, respectively), the overall cost difference clearly favors flash CGM use in the T1D, T2D, and pediatric populations due to the potential reductions in both ADE and HbA1c levels. These cost savings would be expected in the first year and then persist through the second and third years.
In addition to the benefits of achieving and maintaining near-normal HbA1c in preventing or delaying the progression of long-term complications, 12 –15 even short-term reductions in HbA1c levels and HbA1c variability have been shown to reduce the risk for cardiovascular events and all-cause mortality. 62 The anticipated HbA1c reduction may also lead to increased treatment satisfaction among beneficiaries, 63 which strongly correlates with enhanced medication adherence and decreased health care resource utilization. 64 –67 A recent study by Ueno et al. reported significant reductions in HbA1c and improvements in treatment satisfaction in adult T1D patients using flash CGM. 68 Moreover, use of flash CGM reduces the burden of diabetes on patients and their caregivers, 30,69 one of the intangible benefits that is not often considered.
Strengths of this analysis were the incorporation of data from actual use of flash CGM in the real world along with randomized controlled trial (RCT) data to backup other conclusions. It is known that participants in RCTs represent only a small fraction of patients who use the intervention. Another strength was the use of realistic costs for complications based on publicly available data and BGM devices. Finally, this study looked at various types of cost offsets related to hypoglycemia, hyperglycemia, and change in HbA1c.
Our analysis has notable limitations. Baseline rates for SHE and DKA were estimated using the Pettus et al. study. 43 Because these data looked at the population overall, an inflator had to be used to adjust for anticipated higher rates of complications in the Medicaid population versus the general population. This may have overestimated or underestimated the true burden for Medicaid patients. The baseline risk of DKA hospitalization, sourced from Pettus et al., 43 included both ED visits and admissions. This approach may therefore overestimate the cost of DKA admissions by applying an admission cost to ED visits and underestimate the wider costs of DKA events by excluding ambulance call outs. 48
An additional limitation was the use of a cost offset for HbA1c reduction. There is potential for some overlap between the cost savings captured from reduced risk of SHE and DKA events and cost savings from improved HbA1c because the source applied to calculate the reduction in health care costs per 1% change in HbA1c captured all health care costs, including DKA and SHE events. However, the cost attributed to a 1% change in HbA1c of $670 is conservative compared to similar economic analyses 42 that attribute cost savings ranging between $1111 70 and $2073 71 per 1% HbA1c reduction and applied in addition to cost savings due to reduced DKA and SHE events associated with CGM use.
In addition, treatment effects of flash CGM on SHE hospitalizations were estimated using studies that looked at reductions in overall acute diabetes events. 46,47 However, we believe this assumption is reasonable because the treatment effect applied is similar to the treatment effect on SHE reported in a UK real-world study in T1D populations before and after starting the flash CGM system. 72 The analysis did not include impact of flash CGM on hospitalizations for non-diabetes-related events. However, we believe the cost offset for HbA1c reduction may have captured some of this impact.
In addition, the studies incorporated into the cost calculator used prior versions of flash CGM, which did not have the optional, real-time alarm feature. As such, we potentially may see even greater improvements in clinical outcomes using the newest generation of flash CGM. This analysis also did not incorporate improvements to productivity, quality measures due to improvements associated with use of flash CGM as reported in several recent real-world studies. 28,30,31,33,38
Conclusions
Despite these limitations, this study suggests that the new flash CGM system can offer cost savings compared to BGM in Medicaid beneficiaries with T1D or T2D adults and children and adolescents treated with IIT. Although system costs are higher for flash CGM, cost offsets related to reducing health care utilization (e.g., reducing hospitalizations for hypoglycemia) can help Medicaid plans recover the higher system cost within the first year. These findings support expanding access to flash CGM by Medicaid plans.
Footnotes
Acknowledgments
The authors wish to thank Christopher G. Parkin, MS, CGParkin Communications, Inc., for medical writing support, and Gregory Roberts and Yelena Nabutovsky (both Abbott employees) for support with the MarketScan data.
Author Disclosure Statement
R.H. is a contractor and N.V. is an employee of Abbott Diabetes Care. D.B. and J.F. are consultants to Abbott.
Funding Information
Funding for the development of this article was provided by Abbott Diabetes Care.
Supplementary Material
Supplementary Table S1
Supplementary Table S2
Supplementary Table S3
Supplementary Figure S1
Supplementary Figure S2
Supplementary Figure S3
References
Supplementary Material
Please find the following supplemental material available below.
For Open Access articles published under a Creative Commons License, all supplemental material carries the same license as the article it is associated with.
For non-Open Access articles published, all supplemental material carries a non-exclusive license, and permission requests for re-use of supplemental material or any part of supplemental material shall be sent directly to the copyright owner as specified in the copyright notice associated with the article.