
Abstract
Objective:
The international SWEET registry (NCT04427189) was initiated in 2008 to improve outcomes in pediatric diabetes. A 10-year follow-up allowed studying time trends of key quality indicators in 22 centers from Europe, Australia, Canada, and India in youth with type 1 diabetes (T1D).
Methods:
Aggregated data per person with T1D <25 years of age were compared between 2008–2010 and 2016–2018. Hierarchic linear and logistic regression models were applied. Models were adjusted for gender, age-, and diabetes duration groups.
Results:
The first and second time periods included 4930 versus 13,654 persons, 51% versus 52% male, median age 11.3 [Q1; Q3: 7.9; 14.5] versus 13.3 [9.7; 16.4] years, and T1D duration 2.9 [0.8; 6.4] versus 4.2 [1.4; 7.7] years. The adjusted hemoglobin A1C (HbA1c) improved from 68 (95% confidence interval [CI]: 66–70) to 63 (60; 65) mmol/mol (P < 0.0001) or 8.4 (95% CI: 8.2–8.6) to 7.9 (7.6; 8.1) % (P < 0.0001). Across all age groups, HbA1c was significantly lower in pump and sensor users. Severe hypoglycemia declined from 3.8% (2.9; 5.0) to 2.4% (1.9; 3.1) (P < 0.0001), whereas diabetic ketoacidosis events increased significantly with injection therapy only. Body mass index-standard deviation score also showed significant improvements 0.55 (0.46; 0.64) versus 0.42 (0.33; 0.51) (P < 0.0001). Over time, the increase in pump use from 34% to 44% preceded the increase in HbA1c target achievement (<53 mmol/mol) from 21% to 34%.
Conclusions:
Twice yearly benchmarking within the SWEET registry was associated with significantly improved HbA1c on a background of increasing pump and sensor use for 10 years in young persons with T1D.
Trial Registration:
NCT04427189.
Background
Glycated hemoglobin A1
Benchmarking has a long tradition in pediatric diabetology. 4,6,7,10 The comparison of quality indicators among different centers or countries is proven to be effective in some registries. 6,7 An observational study reporting quality indicator without comparing results among centers had little or no impact. 5 Many studies have tried to explain differences among centers by comparing treatment strategies, 6,13 –15 but treatment target setting proved the most impactful. 16,17 In addition, the relationship between quality of life and glycemic control is well established. 18 However, the reasons why benchmarking is successful in some environments and not in others remain elusive, and whether changing the treatment target leads to improved glycemia remains speculative.
During the past 10 years, centers worldwide have implemented treatment with modern technology including insulin pumps and continuous glucose monitoring (CGM) in children with T1D. 19,20 Most research studies using these technologies are associated with improved glycemic control; real-life observations may not necessarily show the same. 21
The SWEET project (Better Control in Pediatric and Adolescent Diabete
The aim of this study was to analyze the selected quality indicators from the initial SWEET database over the past decade and study the impact of treatment changes.
Research Design and Methods
Data sources and subjects
This analysis was based on data from the international prospective multicenter diabetes registry SWEET. SWEET (NCT04427189) was approved by the ethical committee of Hannover Medical School and is associated with the AUF DER BULT Diabetes Center for Children and Adolescents, Hannover, Germany, which coordinates the SWEET collaboration. Each center has to meet specific entry criteria showing diabetes expertise and compliance with the ISPAD clinical practice guidelines. The local institutional review boards of the participating centers approved the pseudonymized data collection (for details please refer to the website
The SWEET database combines data from distinct sources.
10,23
Data are collected locally through clinical databases, electronic health record systems, the standardized SWEET-DPV-documentation software (
As of September 2019, the SWEET database includes 66,418 participants and 724,724 visits documented by 101 diabetes centers worldwide. The growth of SWEET has occurred since the creation of the charity and willing participation at a cost to centers. However, when this present analysis was done, the criteria for inclusion were centers with data from at least 15 individuals with documented HbA1c per center, individuals with T1D aged ≤25 years during the first time period (2008–2010) and the second time period (2016–2018). As SWEET started as an EU project, these centers came primarily from Europe (Austria, Czech Republic, Denmark, France, Germany, Greece, Hungary, Ireland, Italy, Luxembourg, Poland, Portugal, Romania, Serbia, Sweden, and Turkey) and included centers from Australia, Canada, and India. Data from eligible children and youth with T1D from participating centers were aggregated for each subject during the observation periods. A subanalysis was performed in subjects with data documented in both time periods.
Outcome variables
Glycemic control was assessed by HbA1c measured locally in each center. To adjust for differences between laboratories, the multiple of the mean method was used to standardize local HbA1c mathematically. 10 Insulin therapy was classified as pump therapy or injection therapy. Frequency of self-monitoring of blood glucose (SMBG) was recorded per day. Any use of CGM (real-time or intermittent scanning CGM) was analyzed.
To adjust for age and gender, BMI and height standard deviation score (SDS) values were calculated using the international pediatric reference data from the World Health Organization (WHO) (
Statistical analysis
Descriptive data are presented as median with quartiles or percentages. The Wilcoxon test was used to compare continuous variables and the chi-squared test was used for binary variables.
Linear and logistic regression models were applied to adjust for covariates. To account for variation among diabetes centers, each center was entered as a random intercept in the models. To adjust for multiple comparisons, Tukey–Kramer test was used. Regression models were adjusted for age, gender, and diabetes duration. Results are presented as adjusted means with 95% confidence intervals (CIs).
Curves of aggregated HbA1c values per year of age were estimated in the entire cohort across both time points using locally weighted scatter plot smoothing (LOESS). 26
In the subanalysis of individuals with data in both time periods, linear regression model for HbA1c was applied. Repeated measurements per subject were taken into account using first-order autoregressive covariance structure. Models were adjusted for gender, age groups as above (missing the youngest age group), and diabetes duration groups. Regression models were additionally adjusted for pump usage and sensor usage. A two-sided P-value <0.05 was defined as statistically significant. All analyses were performed with Statistical Analysis Software 9.4 (SAS; SAS Institute, Inc., Cary, North Carolina).
Results
A total of 22 centers from 19 countries in Asia (India), Australia, Europe (Czech Republic, Denmark, France, Germany, Greece, Hungary, Ireland, Italy, Luxembourg, Poland, Portugal, Romania, Serbia, Sweden, and Turkey), and North America (Canada) had at least 15 eligible subjects in each observation period. In this study, 16,082 children and youth with T1D from 22 centers were included. The cohort from the first observation period (2008–2010) included 4930 persons from 22 centers, 51% male, median age 11.3 years [Q1; Q3: 7.9; 14.5], and median T1D duration 2.9 years [0.8; 6.4]. The second time cohort (2016–2018) included 13,654 persons, 52% male, age 13.3 years [9.7; 16.4], and diabetes duration 4.2 years [1.4; 7.7]. A subanalysis was performed in 2502 subjects with data documented in both time periods.
Glycemic control in the entire cohort
The unadjusted mean HbA1c for the first time period was 62 [55; 72] mmol/mol or 7.8 [7.2; 8.7] % and 58 [51; 68] mmol/mol or 7.5 [6.8; 8.4] % for the second time period. LOESS curves revealed that this improvement was present in all age groups (Fig. 1). This difference remained significant when adjusted for gender, age, and T1D duration. Adjusted HbA1c for the first time period was 68 (95% CI: 64–72) mmol/mol or 8.4 (95% CI: 8.0–8.7) %, and 63 (60; 67) mmol/mol or 7.9 (7.6; 8.3) % for the second time period (P < 0.0001) (Fig. 2A).
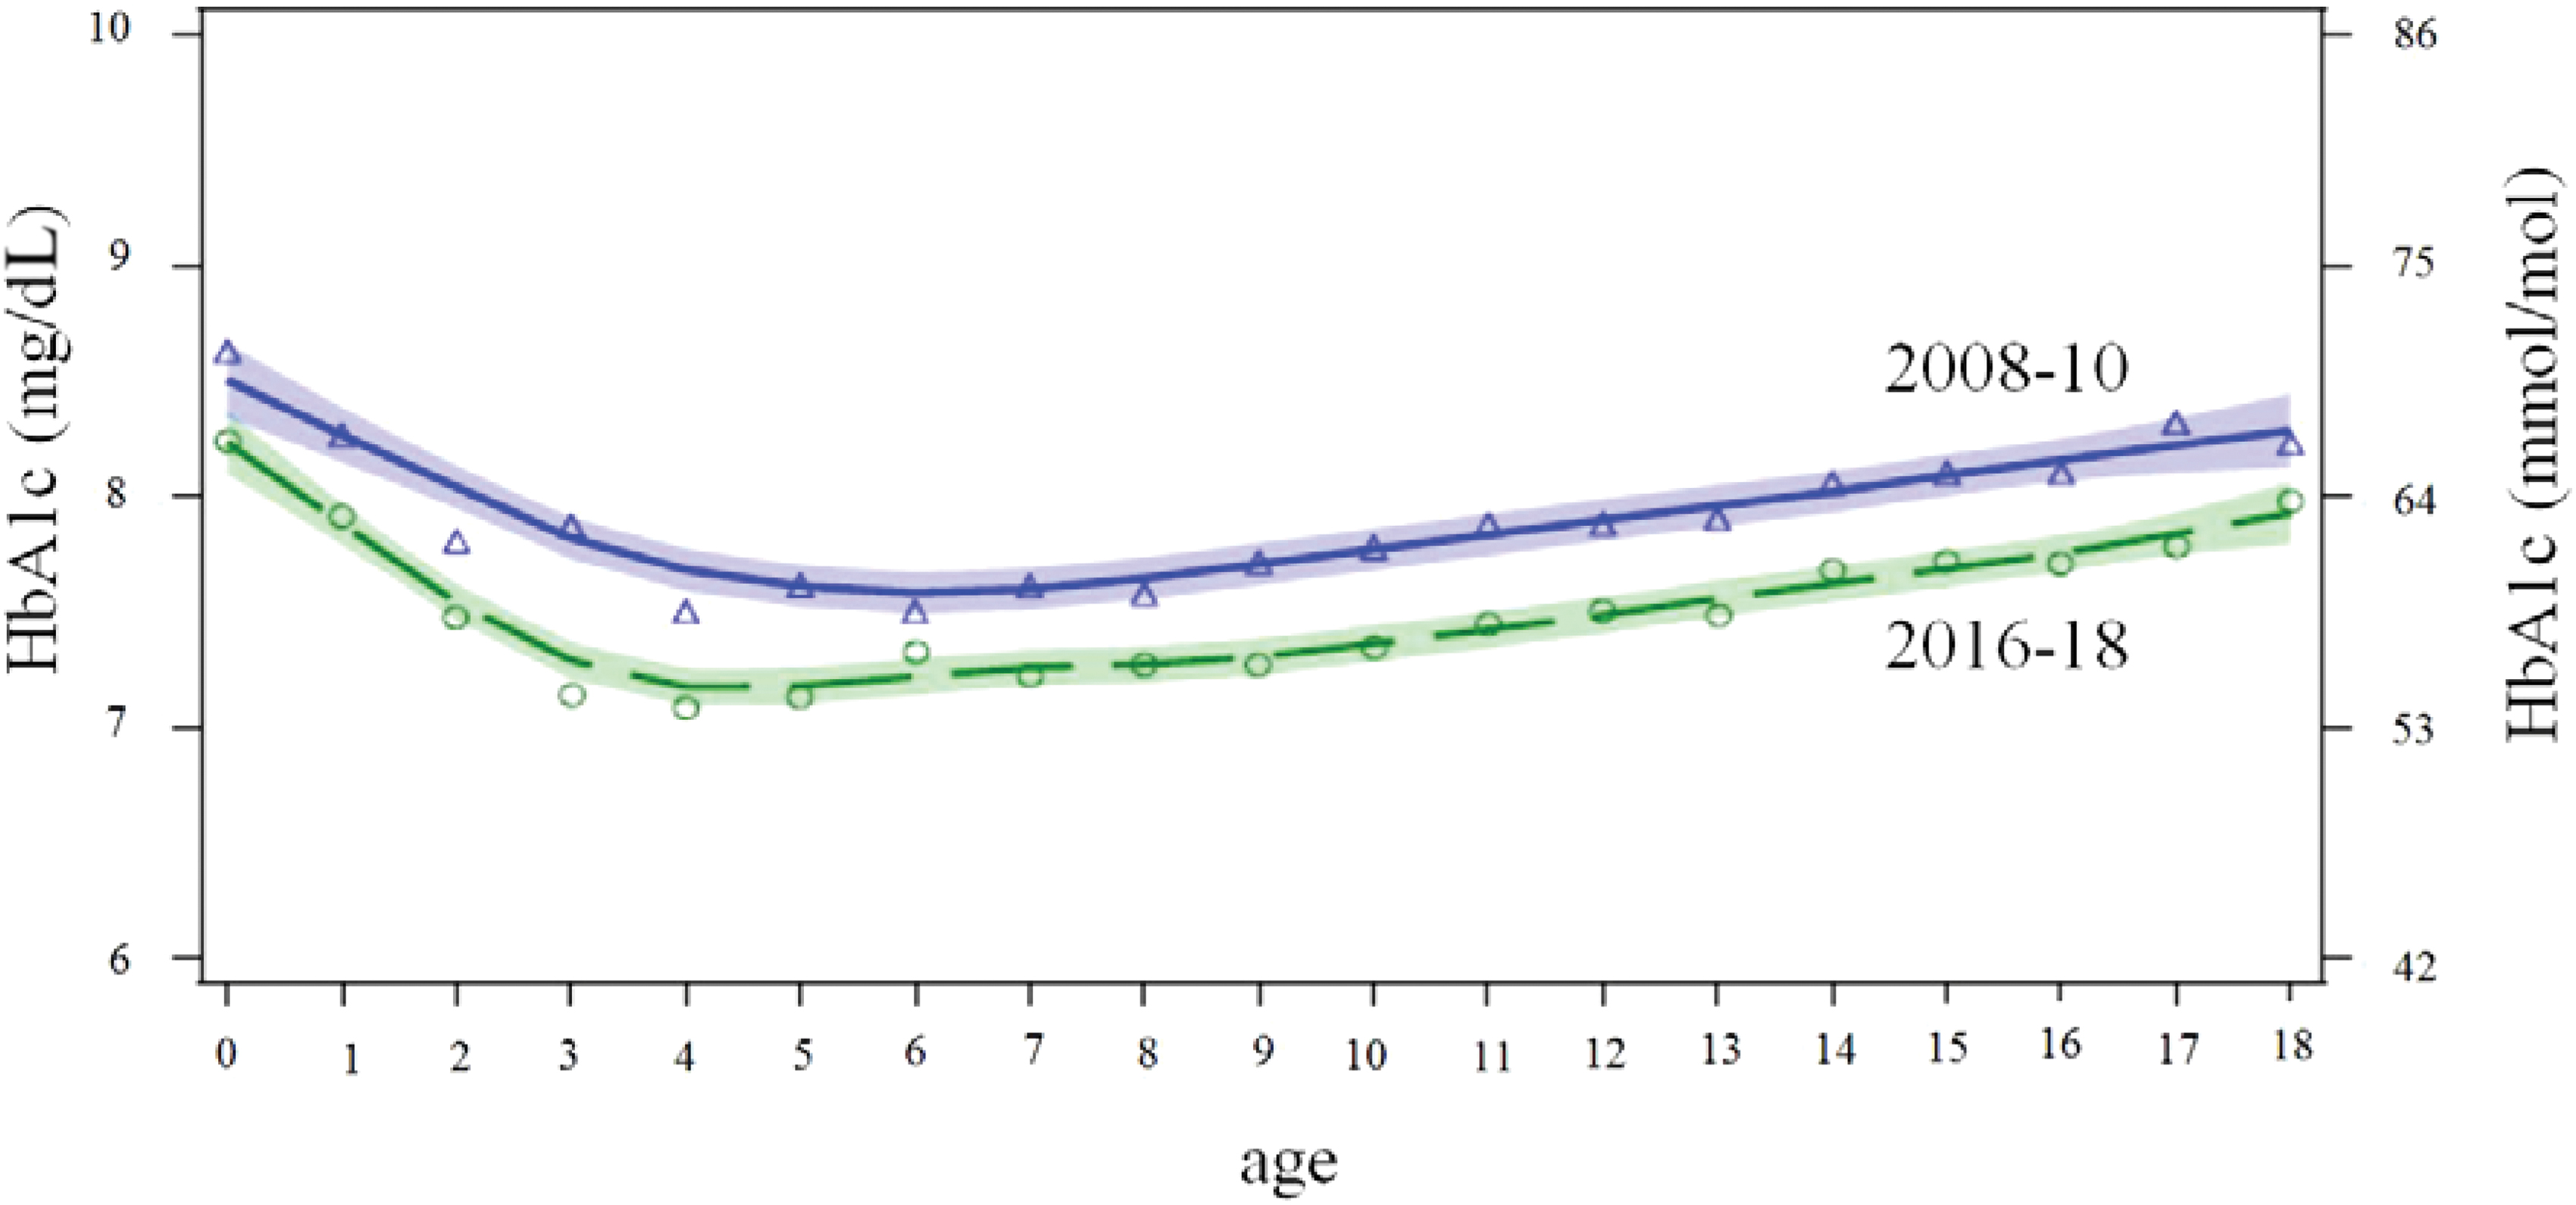
Curves of HbA1c per age for the entire cohort were estimated using locally weighted scatter plot smoothing (LOESS, shaded area: LOESS fit +95% CI) by age (years) 2008–10 (blue triangle) n = 4.930 and 2016–2018 (green circle) n = 13.654 with circles/triangles indicating the HbA1c for each year of age in each time period. There is no overlap of the CI indicating significant differences in all age groups. CI, confidence interval; HbA1c, hemoglobin A1C. Color images are available online.
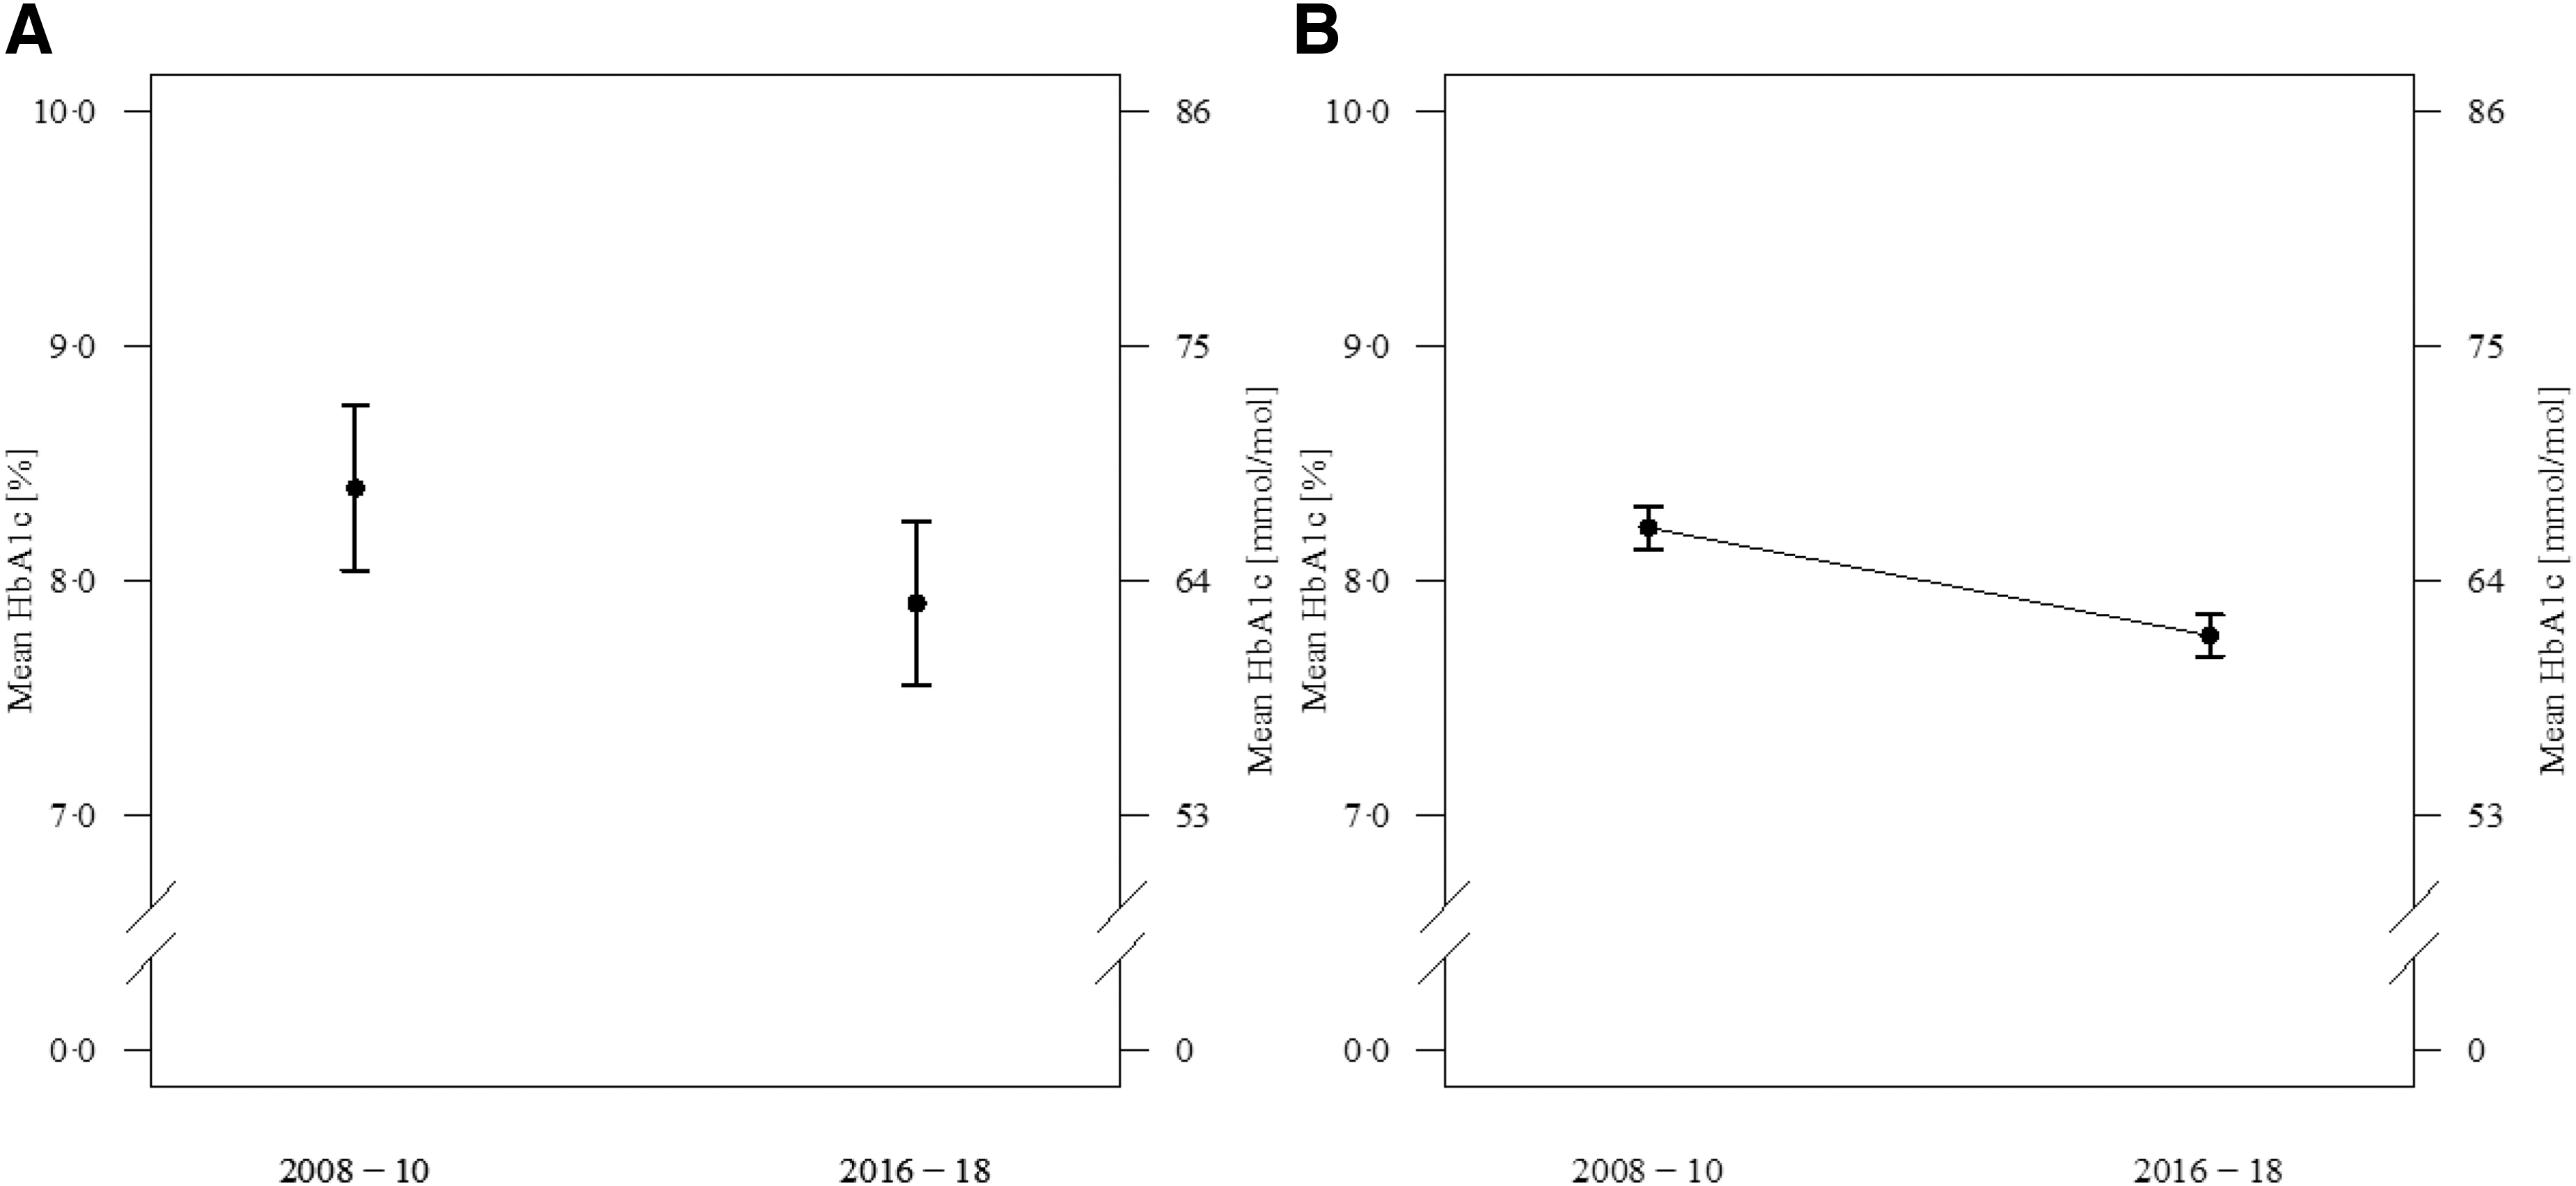
Adjusted comparison of glycemic control between the two time periods 2008–2010 and 2016–2018. Results are presented as adjusted means with 95% CIs.
Clinical outcomes in the entire cohort
Clinical variables were analyzed in the entire cohort adjusted for gender, age, and T1D duration (Table 1). The use of insulin pumps and sensors increased from 2008–2010 to 2016–2018 significantly. Adjusted HbA1c improved significantly in all age groups, in those treated with pumps or injection therapy. However, lower HbA1c values were achieved at both time points in those on CSII in all age groups (Table 1). Despite the dramatic increase of sensor use, the number of SMBG strips per day increased also minimally between the time points. Frequency of severe hypoglycemia was significantly reduced between the two time periods from 3.8% (2.9; 4.9) to 2.4% (1.9; 3.1) (P < 0.0001). A doubling in the DKA rate was seen in those using injection therapy, whereas no significant difference between both time points was observed in pumps (Table 1).
Adjusted Comparison of Clinical Outcomes Between the Two Time Periods
Linear and logistic regression model was used adjusted for gender, T1D duration, and age. Center was entered as a random intercept in the models. Results are presented as adjusted means with 95% CIs. DKA and severe hypoglycemia events are measured as incidence during treatment and not at diagnosis.
BMI-SDS, body mass index-standard deviation score; CI, confidence interval; DKA, diabetic ketoacidosis; HbA1c, hemoglobin A1C; HDL, high-density lipoprotein; LDL, low-density lipoprotein; MDI, multiple daily injections; SMBG, self-monitoring of blood glucose; T1D, type 1 diabetes.
The improvement of HbA1c over the 10-year period was accompanied with significant improvements in some other risk factors for cardiovascular disease such as BMI-SDS, systolic BP-SDS, and total cholesterol. However, after additional adjustment for HbA1c, cholesterol decrease was no longer significant (165 [161; 169] vs. 164 [161; 168] mmol/L).
Subcohort of subjects with HbA1c values at both time points
Most centers experienced a considerable increase in number of patients reported in the registry over the course of 10 years. Thus, an additional comparison of the 2008–2010 cohort with the 2016–2018 cohort was done by analyzing the 2502 persons with T1D who had HbA1c values available in both time periods. Again, after adjustment for age, gender, and diabetes duration, a decline was seen between the two time periods (Fig. 2B). When analyzing the age groups, <12, 12–16, and 16–25 years of age, the HbA1c values were reduced in the two youngest cohorts, 64 (63; 65) to 58 (57; 61) mmol/mol or 8.0 (7.9; 8.1) to 7.5 (7.4; 7.7) % in the group <12 years of age, and 68 (66; 70) to 63 (62; 64) mmol/mol or 8.4 (8.2; 8.6) to 7.9 (7.8; 8.0) % in the group 12–16 years of age. In the older age group 16–25 years of age, there was no significant change in HbA1c (65 [58; 70] vs. 65 [64; 66] mmol/mol) or (8.1 [7.5; 8.6] vs. 8.1 [8.0; 8.2] %). As in the total cohort, pump users had lower HbA1c values in both time periods (63 [62; 65] to 60 [58; 61] mmol/mol [P < 0.001]) or (7.9 [7.8; 8.1] to 7.6 [7.5; 7.7] % [P < 0.001]) compared with those on injections (69 [67; 70] to 64 [63; 65] mmol/mol [P < 0.0001] or 8.0 [8.3; 8.6] to 8.0 [7.9; 8.1] % [P < 0.001]).
Changes of glycemic control on a center level
To analyze the changes in glycemic control on a center level, HbA1c values were aggregated per center in each time period. Although the magnitude of improvement varied considerably, and for many centers it was <0.5%, usually considered as clinically significant, only one center deteriorated in average HbA1c over the 10-year period and improvements were seen independent of baseline glycemic control (Fig. 3). We found no evidence for the change of HbA1c being related to increased number of patients treated per center. The comparison of 9 centers with a significant improvement of HbA1c with 13 centers with less improvement indicated that 8 of 9 versus 6 of 13 had increased their overall number of patients to >200 in the observation period. In particular, the one center with the largest improvement over time belonged to the group with the largest increase in the number of patients, unchanged increase in pump percentage, and increased relative CGM use.
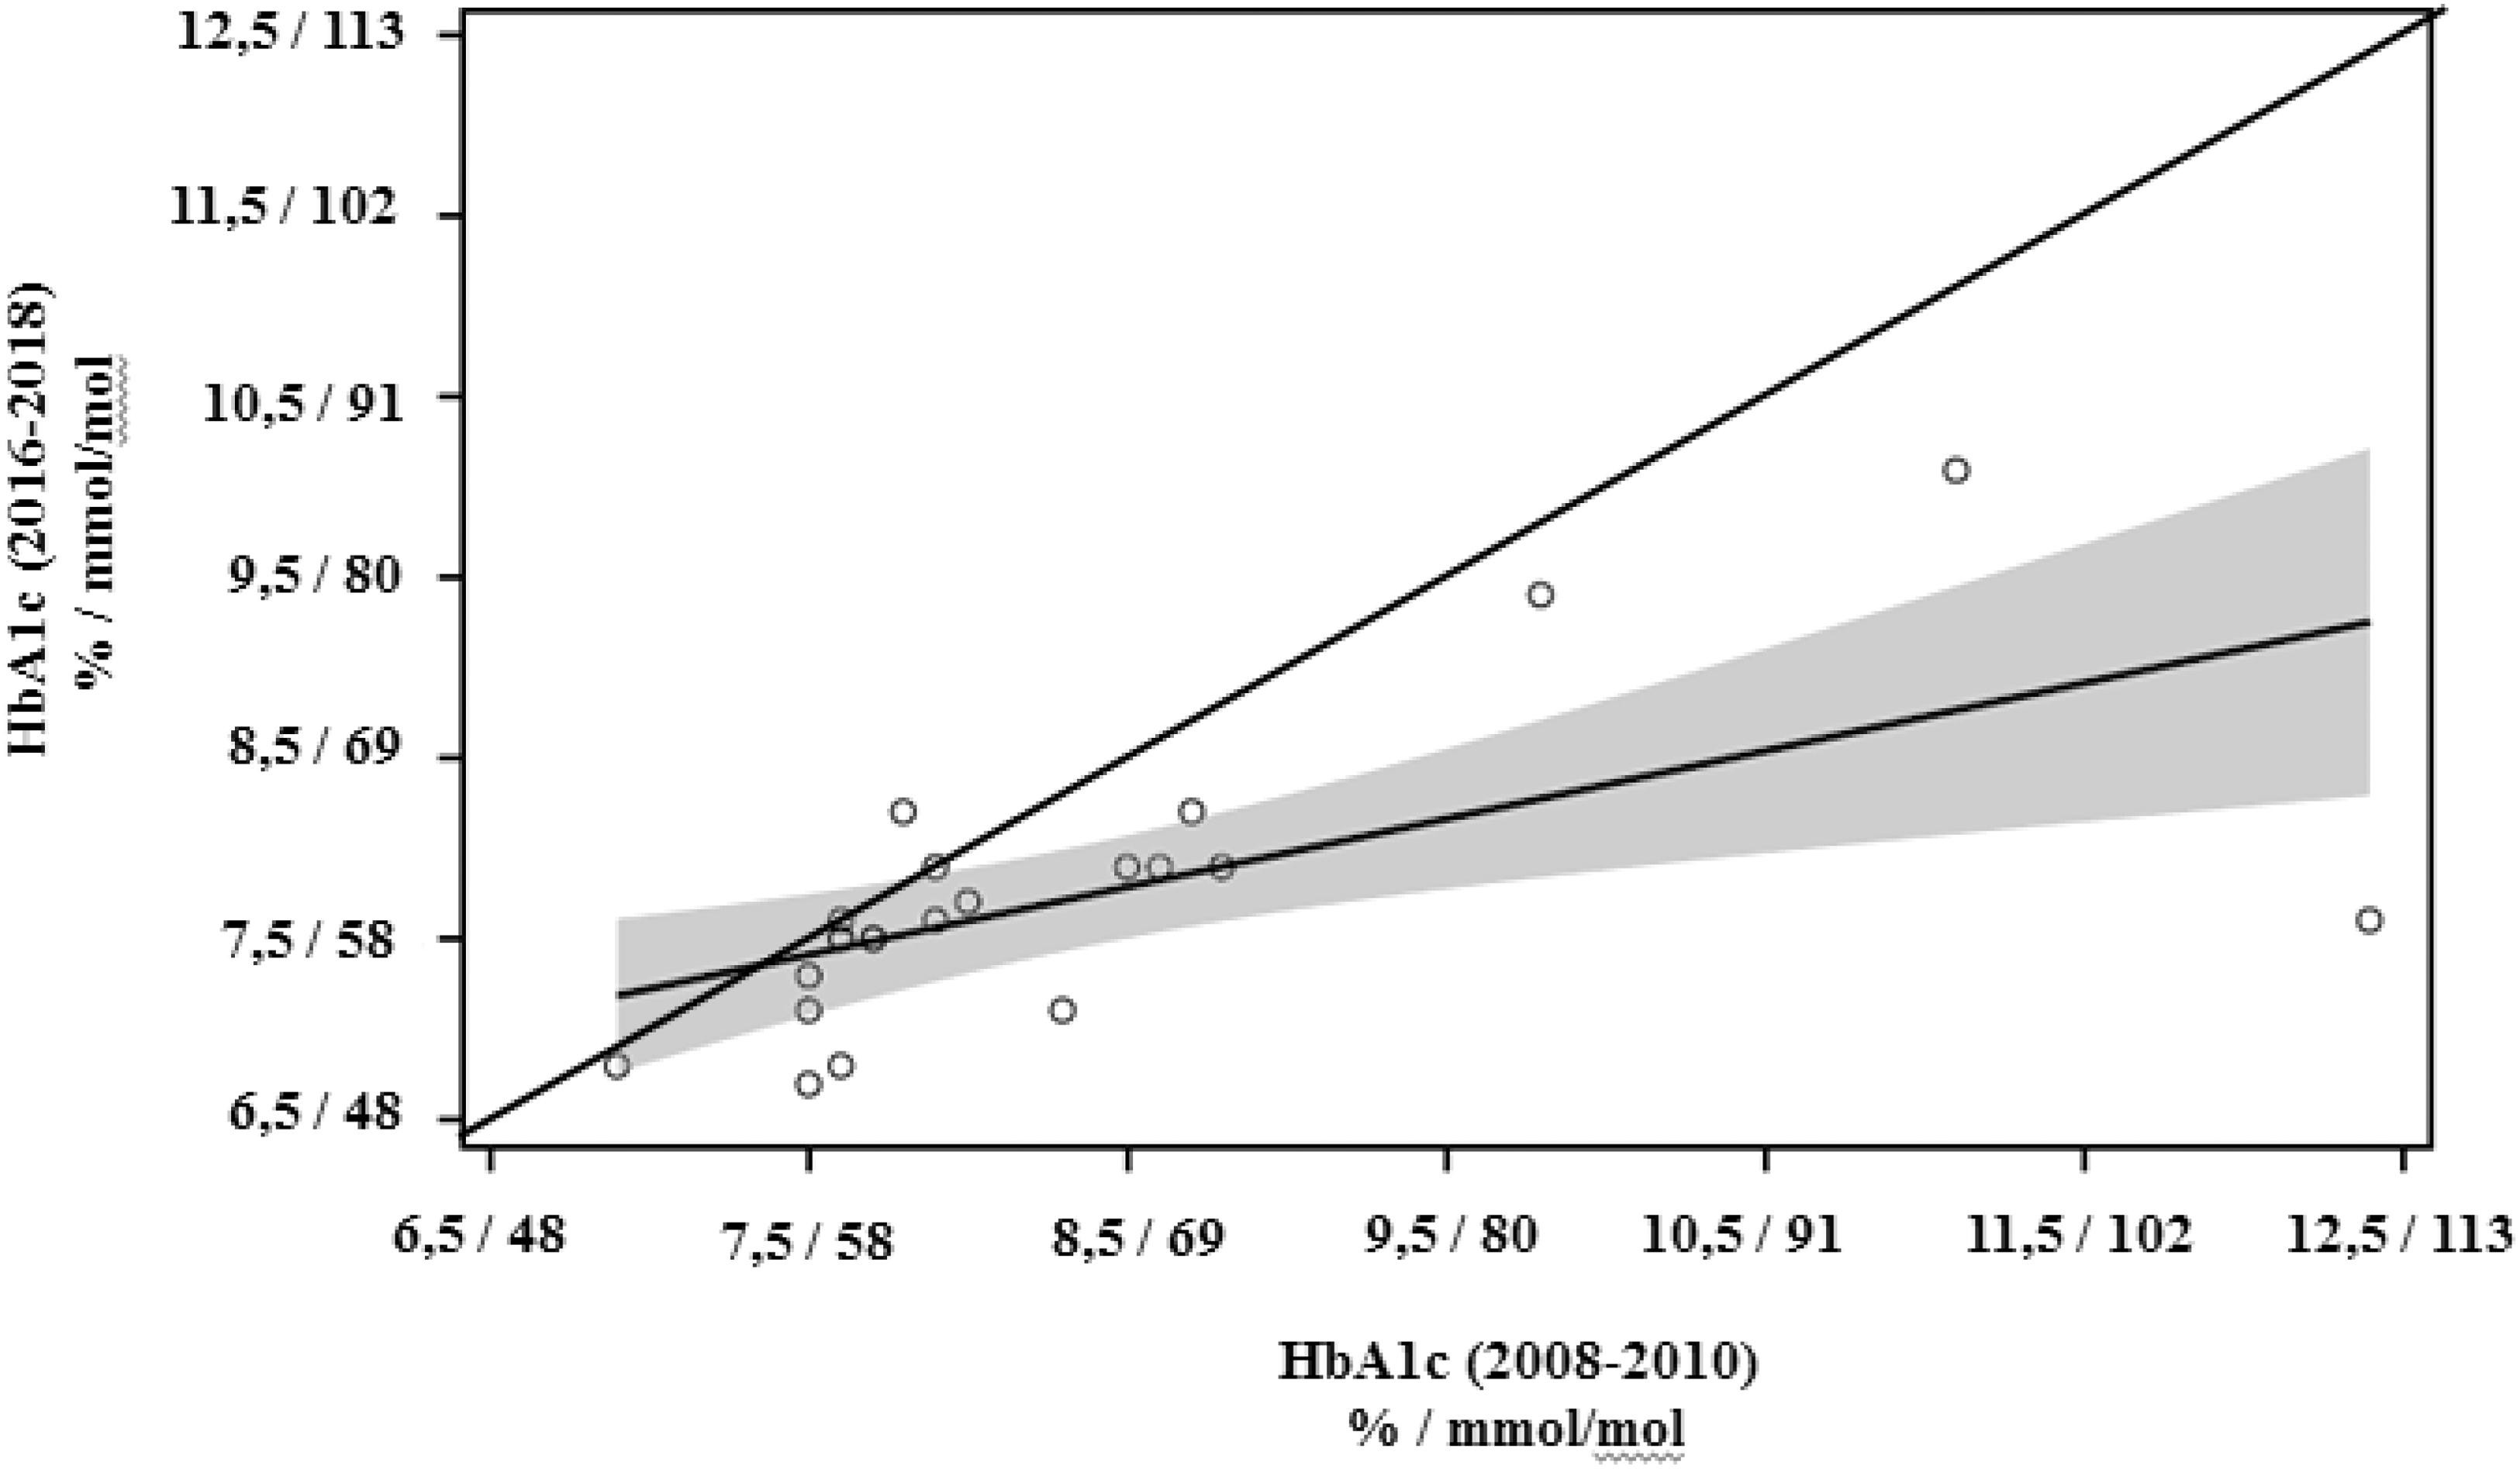
HbA1c data aggregated per center for each time period and the regression line +95% CI (shaded region). All centers below the angle bisector have shown an improvement in average A1c between the two time periods. However, the average improvement of ≥0.5% HbA1c was achieved only in 9 out of 22 centers.
Temporal trends on glycemic target achievement and diabetes technology usage
To investigate the temporal relationship between the use of pumps and sensors and achievement of target HbA1c, data of the entire cohort were aggregated for each year of treatment from 2008 to 2018. Although 21% of the participants achieved a target HbA1c of <7% (53 mmol/mol) in 2008, this remained stable until 2013 when 25% of the participants achieved this target, with the percentage continuously rising to 34% in 2018. This increase in target achievement was preceded by a rise in pump use from 34% to 44% in 2013, when it plateaued until 2018. In contrast, sensor use was negligible until the year 2015 with a sharp rise thereafter, so that more than half of the participants had a sensor in 2018 (Fig. 4).
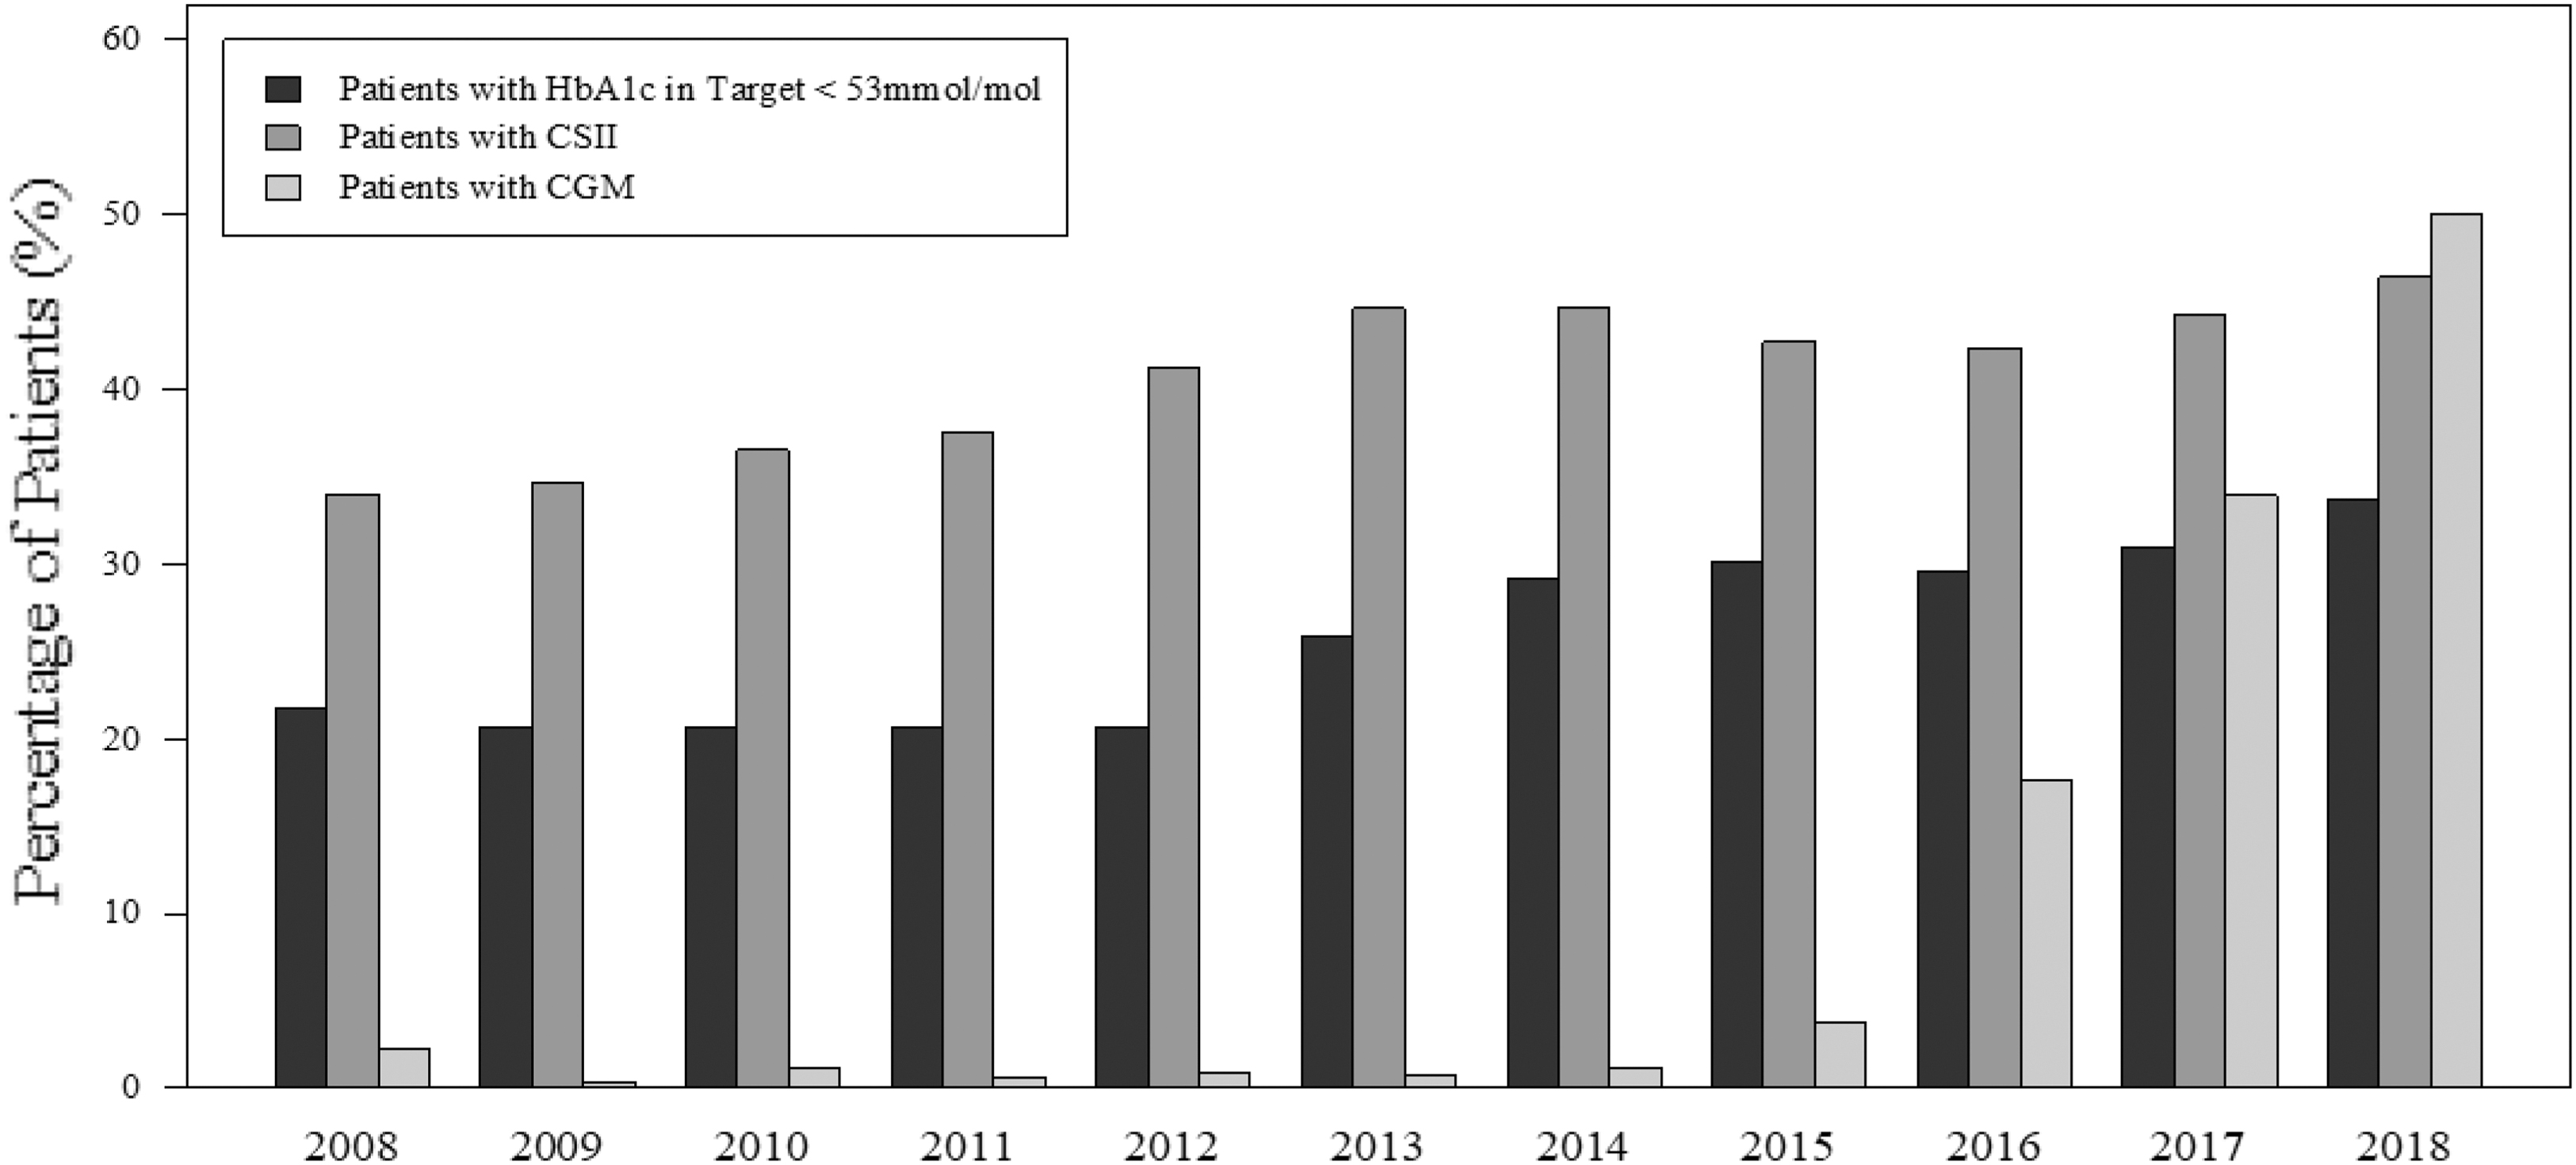
Temporal patterns of CSII and CGM use in centers and HbA1c. HbA1c data of the entire cohort were aggregated for each year of treatment from 2008 to 2018. CGM, continuous glucose monitoring.
Discussion
Our analysis demonstrated a sustained improvement in metabolic outcomes within the SWEET international network of CoR for pediatric diabetes in its first 10 years. The SWEET mission to harmonize care and to improve outcomes for children with diabetes based on agreed standards of care following international guidelines, quality control including peer audits for center certification, and data collection with biannual standardized benchmarking reports and exchange of best practices during the annual meetings 14,21 –23 seems to progress in the right direction. Significant differences exist in access to modern treatment regimens within countries and centers participating in SWEET, 27 but it is encouraging that most centers were able to improve nonetheless.
Over the past 10 years, nearly all SWEET centers showed an improvement in average HbA1c across all age groups, with an increased percentage of children and adolescents achieving the current ISPAD glycemic target (<53 mmol/mol or <7%) 3 even though the standard target during the study period was higher (<58 mmol/mol or <7.5%). Improvement in quality indicators of lower BMI, and lower cholesterol levels were demonstrated. Although improved cholesterol levels could be explained by improved glycemic control, there was an independent effect of BMI after adjustment. These improvements were possibly associated with increased use of diabetes technology: an increase in insulin pump use preceded the increased proportion of children and adolescents achieving the target HbA1c. Similar improvements are reported also by some but not all national pediatric registries. 5 –7,19 As these outcomes are not limited to HbA1c but also include common cardiovascular risk factors, they could possibly be associated with less cardiovascular mortality in the future. As the increased cardiovascular risk in T1D is related to earlier diabetes onset, 2 our results advocate the use of diabetes technology in the pediatric population. Moreover, there are several reports that COVID-19 has led to increased use of diabetes technology for telemedicine in pediatric diabetes care in many centers. Thus, the use of technology allows target-driven pediatric diabetes care also under the conditions of a virtual diabetes clinic. 28 An overall reduction of hyperglycemia with diabetes technology may improve daily cognitive functioning, 29 and prevent long-term damage to the developing brain. 12
Although our analysis confirms other registry data that the effect of age and gender on HbA1c is remarkably similar across countries, 30 it shows for the first time that the improved mean HbA1c for the entire population distributes uniformly across all age groups preserving the rise during adolescence, with injections or insulin pumps usage. However, outcomes remained better in pump users across all time points and age groups.
Although observational data cannot prove causality, the longitudinal 10-year SWEET data analysis provides evidence that increased use of diabetes technology in pediatric diabetes centers around the globe is safe and effective. Although infusion set failure could increase the risk for DKA, a significant rise in the DKA rate was only seen in those on injection therapy. It remains to be elucidated whether the reduction of the DKA rates with pump use relates to the selection of individuals for pump therapy, better education, or other factors. 20
Our results are different from those from the T1D Exchange registry: although increasing use of CGM is also associated with improved glycemic outcomes, the total T1D Exchange registry cohort showed deteriorating glycemic control. 5 However, neither the T1D Exchange registry nor SWEET is necessarily representative of the centers, and differences in the completeness of data or rates of loss to follow-up may have contributed to this. T1D Exchange registry did not intend to submit data on all the patients who receive care at those centers; that is, they included a sample of individuals who agreed to participate and were recruited within a specified period of time. By contrast, most pediatric patients who receive care at SWEET participating centers are supposed to be included in the SWEET data collection. Also, the T1D Exchange did not perform benchmarking or peer audit, further limiting the comparability. In the SWEET group, centers are not remunerated for entering their data but rather have to pay an annual membership fee to be part of the charity running the organization. In turn, centers receive peer audit to verify the quality of data collection and health care delivery, as well as standardized biannual benchmarking reports against their peers, aiming at including the total population of youth with T1D at centers.
Although our results are encouraging, most of the young individuals with T1D still remain above the recommended HbA1c target. 3 SWEET will perhaps decide for open/public benchmarking, and together with ISPAD adopts and further develops new technology-based diabetes management strategies and targets 31 for all participating centers to foster additional improvements in glycemic control. The use of technology, with the potential to lower the risk of hypoglycemia, and HbA1c may allow for more stringent CGM-based targets. 32
The observed significant decrease in the BMI-SDS seems to be of particular importance, as it is contrary to several reports from pediatric populations, 9 and is not associated with HbA1c. 8
Our study has several limitations: first the two compared periods have vast differences in populations; however, the smaller longitudinal analysis with the same population confirmed our results. Second, the data are center reported from different countries with unequal methods for data collection; however, the final database was verified biannually and the data were reverified and cleaned. As participation in SWEET is limited to larger centers with multidisciplinary care and fulfilling the criteria of being “centers of reference” put forward by SWEET, 21 the participating centers cannot be considered representative for a country or region. The countries and sites have different socioeconomic status, insurance, and support for patients that were beyond the scope of this analysis. Unfortunately, the database does not include sufficient data on the severity of DKA or the administration of extra carbohydrates for incipient hypoglycemia to further elucidate the relationship between diabetes technology and acute complications. Despite the stringent analysis plan, it was impossible to completely exclude confounding factors as can be seen in the adjustment effects between HbA1c and cholesterol levels, or to establish causality between participation in SWEET and improvement in outcomes with this real-world data.
Conclusions
Our analysis of the SWEET database demonstrates a sustained improvement in HbA1c over the 10-year period, evenly distributed throughout all pediatric age groups, and possibly associated with the use of diabetes technology, the use of a unified electronic data reporting, benchmarking, peer review, and the SWEET quality improvement strategies. Alternatively, these effects could also be the result of a secular trend and/or the result of other factors as intensification of diabetes management (education, psychosocial support, and technology usage) that have gradually become more widespread around the world. Further strategic developments in diabetes education and management, harmonized care, and unified treatment targets are necessary to prevent diabetes complications and prolong life in the majority of individuals with childhood-onset T1D.
Footnotes
Acknowledgments
We thank the following for their support of this study: Katharina Fink for the data management as well as Andreas Hungele and Ramona Ranz for the DPV software (all Ulm University, Germany), Ines Hiller, Katharina Klee (Kinderkrankenhaus Auf der Bult, Hannover, Germany), and Reinhard Holl (Ulm University, Germany) for their invaluable support and Claudia Graham for an independent review of the content and grammar of the article. Finally, we thank all participating centers of the SWEET network, especially the collaboration centers in this investigation (Supplementary Appendix S1).
Authors' Contributions
P.G., A.S., M.W., O.K., J.S., G.F., T.B., H.V., and T.D. contributed to the study concept and design. P.G., A.S., and T.D. supervised the study. A.S. analyzed the data. All authors participated in data interpretation. Each author drafted a section of the article, the final article was reviewed and approved by all. T.D. is the guarantor of the study and takes full responsibility for the work as a whole, including the study design, access to data, and the decision to submit and publish the article.
Author Disclosure Statement
P.G. is a shareholder of the Inst. of Applied Economics and Health Research. O.K. received honoraria for being on the advisory board of Novo Nordisk as well as speaker's honoraria from Eli Lilly and Sanofi. T.B. served on advisory boards of Novo Nordisk, Sanofi, Eli Lilly, Boehringer, Medtronic, and Bayer Health Care. T.B.'s institution received research grant support, with receipt of travel and accommodation expenses in some cases, from Abbott, Medtronic, Novo Nordisk, GluSense, Sanofi, Sandoz and Diamyd. T.D. has received speaker's honoraria and research support from and has consulted for Abbott, AstraZeneca, Boehringer, DexCom, Lilly, Medtronic, Novo Nordisk, Roche, Sanofi, and Ypsomed. T.D., O.K., and T.B. are shareholders of DreaMed Ltd. P.G., A.S., M.W., J.S., G.F., and H.V. declare that there is no duality of interest associated with their contribution to this article
Funding Information
SWEET is a registered nonprofit charity in Hannover, Germany. It is financed through membership fees of the participating centers (based on income of country of residence according to the World Bank) and corporate members. We acknowledge with gratitude the support from the following SWEET e.V. corporate members—in alphabetical order: Abbott, Boehringer Ingelheim, DexCom Inc., Insulet, Eli Lilly & Co., Medtronic Europe, Sanofi.
Supplementary Material
Supplementary Appendix S1
References
Supplementary Material
Please find the following supplemental material available below.
For Open Access articles published under a Creative Commons License, all supplemental material carries the same license as the article it is associated with.
For non-Open Access articles published, all supplemental material carries a non-exclusive license, and permission requests for re-use of supplemental material or any part of supplemental material shall be sent directly to the copyright owner as specified in the copyright notice associated with the article.