
Abstract
Background:
Glycated hemoglobin A1c (HbA1c) is a key biomarker in the glycemic management of individuals with diabetes, but the relationship with glucose levels can be variable. A recent kinetic model has described a calculated HbA1c (cHbA1c) that is individual specific. Our aim was to validate the routine clinical use of this glucose metric in younger individuals with diabetes under real-life settings.
Materials and Methods:
We retrieved HbA1c and glucose data from the German–Austrian–Swiss–Luxembourgian diabetes follow-up (DPV) registry, which covers pediatric individuals with type 1 diabetes (T1D). The new glycemic measure, cHbA1c, uses two individual parameters identified by data sections that contain continuous glucose data between two laboratory HbA1c measurements. The cHbA1c was prospectively validated using longitudinal HbA1c data.
Results:
Continuous glucose monitoring data from 352 T1D individuals in 13 clinics were analyzed together with HbA1c that ranged between 4.9% and 10.6%. In the prospective analysis, absolute deviations of estimated HbA1c (eHbA1c), glucose management indicator (GMI), and cHbA1c compared with laboratory HbA1c were (median [interquartile range]): 1.01 (0.50, 1.75), 0.46 (0.21, 084) and 0.26 (0.12, 0.46), giving an average bias of 0.6, 0.4 and 0.0, respectively, in National Glycohemoglobin Standardization Program (NGSP) % unit. For eHbA1c and GMI only 25% and 54% of subjects were within ±0.5% of laboratory HbA1c values, whereas 82% of cHbA1c were within ±0.5% of laboratory HbA1c results.
Conclusions:
Our data show the superior performance of cHbA1c compared with eHbA1c and GMI at reflecting laboratory HbA1c. These data indicate that cHbA1c can be potentially used instead in laboratory HbA1c, at least in younger individuals with T1D.
Introduction
Glycated hemoglobin (HbA1c) has been used as a biomarker to predict the risk of developing future diabetes-related complications, given it reflects intracellular hyperglycemia and hence predisposition to organ damage. 1,2 Although glucose levels and HbA1c are usually well correlated at the population level, 3,4 this is not necessarily the case in all individuals with diabetes, 5 –7 which has clear clinical implications. Therefore, it is crucial to understand the relationship between glucose and HbA1c in each individual to make the correct management decisions. Several mathematical models 3,4,8,9 have been developed to estimate HbA1c from glucose, and average red blood cell (RBC) age variation has been proposed to explain the individual variation in this relationship.
The most widely adopted methods are estimated HbA1c (eHbA1c) 3 and glucose management indicator (GMI), 4 which assume a universal linear correlation between glucose and HbA1c. Although these methods are derived from study data to determine a best-fit linear regression between HbA1c and average glucose, they are susceptible to fitting variation due to study cohort characteristics and specific regression settings. These models failed to link the optimized parameters with clear biological or physiological features and, therefore, provide little mechanistic insight.
In 2014, Kovatchev and colleagues introduced a method of estimating HbA1c by tracking of average glycemia over time with several global parameters and an individual hemoglobin glycation rate for calibration. 9 Recently, an extension of this method utilized glucose time-in-range with additional glucose parameters. 10 In 2016, Malka et al. proposed a model to explain the variation in glucose-HbA1c relationship with an individual's mean RBC age 8 (mean RBC age is about half of RBC lifespan), thus having more physiological relevance. Our approach has further improved on previous models by having two patient-specific kinetic rate constants to model both RBC glycation and turnover processes, thus providing a physiologically relevant and more accurate calculation of HbA1c. 11
Previous large-scale studies on individuals with type 1 diabetes (T1D) have shown that HbA1c is not determined by blood glucose levels alone, which led to the concept of hemoglobin glycation index (HGI) that represents the difference between observed and predicted HbA1c. 12,13 The importance of HGI has been emphasized after demonstrating that it can predict diabetes complications, 14 –17 further highlighting the drawbacks of HbA1c in some patients with diabetes. This can be explained by the fact that HbA1c is not only dependent on blood glucose levels but is also modulated by RBC lifespan, cellular glucose uptake, and glycation efficiency, factors that vary across individuals.
Indeed, a recent kinetic model 11 has demonstrated that the association between glucose and HbA1c is mainly modulated by the rate of RBC turnover (or RBC lifespan) and hemoglobin glycation, supporting the concept of “individual glucose-HbA1c relationship”. 18,19 Scientifically, the model helps to understand the factors that underpin the relationship between glucose levels and HbA1c, while clinically it also explains the mechanisms for the discrepancy between HbA1c and glucose levels in some individuals. This model created a new glycemic measure, calculated HbA1c (cHbA1c), which can be particularly helpful in the management of younger individuals with diabetes by avoiding the need for regular blood sampling for laboratory HbA1c checks. Also, it allows the prediction of early HbA1c response to a management strategy, which can be easier to understand than various continuous glucose monitoring (CGM) measures. 20,21
Although the original model was constructed using data from individuals with both type 1 and type 2 diabetes, they were all adult patients enrolled in randomized controlled trials and data were retrospectively analyzed. Moreover, given the adult population studied previously, it is unclear whether the model applies to children with diabetes, a group that would benefit the most from avoiding frequent laboratory HbA1c measurements. Therefore, our aim was to validate this method in a large cohort of young individuals with diabetes under real-life settings, to use this model in routine clinical practice.
Materials and Methods
Description of data
The kinetic model takes one or more data sections to estimate the individual kinetic parameters. Each data section consists of a frequent glucose trace (at least every 15 min) between two laboratory HbA1c values at least 2 weeks apart. To ensure acceptable accuracy of estimates, data were analyzed only when 80% of CGM data points were available. For example, for a 2-week data section, the 15-minute CGM trace should contain 1344 glucose readings. For our analysis, at least 1075 readings (or 80% of glucose data) were required. Additional requirements were having no CGM data gaps of >24 h and at least three data sections (at least two for parameter estimation and one for prospective evaluation). To simulate the clinical application of the method, the final data section of each subject was excluded from the parameter estimation and used to prospectively calculate an HbA1c value (termed “cHbA1c”) for comparison with laboratory HbA1c (Fig. 1).
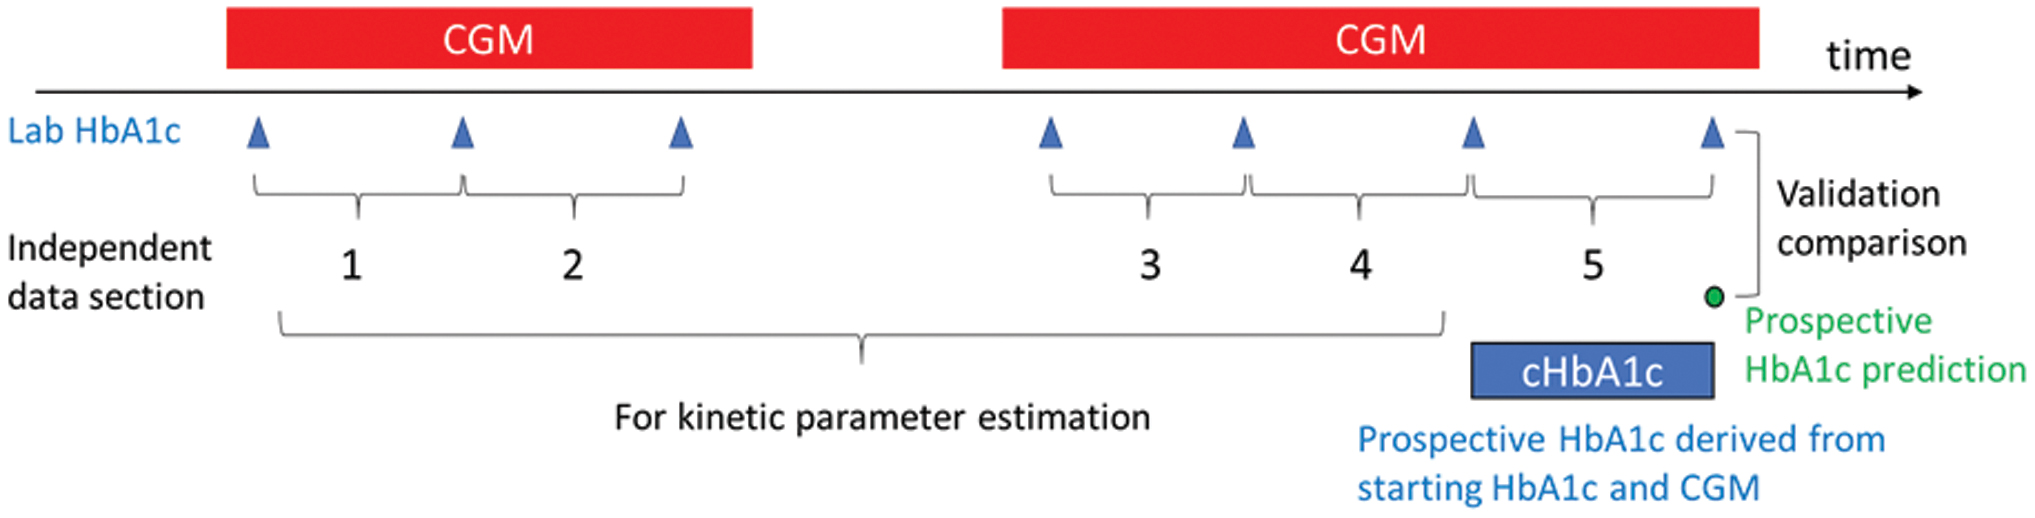
Illustration of data sections and kinetic parameter calculation and validation. Color images are available online.
The pediatric cohort in the German–Austrian–Swiss–Luxembourgian diabetes follow-up (DPV) registry was used and data from 352 type 1 pediatric patients (Table 1) met the aforementioned quality and sufficiency criteria. In this cohort, all subjects came from 13 German clinics with the same CGM technology (FreeStyle Libre®; Abbott Diabetes Care). The laboratory HbA1c measurements, with Diabetes Control and Complications Trial (DCCT) reference range adjustment, 22 were determined by a variety of methods, including DCA®, QuoTest, high-performance liquid chromatography (HPLC), and immunoassay. The IRBs at all participating institutions reviewed and approved pseudonymized data collection. The ethics committee of Ulm University approved analysis of anonymized DPV data.
Subject and Data Descriptions
CGM, continuous glucose monitoring; HbA1c, hemoglobin A1c; IQR, interquartile range; MDI, multiple daily injections; STD, standard deviation; T1D, type 1 diabetes.
Statistics and computations
Calculated HbA1c
The two kinetic parameters for each individual (rates for RBC turnover and glycation) were calculated using the published model 11 with all data sections included except the last. As shown in Figure 1, the prospective use of the model with the individual kinetic parameters on the final data section produced cHbA1c within the data section. Both kinetic parameter estimation and prospective cHbA1c calculations were performed with Eq. (8) in a previous publication, 11 which is listed in Supplementary Methods.
eHbA1c, GMI, and HGI
To compare cHbA1c with established average glucose markers, the corresponding eHbA1c and GMI values were determined by 14-day average CGM glucose (AG) and time weighted average glucose (WAG). The time WAG was calculated over 120 days before a specific time point. 8 The equation is listed in the Supplementary Methods.
eHbA1c and GMI were calculated from AG according to published regression equations, 3,4 which are listed in the Supplementary Methods.
HGI was calculated by subtracting eHbA1c from observed HbA1c. Average HGI was calculated within all data sections for each subject.
Comparison with laboratory HbA1c
The performance of the methods to estimate laboratory HbA1c was analyzed by measuring absolute deviation distributions and R 2 values from Pearson's correlation of linear regression for each eHbA1c in relation to laboratory HbA1c.
The glycation ratio, K, was calculated as the ratio of the estimated hemoglobin glycation and RBC turnover rate parameters, k gly and k age, 11 for each subject. The correlation between average HGI and K was examined by linear regression. To investigate if more data will lead to better accuracy, we grouped the subjects into quartiles by the number of data sections. We then compared the model accuracy performance among the quartiles.
Data handling and presentation
Distributions were characterized by the mean and standard deviation for normally distributed data and by median and interquartile range for non-normally distributed data. Statistical significance was set at P < 0.05. Glucose trace gaps <45 min had missing values imputed with the nearest observation or average of nearest observations if both were available (the observations immediately before or after the gap). For a longer gap, each missing value was imputed with the average of the observations at the same time in previous and next days. We used Python/SciPy 23 and SAS (version 9.4; SAS Institute, Cary, NC) software packages for all analyses.
Results
Prospectively cHbA1c and validation of the method
Prospective use of the model with individual kinetic constants produced significantly more accurate predictions of laboratory HbA1c compared with eHbA1c and GMI. Table 2 lists the absolute deviation distributions of HbA1c estimation from the evaluated models. The kinetic model has the smallest median and mean absolute deviation of 0.26% and 0.32%, with P < 0.001 compared with the deviations from the eHbA1c and GMI models.
Accuracy Comparison Among HbA1c Estimation Methods, Demonstrating Absolute Deviation Distribution of the Different Average Glucose Measures Compared with Laboratory HbA1c
All pairwise comparisons between cHbA1c and other methods yielded t > 8.8 and P-values <0.001.
AG, average glucose; cHbA1c, calculated HbA1c; eHbA1c, estimated HbA1c; GMI, glucose management indicator; IFCC, International Federation of Clinical Chemistry and Laboratory Medicine; NGSP, National Glycohemoglobin Standardization Program; SEM, standard error of mean; WAG, weighted average glucose.
Compared with both eHbA1c and GMI, CGM-derived cHbA1c better agrees with laboratory HbA1c (Fig. 2A–C). Importantly, cHbA1c has minimal clinically relevant deviation with >82% subjects within ±0.5% from laboratory value, compared with eHbA1c and GMI, which can show large deviations with only 25% and 54% subjects within ±0.5% from the laboratory values. In this cohort, laboratory HbA1c ranged from 4.9% to 10.6%, with a mean value of 7.2%. At this mean value, cHbA1c has a 95% prediction confidence interval ranging from 6.4% to 8.0%, which is 33%–39% improvement in accuracy compared with eHbA1c (5.9%–8.5%) and GMI (5.9%–8.4%). The tighter association between cHbA1c and laboratory HbA1c is also reflected by the larger R 2 value and the regression closest to the identity line.
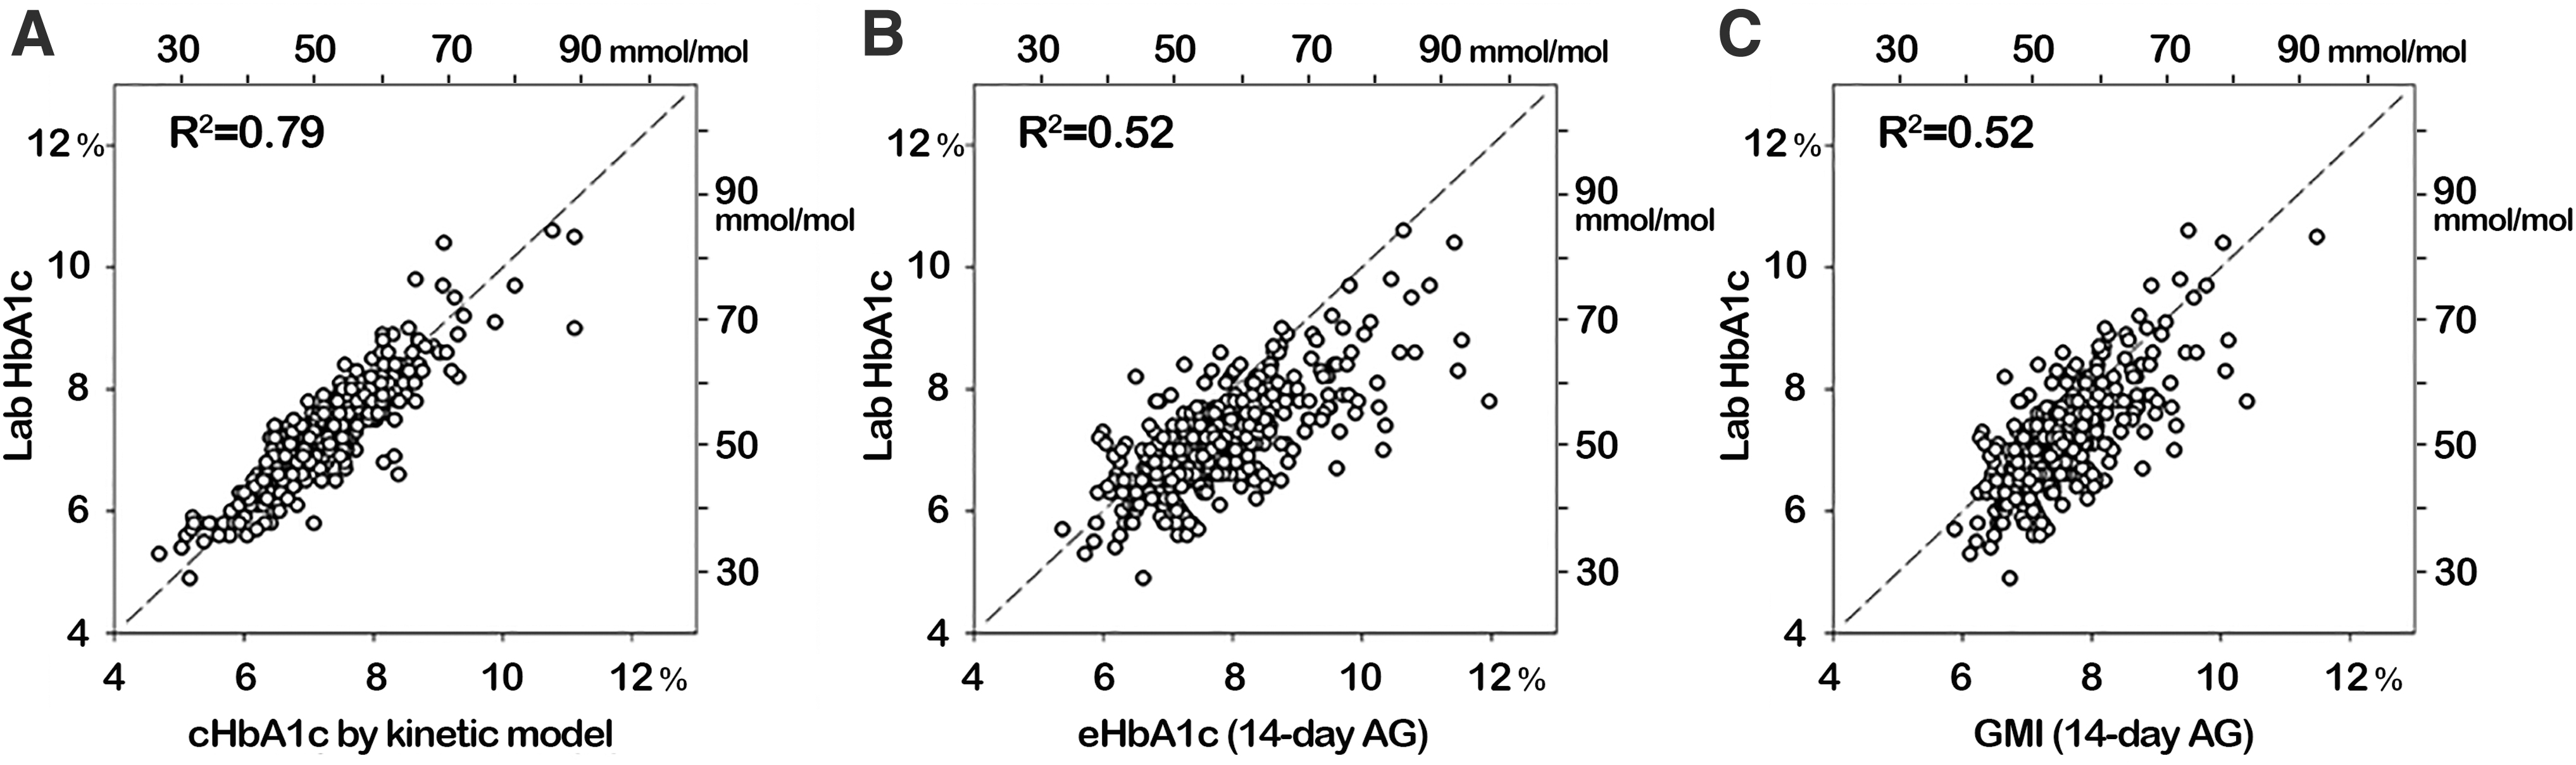
The agreements between CGM-derived HbA1c and laboratory HbA1c. HbA1c, hemoglobin A1c.
To account for common confounders in diabetes, data were analyzed according to gender, diabetes duration, migratory background (patient or at least one parent born outside of Germany, Austria, Switzerland, or Luxembourg), 24 and insulin-therapy subgroups (Table 3). Gender did not affect the accuracy of cHbA1c; neither did diabetes duration or methods of insulin administration. In contrast, eHbA1c was affected by gender, whereas GMI and eHbA1c were both affected by the insulin administration method. Therefore, cHbA1c was the only model that remained accurate in the subgroup analyses.
The Agreements Between Estimated HbA1c and Laboratory HbA1c According to Gender, Diabetes Duration, and Insulin Therapy Subgroups
The significant p-values (<0.05) are printed in bold.
Migrant: patient or at least one parent born outside of Germany, Austria, Switzerland or Luxembourg.
ANOVA, analysis of variance; CSII, Continuous Subcutaneous Insulin Infusion.
Correlation between HGI and K
The difference between eHbA1c and laboratory HbA1c, referred to as HGI, relates an individual's glycation potential. In our model, the glycation ratio, K = k gly /k age, drives the deviation between glucose and HbA1c under steady-state conditions. For this reason, K should be proportional to HGI. We assessed the role of the kinetic model in determining the relationship between the glycation ratio K and HGI in Figure 3. Our data show a strong positive correlation between HGI and K (R 2 = 0.76; P < 0.001), which further demonstrates the validity of our model.
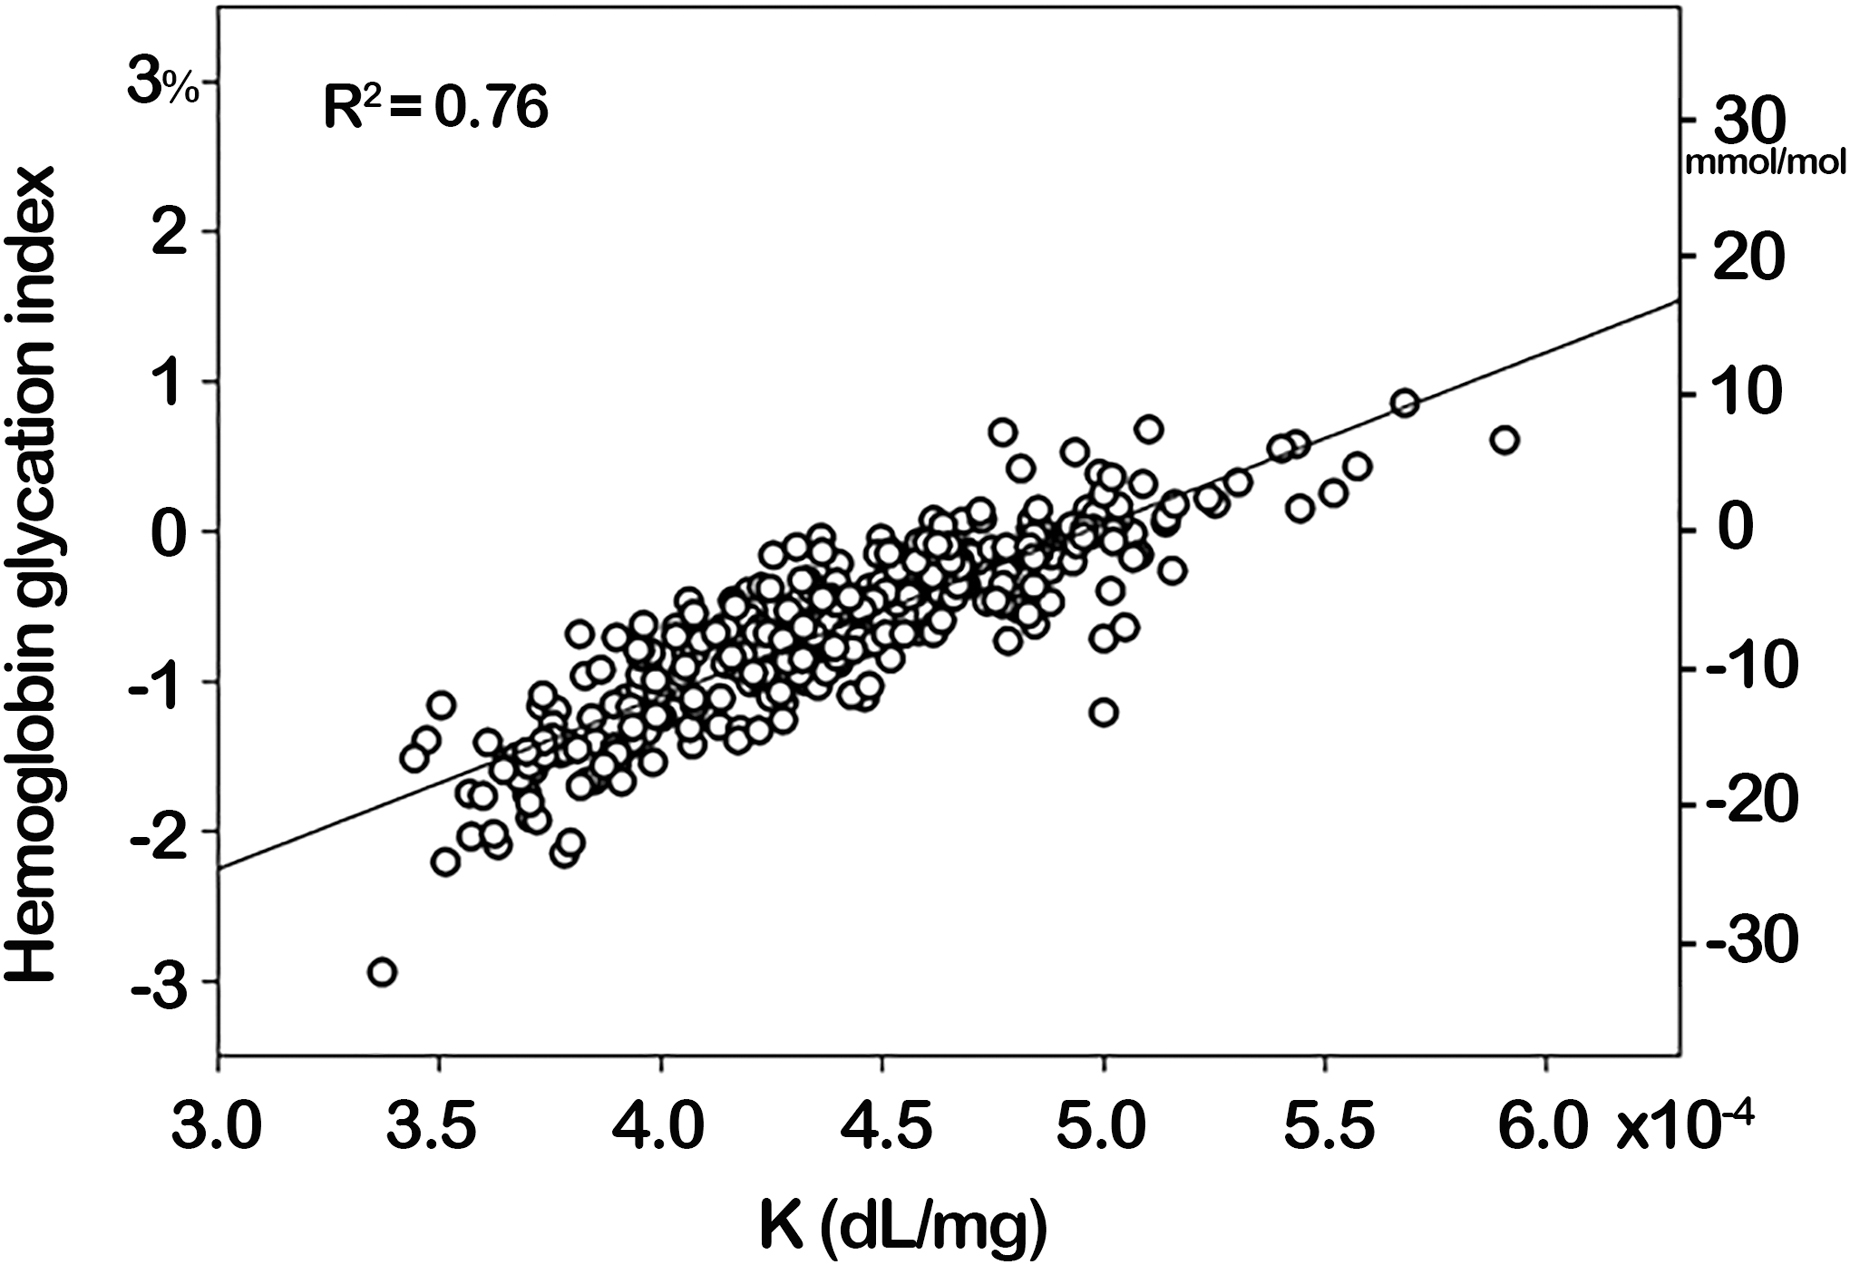
Association between K (K = k gly /k age) and HGI. HGI, hemoglobin glycation index.
Data section count and the quality of the kinetic parameters
The box plot in Figure 4 confirmed that higher data section counts is associated with better accuracy. Our model relies on two kinetic parameters (k gly and k age), which can be identified with data sections. More data sections should improve accuracy by providing additional resolution to identify the two parameters and also averaging out measurement errors in observed data. As expected, the median absolute deviation of the predicted HbA1c declined as the data section count increased, with significantly different mean absolute deviations between the first and fourth data section count quartiles (P = 0.048). However, it should be noted that the accuracy level was still high, even in the low data section quartile.
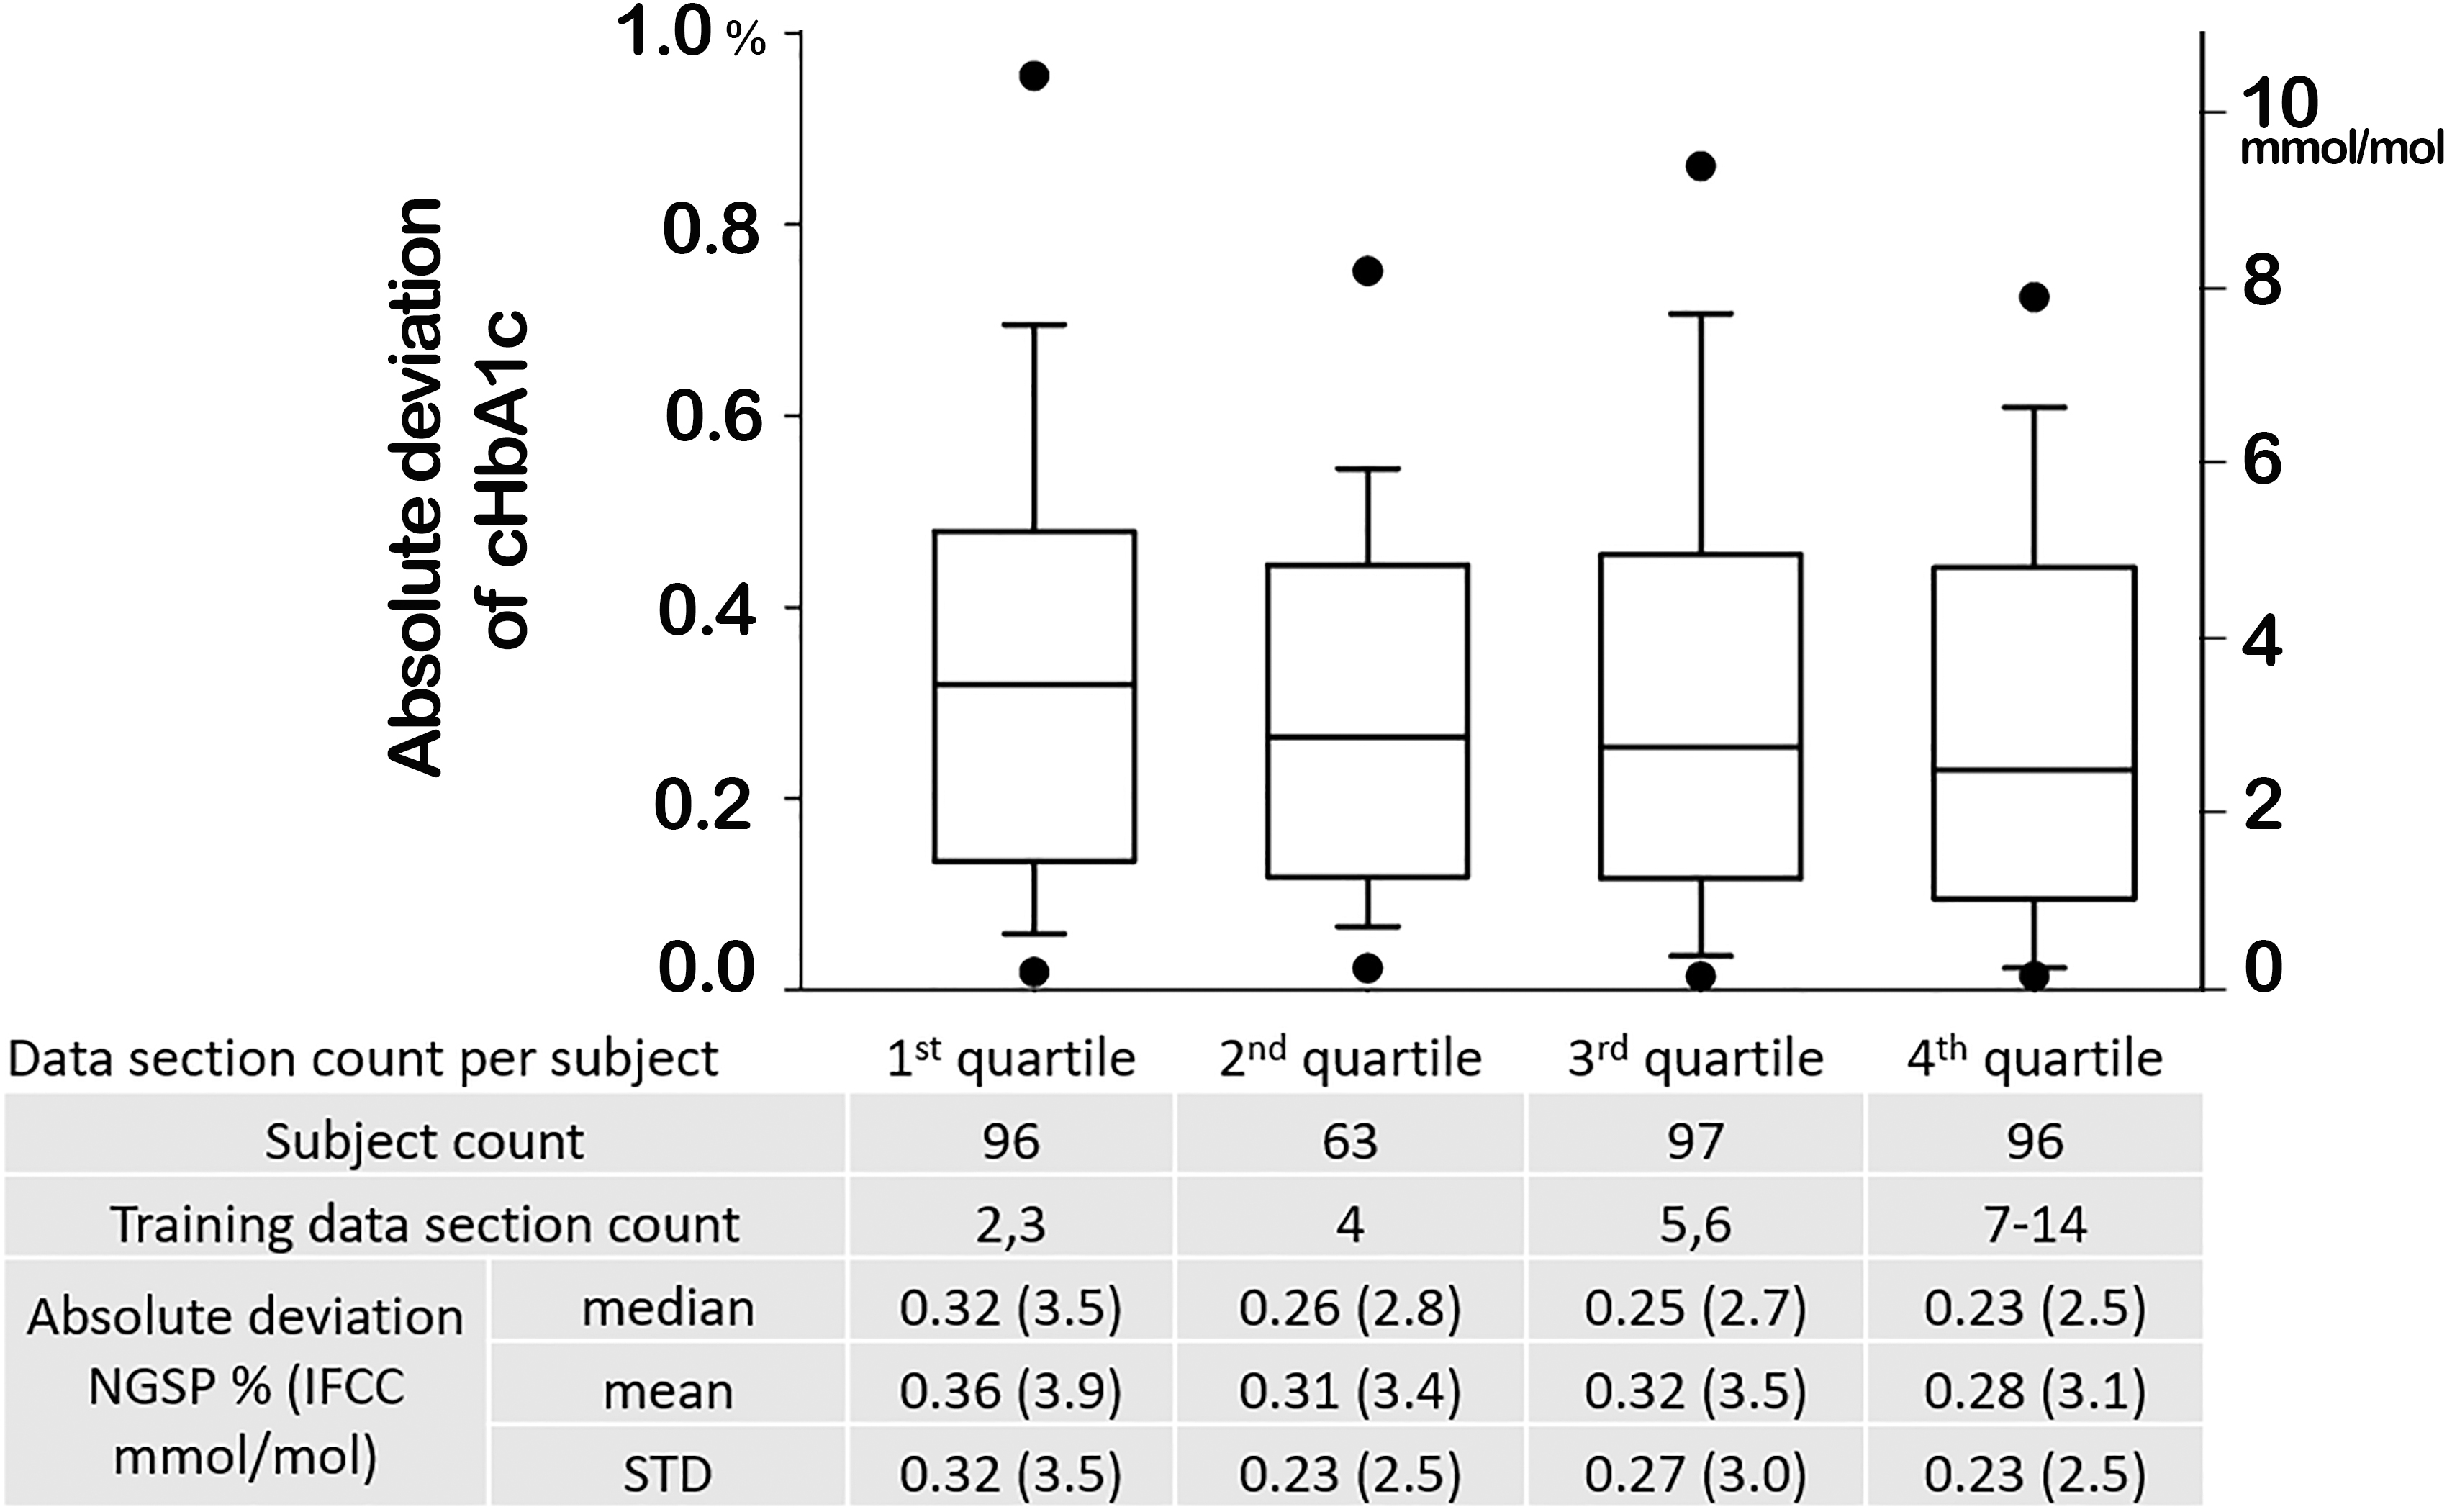
Absolute deviation distribution in data section count quartiles. A data section consists of a frequent glucose trace between two laboratory HbA1c values.
Discussion
The previously reported kinetic model explains the relationship between glucose level and HbA1c with two kinetic rate parameters for individual RBC turnover and hemoglobin glycation. The model was based on testing 120 adult individuals with T1D and type 2 diabetes (T2D) from two RCTs and employing retrospective analysis of the data. 11 In this study, we conducted a prospective study in a pediatric/young adult population using real-life data to validate the model for routine clinical use. A total of 352 participants from the European DPV registry of 13 centers were analyzed for accuracy of cHbA1c at predicting laboratory HbA1c.
Our data demonstrate a far superior accuracy of cHbA1c at predicting laboratory HbA1c, compared with established methods, including eHbA1c and GMI. This indicates that cHbA1c can be used instead of laboratory HbA1c in clinical practice, which has a number of advantages. First, patient inconvenience is minimized by avoiding a blood test that can be a source for anxiety, particularly in the younger population. Also, since the sensor data can be electronically transmitted, this method can reduce direct patient contact and improve social distancing in the time of COVID crisis.
Second, this method allows early prediction of HbA1c after alteration in diabetes management. It can be argued that CGM in itself is enough to assess response to a particular management strategy, but in practice HbA1c is still required as patients/parents are more familiar with this simple glycemic measure, which also applies to health care providers. In the times of pandemic with inability to come to the outpatient clinic, this parameter would help in the establishment of a virtual diabetes clinic. 25 Third, reduction in laboratory HbA1c testing will have welcome cost implications, particularly with the spiraling expenditure of managing diabetes.
Our results indicate that increased CGM data section count improves accuracy of kinetic parameters. However, even with 2–3 data sections, the median absolute deviation of cHbA1c was 0.32%, an accuracy that is close to a clinically safe threshold. With more data sections, further accuracy improvement can be achieved.
In addition, we have demonstrated the accuracy and stability of cHbA1c model in various patient groups by comparing the mean absolute deviations according to gender, migratory background, diabetes duration, and insulin therapy subgroups, further indicating that cHbA1c model can be used both effectively and safely in routine clinical practice. In fact, the accuracy of eHbA1c appears to be affected by gender, whereas the accuracy of both GMI and eHbA1c is affected by the mode of insulin administration, making cHbA1c a more effective option for estimating laboratory HbA1c.
In addition to the clinical utility of cHbA1c, this study provides additional data to understand the potential factors that modulate HGI, which has been linked to diabetes complications. 12,13 The parameter K reflects the balance between hemoglobin glycation (or RBC glucose uptake) and RBC turnover (lifespan). The theory behind the kinetic model suggests that the balance, represented by K, controls the relationship between steady-state glucose and HbA1c. Therefore, K and the glycation gap, represented by HGI, should show a positive correlation. This study indeed demonstrates a positive and significant correlation between K and HGI, providing additional supportive evidence to the kinetic model.
The direct measurements of these two parameters would be helpful to further validate cHbA1c. However, accurate calculation of these measures requires complex experiments involving data on hemoglobin glycation rate and cross-membrane RBC glucose uptake, 19,26 which are impossible to obtain in population studies. RBC lifespan measurement usually requires RBC labeling and repeating blood tests in multiple months. 18 Reticulocyte count reflects the rate of RBC regeneration, and it may be helpful to validate the method. However, reticulocyte count is also under the influence of RBC maturity rate and, therefore, cannot be indiscriminately used as a precise index of red cell production. 27
In this study, the kinetic model predicts HbA1c with significantly better accuracy than GMI and eHbA1c methods, with about half or less in absolute deviation. Moreover, the kinetic model method has the advantages of avoiding average bias and having a regression slope near unity (Table 2), thereby further avoiding bias across the wide ranges of HbA1c and glucose levels.
This study has several strengths. First, it has a large number of subjects from 13 clinics in Germany, using different methods to measure laboratory HbA1c, thus ensuring generalizability of the results, at least in the pediatric/young adult mostly German Caucasian population. Second, this was a prospective study conducted under real-life conditions, thereby adding credibility for the use of the model in day-to-day clinical practice. Third, the data clearly show the limitations of employing eHbA1c as a predictor of laboratory HbA1c and alleviates patient fear associated with CGM inaccuracies when discrepancies are found between eHbA1c and laboratory HbA1c.
However, there are limitations to this study that should be acknowledged. First, only T1D individuals were studied and, therefore, the accuracy in the younger T2D cohort remains to be demonstrated. However, given the model was originally constructed using both T1D and T2D patients, it is highly unlikely it will be less robust in the non-T1D population. A second criticism is related to studying only German patients and although up to a fifth of patients were from other ethnic backgrounds, it is not entirely clear whether the results apply to different ethnic groups, an area that will require further investigation. Third, glucose readings were collected from only one CGM device and, therefore, further study is warranted using other CGM devices to ensure the model is not device limited.
Conclusion
The kinetic model of HbA1c offers mechanistic insight into the relationship between glucose levels and glycated hemoglobin. We validated the superior performance of this model using T1D from a pediatric/young adult population of the DPV registry and compared results with existing methods of eHbA1c and GMI. 7 Under real-life conditions, our model shows closer relationships between cHbA1c and laboratory HbA1c compared with eHbA1c and GMI. These data indicate that cHbA1c can be used as an effective and safe replacement for laboratory HbA1c, at least on an intermittent basis, which will have implications for patients, health care professionals, and funders.
Footnotes
Authors' Contributions
B.K., J.M.G., R.W.H., and S.H. collected and preprocessed the data. Y.X. developed the cHbA1c computation program. J.M.G. and Y.X. performed calculations and data analysis. R.W.H. and T.C.D. managed and supervised the project. R.A.A., T.C.D., and Y.X. wrote the article. All authors were involved in the design of the research, analysis, and interpretation of the data. All authors worked collaboratively to review and prepare the final article.
Acknowledgments
The data used in this article came from the following medical centers: Darmstadt Kinderklinik Prinz. Margaret, Dessau Kinderklinik, Göttingen Uni-Kinderklinik, Hannover Kinderklinik MHH, Hannover Kinderklinik auf der Bult, Hamburg Kinderklinik Wilhelmstift, Halle Uni-Kinderklinik, Hildesheim Kinderarztpraxis, Leipzig Uni-Kinderklinik, Neuburg Kinderklinik, Schwerin Kinderklinik, Stolberg Kinderklinik, and Paderborn St. Vincenz Kinderklinik. The authors gratefully thank E. Bollow, K. Fink, R. Ranz, and A. Hungele for data management and development of DPV EHR.
Author Disclosure Statement
T.C.D. and Y.X. are employees of Abbott Diabetes Care. R.A.A. received other research support and Honoraria from Abbott Diabetes Care.
Funding Information
This study was funded by Abbott Diabetes Care and DPV registry.
Supplementary Material
Supplementary Data
References
Supplementary Material
Please find the following supplemental material available below.
For Open Access articles published under a Creative Commons License, all supplemental material carries the same license as the article it is associated with.
For non-Open Access articles published, all supplemental material carries a non-exclusive license, and permission requests for re-use of supplemental material or any part of supplemental material shall be sent directly to the copyright owner as specified in the copyright notice associated with the article.