
Abstract
Background:
The E
Methods:
VIVID participants were adults who had insulin requirements of >200 but ≤600 U/day and A1C 7.5% to 12%. Participants performed masked CGM for seven consecutive days on each of three occasions: before weeks 0 (baseline), 14, and 26. The primary objective was to compare GV between CSII and MDI groups, based on change from baseline of within-day standard deviation (SDw) of CGM glucose.
Results:
Of 54 participants enrolled, 41 with evaluable data were analyzed (17 and 24 in CSII and MDI groups, respectively). The CSII group had a significantly greater reduction from baseline in mean SDw of glucose (45.0 to 38.2 mg/dL [−8.1 mg/dL]) compared with the MDI group (47.0 to 45.8 [−0.4 mg/dL]; P = 0.047). TIR 70–180 mg/dL glucose increased significantly from baseline in the CSII group only, from 59.8% to 73.1% (change +12.9%, P < 0.05), but was not significantly different between groups. There were no significant between-group differences in the endpoint mean glucose or A1C.
Conclusions:
In the VIVID CGM substudy of U-500R in people with T2D requiring high doses of insulin, participants using CSII significantly reduced GV compared with MDI. CSII also significantly increased TIR with no difference between groups.
Introduction
In people with type 2 diabetes (T2D) who remain poorly controlled on high doses of insulin, U-500R insulin has been shown to effectively lower A1C.
1
The E
GV refers to the fluctuations in daily blood glucose levels. 3 GV has been associated with the risk of adverse outcomes, including vascular complications and retinopathy, in people with diabetes. 3 –5 Both hyperglycemia and hypoglycemia may contribute to the deleterious effects of GV through processes such as inflammation and oxidative stress. 6 –8 GV increases with longer duration of T2D, which is believed to be due to insulin resistance and progressive insulin deficiency. 3,9,10 Increased GV is also a predictor of hypoglycemia, both in prospective studies and in randomized clinical trials, in subjects with type 1 or T2D. 11 –13
TIR generally refers to the percent of time spent in the target glucose range of 70–180 mg/dL, 14 and recent consensus statements recommend a goal of >70% TIR for people with diabetes. 15 CGM also allows determination of percent time above and below the target range, that is, in hyper- and hypoglycemia. Together, these data add valuable information for the assessment of glycemic control.
In this VIVID CGM substudy, we analyzed the CGM data to determine GV and time in glucose ranges and compared change from baseline in these measures by treatment group to better understand the effect of U-500R delivery method on these outcome measures.
Methods
Patients and study design
The VIVID study (NCT02561078) was a randomized, multicenter, 26-week, two-arm study comparing two methods of U-500R insulin delivery, CSII with a specifically designed U-500 insulin pump (OmniPod® U-500 Insulin Management System, Insulet Corporation, Acton, MA) and MDI. 2 Participants were adults with T2D who required high doses of insulin (>200 but ≤600 U/day) and had inadequate glucose control (A1C 7.5% to 12%). Group A comprised a subset of participants in VIVID who were not taking glucagon-like peptide-1 receptor agonists (GLP-1 RA) or sodium/glucose cotransporter 2 inhibitors (SGLT2i). Those using GLP-1 RA or SGLT2i comprised Group B. Group A plus Group B combined constitutes the all randomized population. Group A was analyzed both separately and together with all randomized participants.
After randomization to the CSII or MDI treatment arms, participants in the VIVID study underwent a 2-week transition to U-500R by MDI, followed by 24 weeks on the treatment to which they were randomized (Supplementary Fig. S1). During the study, titrations were based on an insulin algorithm with a premeal and bedtime glucose target range of 80–140 mg/dL. Complete details on dosing and other aspects of the study have been previously reported. 2
This exploratory substudy of VIVID sought to enroll 27 participants from each study arm (CSII and MDI) who were willing to wear a masked (also referred to as “blinded” or “professional”) CGM device (Dexcom G4 Platinum) for three 7-day periods at baseline, midpoint, and end of the study (Supplementary Fig. S1). Participants from sites that had CGM experience and agreed to participate were allowed to volunteer (and were not randomly selected), based upon their willingness to wear the CGM device in addition to continuing their CSII or MDI modality of administration of insulin U-500R. All participants were required to give additional informed consent before any substudy-specific procedures. The protocol was approved by the local ethics review boards, and the study was conducted according to the International Conference on Harmonization Good Clinical Practice guidelines and the Declaration of Helsinki.
Objectives/procedures
The primary objective of this exploratory analysis was to compare between the CSII and MDI groups the change from baseline to end of treatment of within-day glucose variability (GV), as measured by the mean within-day standard deviation (SDw) of the interstitial glucose measurements (CGM glucose). Other study objectives included comparing between groups the changes from baseline in percentage of time in glucose ranges: <50 mg/dL, 70 to 120 mg/dL, >180 mg/dL, and <50 mg/dL during the nocturnal period between midnight and 6 am. As post hoc analyses, we modified the ranges to align with the more currently relevant ranges of <54 mg/dL, 54 to <70 mg/dL, 70 to 180 mg/dL, and <54 mg/dL during the nocturnal period between midnight and 6 am. 15
Participants were trained on the use of the Dexcom G4 Platinum CGM device and the requirements for CGM, including the need to complete a mealtime CGM diary. Trained clinical site staff inserted CGM devices at the start of each 7-day CGM session. CGM sessions were from week −1 to 0, week 13 to 14, and week 25 to 26. Sensors were calibrated according to the to the Dexcom user guide every ∼12 h using the premeal blood glucose. Participants were asked to perform 4-point self-monitored blood glucose (SMBG) profiles, as per the VIVID study protocol, while wearing the CGM device. The CGM results were masked to both patients and clinical site staff during the study. Analysis of the data was done by an independent laboratory (Phase V Technologies, Inc., Wellesley Hills, MA).
Statistical analyses
The data are presented for the analyzable population. The criteria for inclusion of a participant into the analysis were to have at least 1 day (out of 7) with at least 75% of CGM readings and no gaps greater than 2 h at baseline and at least 1 day (out of 7) post baseline. Baseline characteristics were summarized by treatment arm. Means were compared using a two-sample t-test. Proportions were analyzed using the Fisher's exact test, if computationally feasible; otherwise a chi-square test was used.
The primary endpoint for GV was within-day glucose variability as measured by mean daily SDw, calculated as the mean of the SD of CGM glucose values collected during each 24-h period, averaged across all days and subjects within each 7-day CGM session. A mixed-model repeated measures (MMRM) was used to analyze the continuous dependent variables. The model included fixed effects such as treatment group, weeks on treatment (considered categorical variable), the interaction between treatment and weeks, and the stratification factors (U-500R at entry vs. other insulins, entry hemoglobin A1C ≥8.5% or <8.5%); the correlation between GV measures from the same patient was accounted for in the MMRM. The corresponding baseline values and use of GLP-1 RA or SGLT2i were included as covariates.
Several other measures of variability of the interstitial glucose measurements were analyzed as sensitivity analyses; for example, mean amplitude of glycemic excursion (MAGE) 16,17 and continuous overall net glycemic action (CONGA n , for n = 1 and 2 h). 18 MAGE has three components: MAGE+ refers to upward excursions; MAGE− refers to downward excursions; and MAGEavg refers to both upward and downward excursions. Coefficient of variation (CV, %) was analyzed as a post hoc variable.
Results
Participants
A subgroup of 54 participants (24 and 30 from the CSII and MDI groups, respectively) from the VIVID study were enrolled in the CGM substudy at selected sites. Of these, 41 provided sufficient data to be included in the analysis (17 and 24 in CSII and MDI groups, respectively). Baseline demographics and clinical characteristics, and selected outcome data, of the analyzable CGM cohort and the entire VIVID cohort are shown in Table 1. The CSII and MDI groups of the CGM cohort were similar in baseline characteristics, with the exception of a higher baseline fasting plasma glucose in the MDI group and more women in the CSII group.
Demographics, Baseline Characteristics, and Outcome Data for the Continuous Glucose Monitoring Cohort and the E
Data are mean ± SD or n (%).
CSII, continuous subcutaneous insulin infusion; CGM, continuous glucose monitoring; DPP-4, dipeptidyl peptidase-4 inhibitor; FPG, fasting plasma glucose; GLP-1 RA, glucagon-like peptide-1 receptor agonist; MDI, multiple daily injection; SD, standard deviation; SGLT2i, sodium glucose transporter 2 inhibitor; TDD, total daily dose of insulin; VIVID, E
In the CGM cohort, the change from baseline in A1C was similar in magnitude and direction to the change seen in the whole VIVID population, although there was no between group difference at week 26 (Table 1).
Glycemic variability
Within-day SD of CGM glucose decreased significantly more from baseline to 26 weeks in the CSII group compared with the MDI group (P = 0.047) (Table 2 and Fig. 1). Three other measures of GV—MAGE−, CONGA 1 , and CONGA 2 —were significantly decreased from baseline to 26 weeks in the CSII group but not in the MDI group; the change from baseline was significantly different between groups. MAGE+ and MAGEavg were not significantly different between groups. Within-day CV of CGM glucose increased significantly from baseline in the MDI group, but not in the CSII group, and the change from baseline was significantly different between groups. The between-group differences were evident when first measured at week 14.
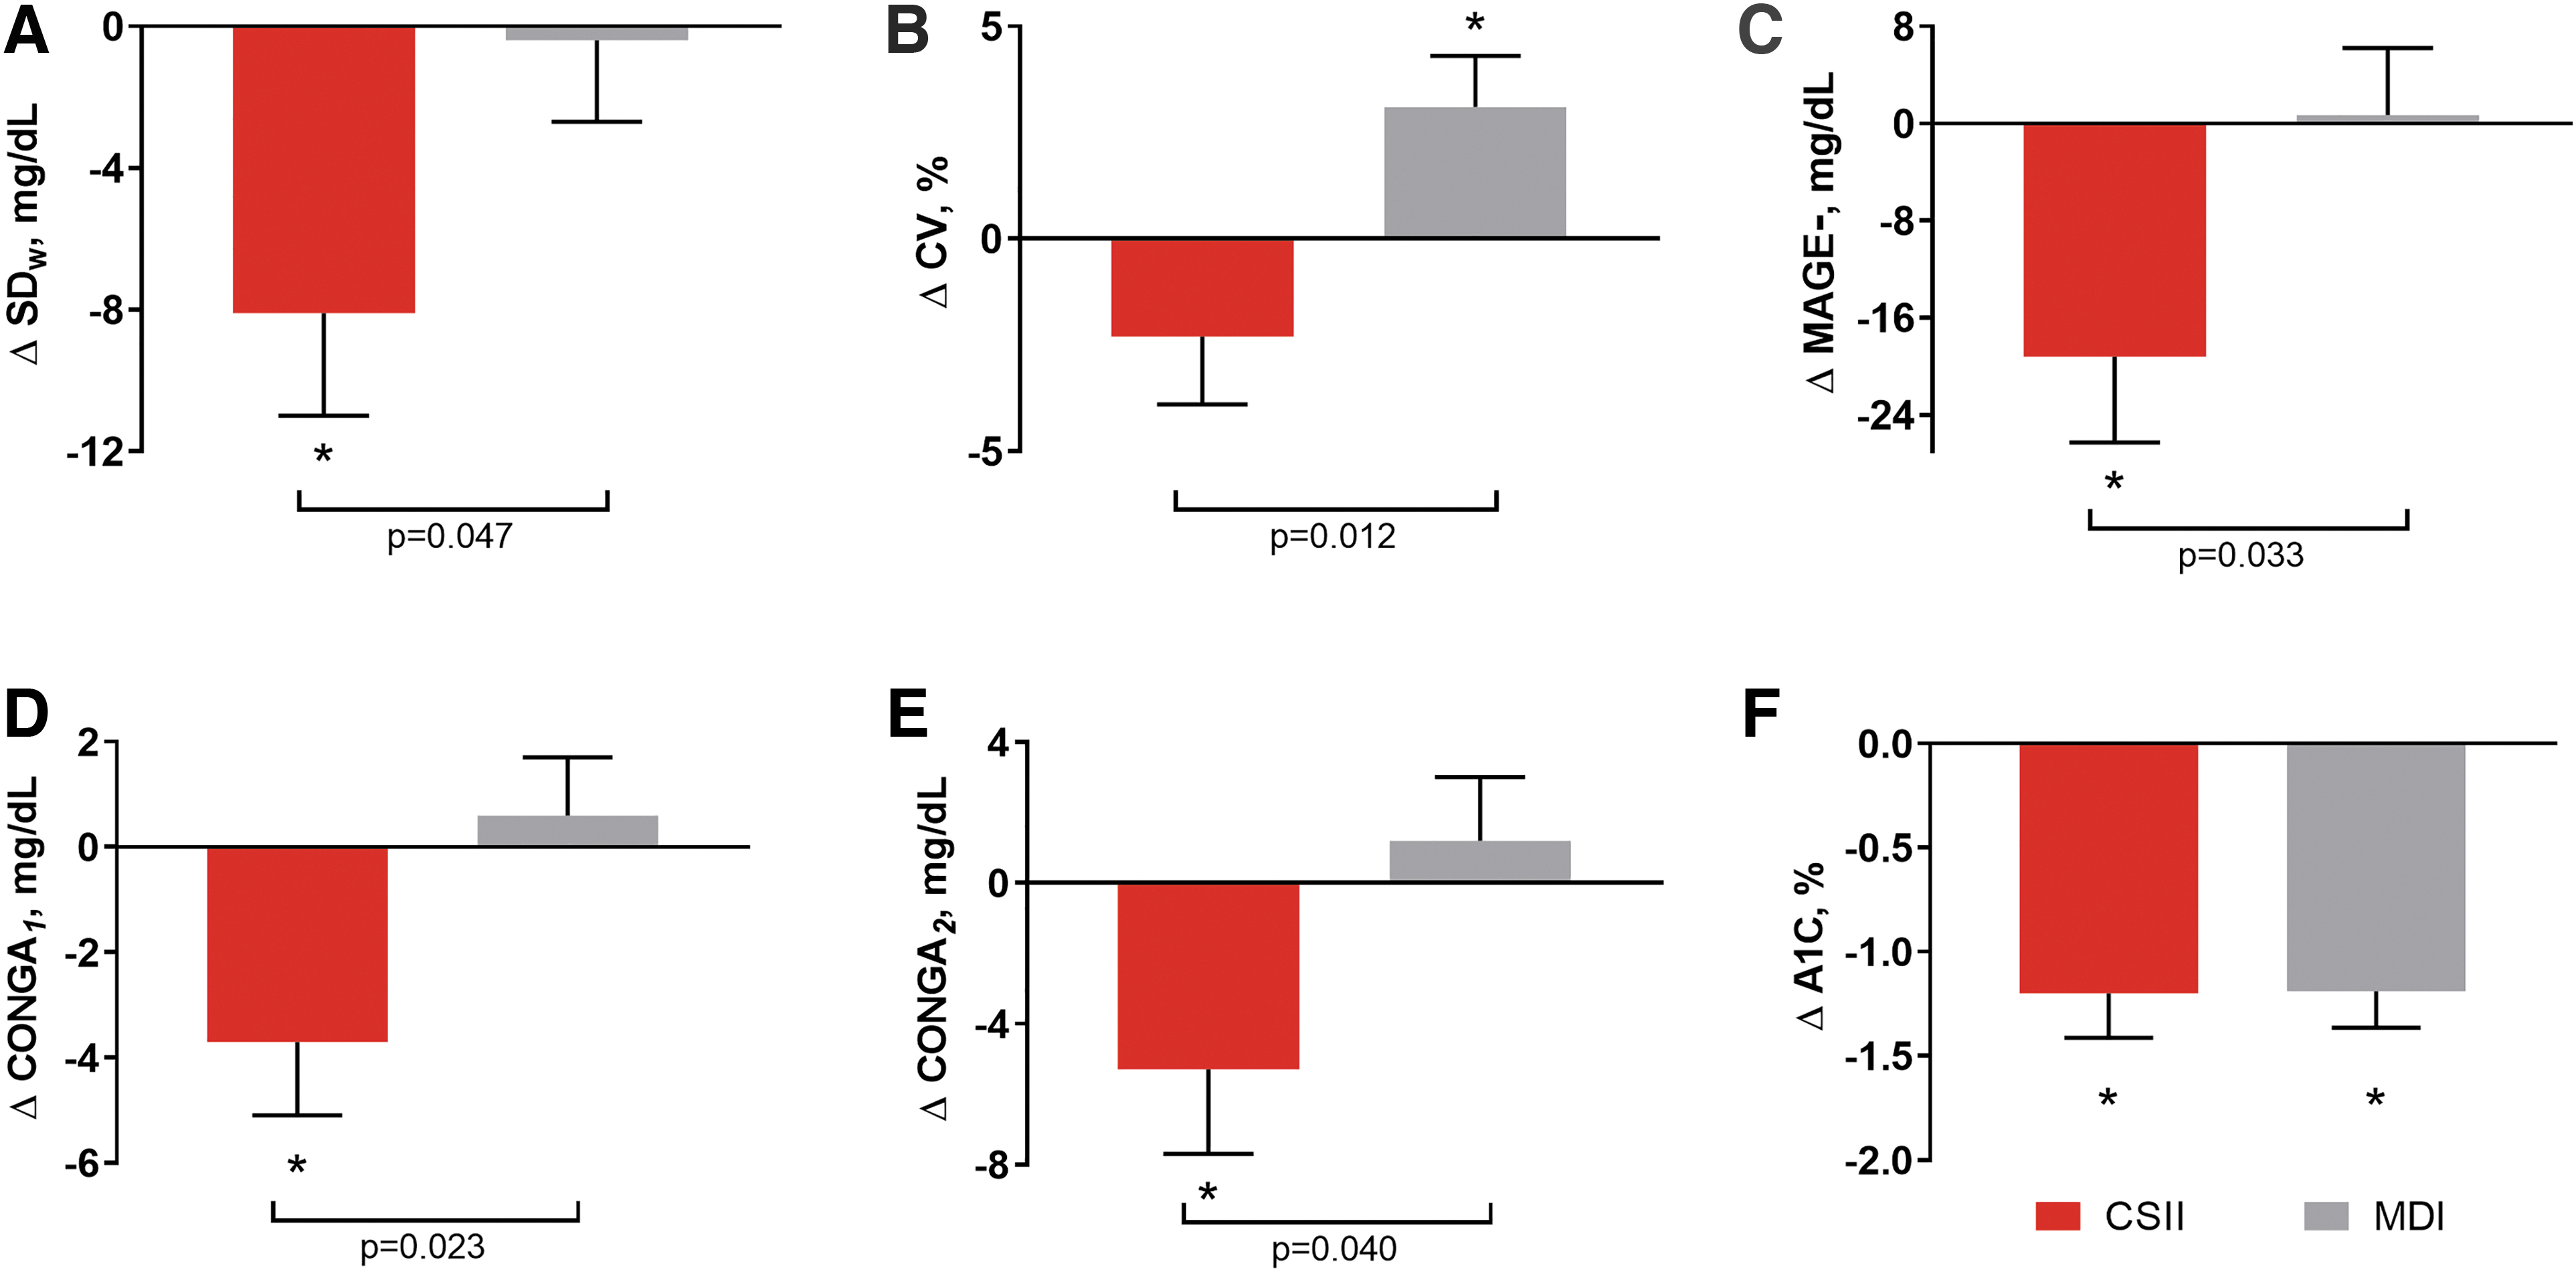
GV Results—change from baseline to week 26. Changes from baseline in glucose variability measures (baseline to week 26).
Summary of Glycemic Variability Measures
Data are LS mean ± SE.
P-value for difference between groups.
P < 0.05 for within-group change from baseline.
Δ Baseline = change from baseline.
CONGA, continuous overall net glycemic action for 1- and 2-h periods; SDw = within-day standard deviation; CV, within-day coefficient of variation; MAGE, mean amplitude of glycemic excursions, + (upward excursions), − (downward excursions), avg (both upward and downward excursions).
Percent TIR
Mean glucose decreased from baseline in both groups (P = non-significant) (Table 3). Percent TIR 70–180 mg/dL increased significantly from baseline to 26 weeks in the CSII group, but not in the MDI group. The percent TIR increase of 12.9% (to 73%) in the CSII group corresponds to an increase of 3.1 h per day in the target range (Fig. 2). Percent time >180 mg/dL decreased significantly from baseline by a similar amount in the CSII group (−13.1%, or 3.1 h per day, P < 0.05), while the change was not significant in the MDI group. The between-group differences in changes from baseline to week 26 in TIR for the several glucose ranges examined showed modest improvement but were not statistically significant.
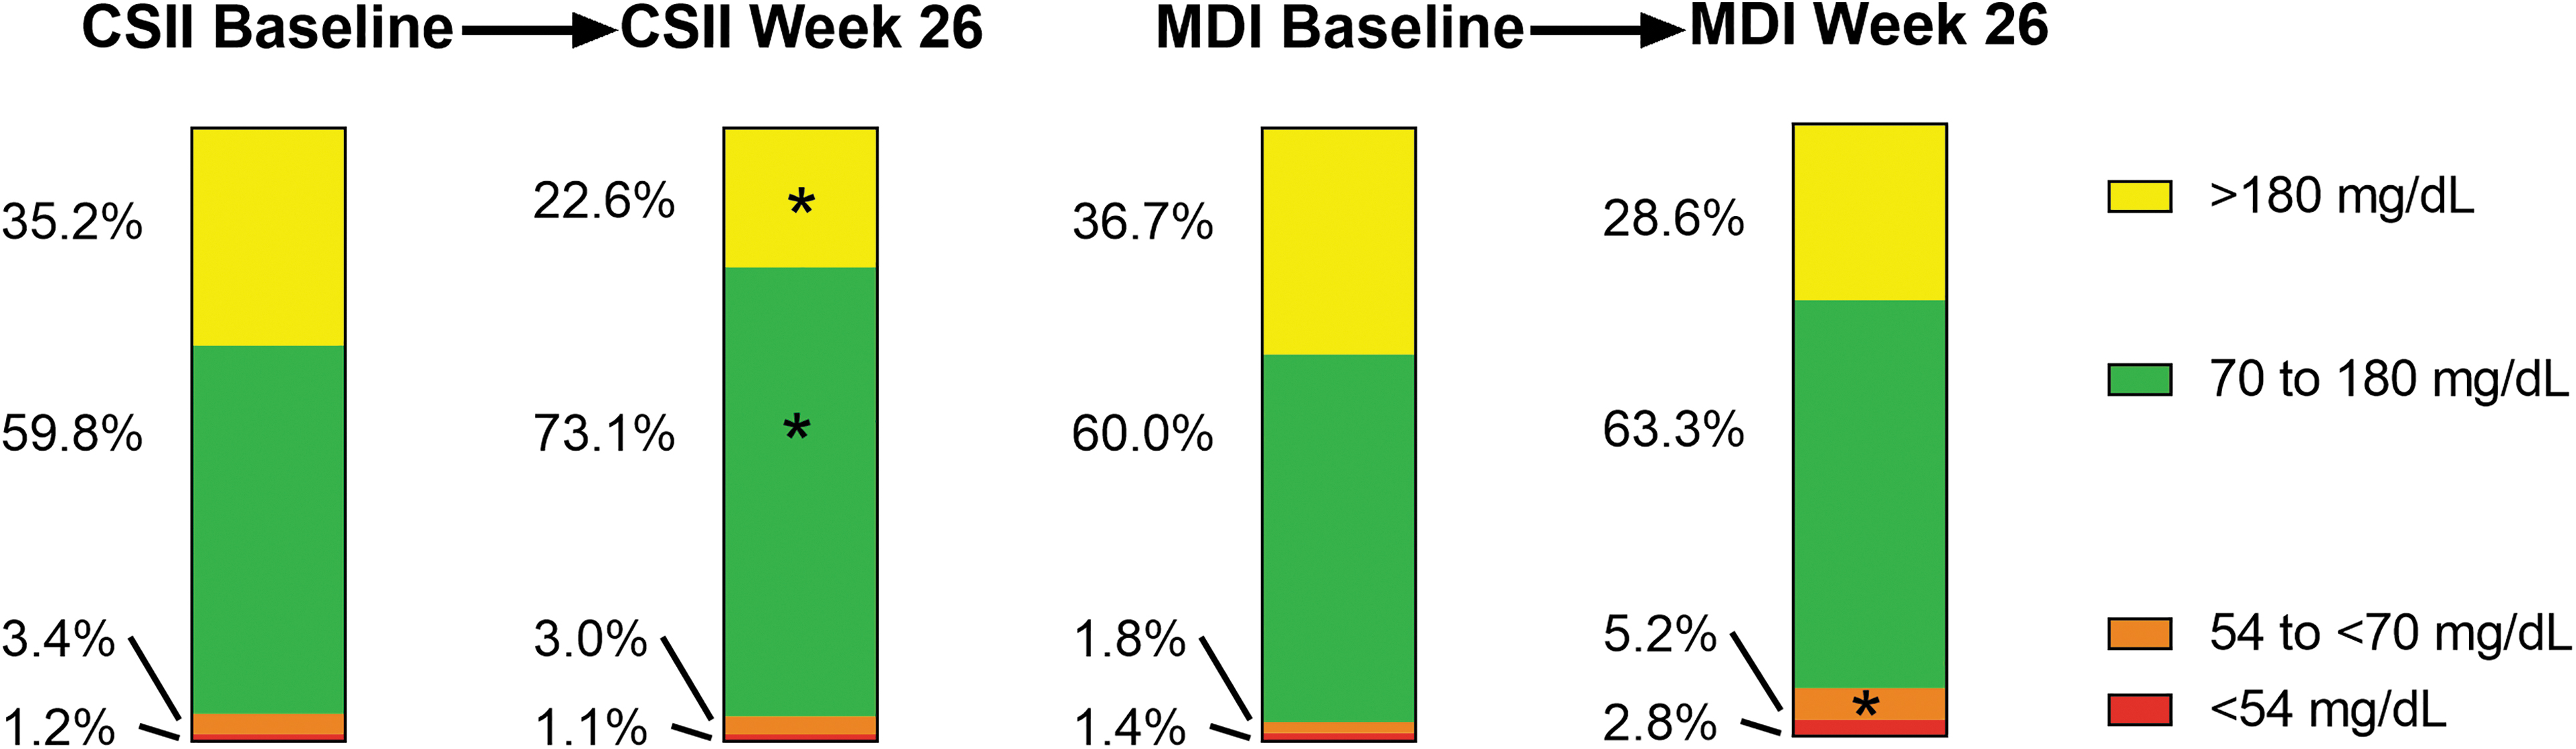
Percent time in glucose ranges. Percent time in ranges of CGM glucose over 24 h. CSII group, n = 17 at baseline; MDI group, n = 24 at baseline. *Significant within-group change from baseline to week 26. There were no significant between-group differences at week 26. CSII, continuous subcutaneous insulin infusion; MDI, multiple daily injection.
Summary of % Time in Glucose Ranges
Data are % time (out of 24 h) except for nocturnal (LS mean ± SE).
P-value for difference between groups.
P < 0.05 for within-group change from baseline.
Nocturnal is % time from midnight to 6 am.
Δ Baseline = change from baseline.
Hypoglycemia, or percent time 54 to <70 mg/dL (Level 1) or <54 mg/dL (Level 2), 19 did not change significantly from baseline to endpoint in the CSII group. Level 1 hypoglycemia increased significantly in the MDI group, but the change from baseline to endpoint was not significantly different between groups. All the between-group differences for time in glucose ranges were evident at week 14 (Table 3).
Nocturnal percent time in Level 2 hypoglycemia (<54 mg/dL) did not change significantly from baseline to end of trial in either group, with no difference between groups. This is in contrast to the results from the entire VIVID study, where the rate of nocturnal hypoglycemia <54 mg/dL, but not the incidence, was higher with CSII compared with MDI (8.2 vs. 5.4 events/year, P = 0.008). 2
Group A results
The results for Group A participants (those not taking SGLT2i or GLP-1 RA) were numerically similar to the results for the entire CGM cohort, although the small sample size may have reduced the power to find statistical significance (Supplementary Table S1).
Discussion
The VIVID study showed that U-500R, when delivered by either CSII or MDI, improved glycemic control in people with T2D requiring high doses of insulin, with greater A1C lowering and a lower insulin dosage in the CSII group. 2 In the subset of VIVID participants who enrolled in this CGM substudy, we report additional beneficial glycemic effects beyond A1C for the CSII group. This novel substudy is the first randomized-controlled trial comparing pump with MDI for U-500R insulin with masked CGM.
GV measured as SD of CGM glucose showed a significant reduction of 8.1 mg/dL from baseline in the CSII group and was significantly lower compared with the MDI group. The difference was evident by the midpoint of the study at 14 weeks. In addition, while mean glucose and A1C decreased similarly in both groups, percentage of TIR 70–180 mg/dL increased significantly from baseline in the CSII group only, equivalent to 3.1 h per day. These results underscore the glycemic benefits of U-500R delivered by CSII as a therapeutic option in this population as seen in the VIVID study. 2
Glycemic variability
In this exploratory analysis, multiple GV measures, although related to each other and to the SD of CGM glucose, 20,21 were consistent in demonstrating reduced GV in the CSII group compared with the MDI group. Change from baseline to 26 weeks in SDw, MAGE−, CONGA 1 , and CONGA 2 decreased significantly from baseline in the CSII group. Percent CV was reduced by 2.3% in the CSII group, while it rose significantly by 3.1% in the MDI group, reflecting the fact that mean glucose (in the denominator of the calculation: %CV = 100*SD/mean glucose) decreased similarly in both groups, while SD improved only in the CSII group. Despite these differences, the recommendation that %CV from CGM be <36% for a stable GV 14,22 was met by both CSII and MDI groups.
Some noninsulin diabetes treatments such as SGLT2i and GLP-1 RA have been demonstrated to reduce GV in people with T2D. 23 When we examined Group A participants (those not taking SGLT2i or GLP-1 RA) separately, the direction of the results and the overall conclusions were not different from the entire CGM cohort. However, the smaller sample size may have impacted statistical significance testing (Supplementary Table S1).
Time in range
In the CSII group, the increase in percent TIR 70–180 mg/dL, which amounted to 3.1 h/day or 21.7 h/week, came with no significant change from baseline in total daily dose of insulin. The increased TIR in this group came from a decreased time in hyperglycemia, as time in hypoglycemia did not change significantly. This also indicates that the measured improvement in SD was due to fewer hyperglycemic excursions and may explain the greater decrease in A1C seen with CSII in the VIVID study.
An association between TIR and A1C has been reported previously. Vigersky and McMahon reviewed studies in type 1 and type 2 populations that reported paired A1C and TIR metrics (n = 1137) and found that for every absolute 10% change in TIR, there was a −0.8% change in A1C. 24 Beck et al. analyzed data from 4 large studies (n = 545) in type 1 diabetes and found that a 10% increase in TIR was associated with an approximated −0.6% change in A1C. 25
In the MDI group, percent TIR 70–180 mg/dL increased by a nominal 3% over 26 weeks, with a nominal 8% decrease in percent time >180 mg/dL. Percent time in Level 1 hypoglycemia did increase significantly, without a significant change in Level 2 hypoglycemia. This may reflect that participants responded to Level 1 events in a way that prevented some Level 2 events.
Increased TIR has been shown to be associated with reduced risk of diabetes complications 24 ; for example, a decreased risk of diabetic retinopathy with increased TIR has been demonstrated in people with T2D. 26 The goals of the recent consensus statement recommending greater than 70% TIR 70–180 mg/dL and less than 4% time in hypoglycemia for people with either type 1 or 2 diabetes 15 was achieved with U-500R insulin delivered by CSII in this study.
Other pump studies using CGM
Lane et al. evaluated U-500R administered using CSII for 1 year in 21 high insulin dose-requiring people with T2D with mean A1C 8.6%. 27 A U-100 pump was the only option at the time, and the treatment was monitored with CGM at several points during the study. At the end of 12 months, A1C was reduced by 1.23%, and TIR improved from ∼40% to nearly ∼70% by the end of the study, while time in the hyperglycemia range decreased to nearly 27%. There was no significant increase in hypoglycemia, but GV was not calculated. 27 Our present results show a similar increase in TIR to 73% with CSII, with a marked reduction in hyperglycemia and no increase in hypoglycemia.
Use of CSII was shown to increase TIR to recommended levels in several studies in people with T2D who were not well controlled. In a randomized crossover study, Berthe et al. tested CSII versus MDI, both with CGM, in 17 people with mean A1C of 9.0%. 28 Duration of within-target CGM glucose values (60–180 mg/dL) increased from 44% with standard therapy, to 54% with intensified MDI therapy, to 77% with pump therapy, with no change in hypoglycemic excursions. Edelman et al. studied 56 people who initiated insulin pump therapy with CGM for 16 weeks. 29 Participants increased TIR 70–180 mg/dL from 59% to 71%, with a significant decrease in hyperglycemia but with an increase in hypoglycemia. The OpT2mise study compared the effects of CSII (n = 168) and MDI (n = 163) insulin delivery methods (with insulin analogues) on glucose profiles in people with T2D with mean A1C 9%. 30 CGM was collected for 6-day periods before and 6 months after randomization. At 6 months, the CSII group significantly increased TIR by 12%, decreased percent time >180 mg/dL by 12%, with no significant difference in time <70 mg/dL. There were no differences in GV (SD, MAGE, or CONGA) between the groups in the OpT2mise study.
CSII with U-100 rapid-acting insulin analogues was shown to lower the fluctuation in SD of mean glucose observed using CGM or SMBG in people with T2D, 31 but there are very limited data available on GV measurements using CGM in this population when treated with insulin. 32,33 Our data provide support for use of insulin pumps with U-500R to reduce the magnitude of GV.
Clinical implications of improving GV
Hypoglycemia and glucose variability are considered to be two of the major challenges for optimization of glycemic control in diabetes. 34,35 Improvement in A1C may not always translate into improved clinical outcomes in people with T2D. 3 Thus, glycemic metrics beyond A1C may be used to predict the risk of micro- and macrovascular complications. 36 GV is associated with an increased risk of adverse cardiovascular outcomes. 37 People with more advanced diabetic retinopathy spend significantly less TIR and have higher measures of GV. 26 However, the association of varying magnitudes of GV with diabetes-related outcomes is still unclear. Further clinical trials that focus on the mechanisms of GV will be needed to evaluate the extent to which reduction in GV can be regarded as an important therapeutic goal for management of patients with T2D. 38
Strengths and limitations
A strength of the exploratory CGM substudy is that because the CGM results were masked to both participants and investigators, the observed changes in TIR and GV in the CSII group can be attributed solely to the method of insulin delivery, and were not due to the recognized effects of unmasked CGM on glycemic outcomes. 39 One of the limitations of this study is the small number of analyzable subjects. Also, CGM data were collected for 7 days; expert consensus guidelines released after the study was completed have proposed 2–4 weeks of data collection for clinical practice, 14,15 as increasing the duration of sampling will reduce the standard error of GV on an individual patient level. In the present VIVID substudy, we are examining the error in the mean of the estimate from multiple individuals (17 in the case of CSII and 24 in the case of MDI administration of U-500R). When comparing the two groups of subjects, the standard error is reduced as the number of subjects increases. When comparing two groups of subjects, the between-subject variability predominates as it is usually much larger than the within-subject variability. Finally, only participants from sites with CGM experience were allowed to volunteer (and were not randomly selected), based upon their willingness to wear the CGM device in addition to continuing their CSII or MDI modality of administration of insulin U-500R.
Conclusions
This CGM substudy of the VIVID study showed that in high insulin dose-requiring people with T2D using U-500R, delivery by CSII resulted in a reduction from baseline of GV (SD, MAGE−, and CONGA 1, CONGA 2 ) and an increase in TIR, without increasing time in hypoglycemia. However, in this small study, we did not observe a statistically significant difference between treatment groups in TIR, A1C, or mean glucose. These improvements in GV metrics support and expand on the glycemic improvements observed in the VIVID study, demonstrating that CSII is a viable and beneficial option for delivery of U-500R in this population.
Footnotes
Acknowledgments
The authors thank the participants, caregivers, and investigators.
Author Disclosure Statement
D.S., L.F., K.E., L.I., and J.J. are employees and shareholders of Eli Lilly and Company. T.L. is an employee and shareholder of Insulet Corp. T.B. serves on the Speaker's bureau for Lilly, Sanofi, BI, Janssen, AstraZeneca, and Amgen, serves on the advisory board for Intarcia, and receives clinical research support from Lilly, Sanofi, Novo Nordisk, AstraZeneca, and Mylan. W.L. serves on the speakers' bureau for Novo Nordisk, Dexcom, Insulet, and Xeris and has served on the advisory boards for Novo Nordisk, Insulet, and Xeris; and has received research support from Novo Nordisk. D.R. serves as a consultant for Lilly and Better Therapeutics.
Funding Information
This study was funded by Eli Lilly and Company and Insulet, Inc., and Caryl J. Antalis, PhD, Eli Lilly and Company, provided writing and editorial assistance. Yun Chen provided review of the statistical methods and editorial assistance. Data from this study were presented, in part, at the American Association of Clinical Endocrinologists 28th Scientific Sessions, April 25–29, 2019, and at the American Association for Diabetes Educators Annual Conference, August 9–12, 2019.
Supplementary Material
Supplementary Figure S1
Supplementary Table S1
References
Supplementary Material
Please find the following supplemental material available below.
For Open Access articles published under a Creative Commons License, all supplemental material carries the same license as the article it is associated with.
For non-Open Access articles published, all supplemental material carries a non-exclusive license, and permission requests for re-use of supplemental material or any part of supplemental material shall be sent directly to the copyright owner as specified in the copyright notice associated with the article.