
Abstract
Objectives:
To study the effect of baseline glucose variability (GV) on the time to stability and interweek variability (IWV) of continuous glucose monitoring (CGM)-derived glycemic indices.
Materials and Methods:
Anonymized CGM data (median duration 32 weeks, ≥70% data coverage) of 85 adults with type 1 diabetes; age (41 ± 12 years), 66.3% women, HbA1c (7.5% ± 1.2%, 58 mmol/mol) were analyzed. We evaluated the time to stability, that is, the minimum duration of data that provided a close (r 2 ≥ 0.9) correlation with data taken across the whole sampling period and IWV. We also evaluated the impact of baseline variability on the time to stability.
Results:
For the whole data set, all indices achieved stability (r 2 ≥ 0.9) by 9 weeks (range 5–9). Time to stability progressively increased from the lowest quartile to the highest quartile of baseline coefficient of variation (CV). Time above range (TAR) and time below range (TBR) had higher IWV than time in range (TIR) (%CVIWV: TIR-16%, TAR-31%, TBR-62%).
Conclusion:
Baseline GV and IWV of indices affect the time to stability of glycemic indices. We recommend a minimum of 9 weeks of data to represent long-term CGM data.
Introduction
Continuous glucose monitoring (CGM) is increasingly used for the care of type 1 diabetes worldwide. 1 Recent data of people with type 1 diabetes from Europe show that a third are using CGM or flash glucose monitoring, and terms such as time in range (TIR), glucose variability (GV), and time in hypoglycemia are entering the clinical lexicon. 2,3 CGM is a powerful tool that provides a ready assessment of glucose fluctuations, that often infer a mismatch between insulin requirements and insulin delivery at any given time.
It is, however, a common clinical experience that CGM profiles demonstrate not only within-day variability but also vary between days and can often be very different between weeks. In this scenario, given the frequent use of CGM-derived measures such as TIR, time below range (TBR), time above range (TAR), and coefficient of variation (CV) for both clinical and academic purposes, 3 –5 it is very important to assess the minimum CGM duration that provides a stable representation of an individual's glycemic signature; “time to stability.”
A previous analysis of shorter duration CGM data from clinical trials suggested that 2 weeks of data provided a reasonable (r = 0.7) correlation with the overall glycemic picture. 6 However, with the availability of longer duration of CGM data, and many people with type 1 diabetes using CGM uninterrupted, we felt the need to reassess this relationship. We aimed to study the relationship between CGM-derived glycemic indices from incremental (1 week) sampling durations to long-duration CGM data. We hypothesized that baseline GV may have an impact on the time to stability of glycemic indices.
Materials and Methods
We obtained anonymized CGM data from people with type 1 diabetes attending the diabetes clinic at King's College Hospital, London. We included people with T1D and a CGM duration of ≥6 weeks with >70% data coverage for the duration of wear and excluded children (age <18 years). There were no other exclusion criteria for representativeness of the sample.
We calculated TIR (3.9–10 mmol/L), TAR (>10 and >13.9 mmol/L), TBR (<3.9 and <3 mmol/L), mean glucose, %CV, standard deviation (SD), interquartile range (IQR), mean amplitude of glycemic excursion (MAGE), and continuous overall net glycemic action (CONGA1). CONGA1 and MAGE were calculated using the EasyGV ver 9.0R2. 7 These variables were calculated for the entire duration of CGM data available and for incremental 1-week duration from the start of available data.
We then analyzed the time to stability for each variable, defined as the minimum duration of data giving a coefficient of determination, r 2, ≥0.90, to the whole CGM data. We also stratified the cohort based on quartiles of week-1%CV. We calculated the interweek variability (IWV) of each CGM index as the coefficient of variation (%CVIWV). Microsoft Excel (Office 365) and SPSS version 25 were used for data extraction, reorganization, and statistical analysis.
Results
Eighty-five people with type 1 diabetes met the inclusion criteria (52 using FreeStyle Libre and 33 using Dexcom G5/6). Age (41 ± 12 years), 66.3% women, HbA1c (7.5% ± 1.2%, 58 mmol/mol). The median duration of CGM data was 32 weeks (IQR: 18–43 weeks). Fifty-two (61%) had continuous data for ≥24 weeks.
Effect of incremental sampling duration
The correlation between glycemic indices derived from incremental durations of sampling and the whole CGM data increased with longer durations of sampling (Figs. 1 and 2). The time to stability in weeks were 6 for mean glucose, SD, TIR, and TAR >10, MAGE and IQR; 7 for %CV and TAR >13.9, 5 for TBR <3 and CONGA1 and 9 for TBR <3.9. However, the monthly mean value for each of these indices for the whole group did not change significantly from month 1 to 6 (Supplementary Table S1).
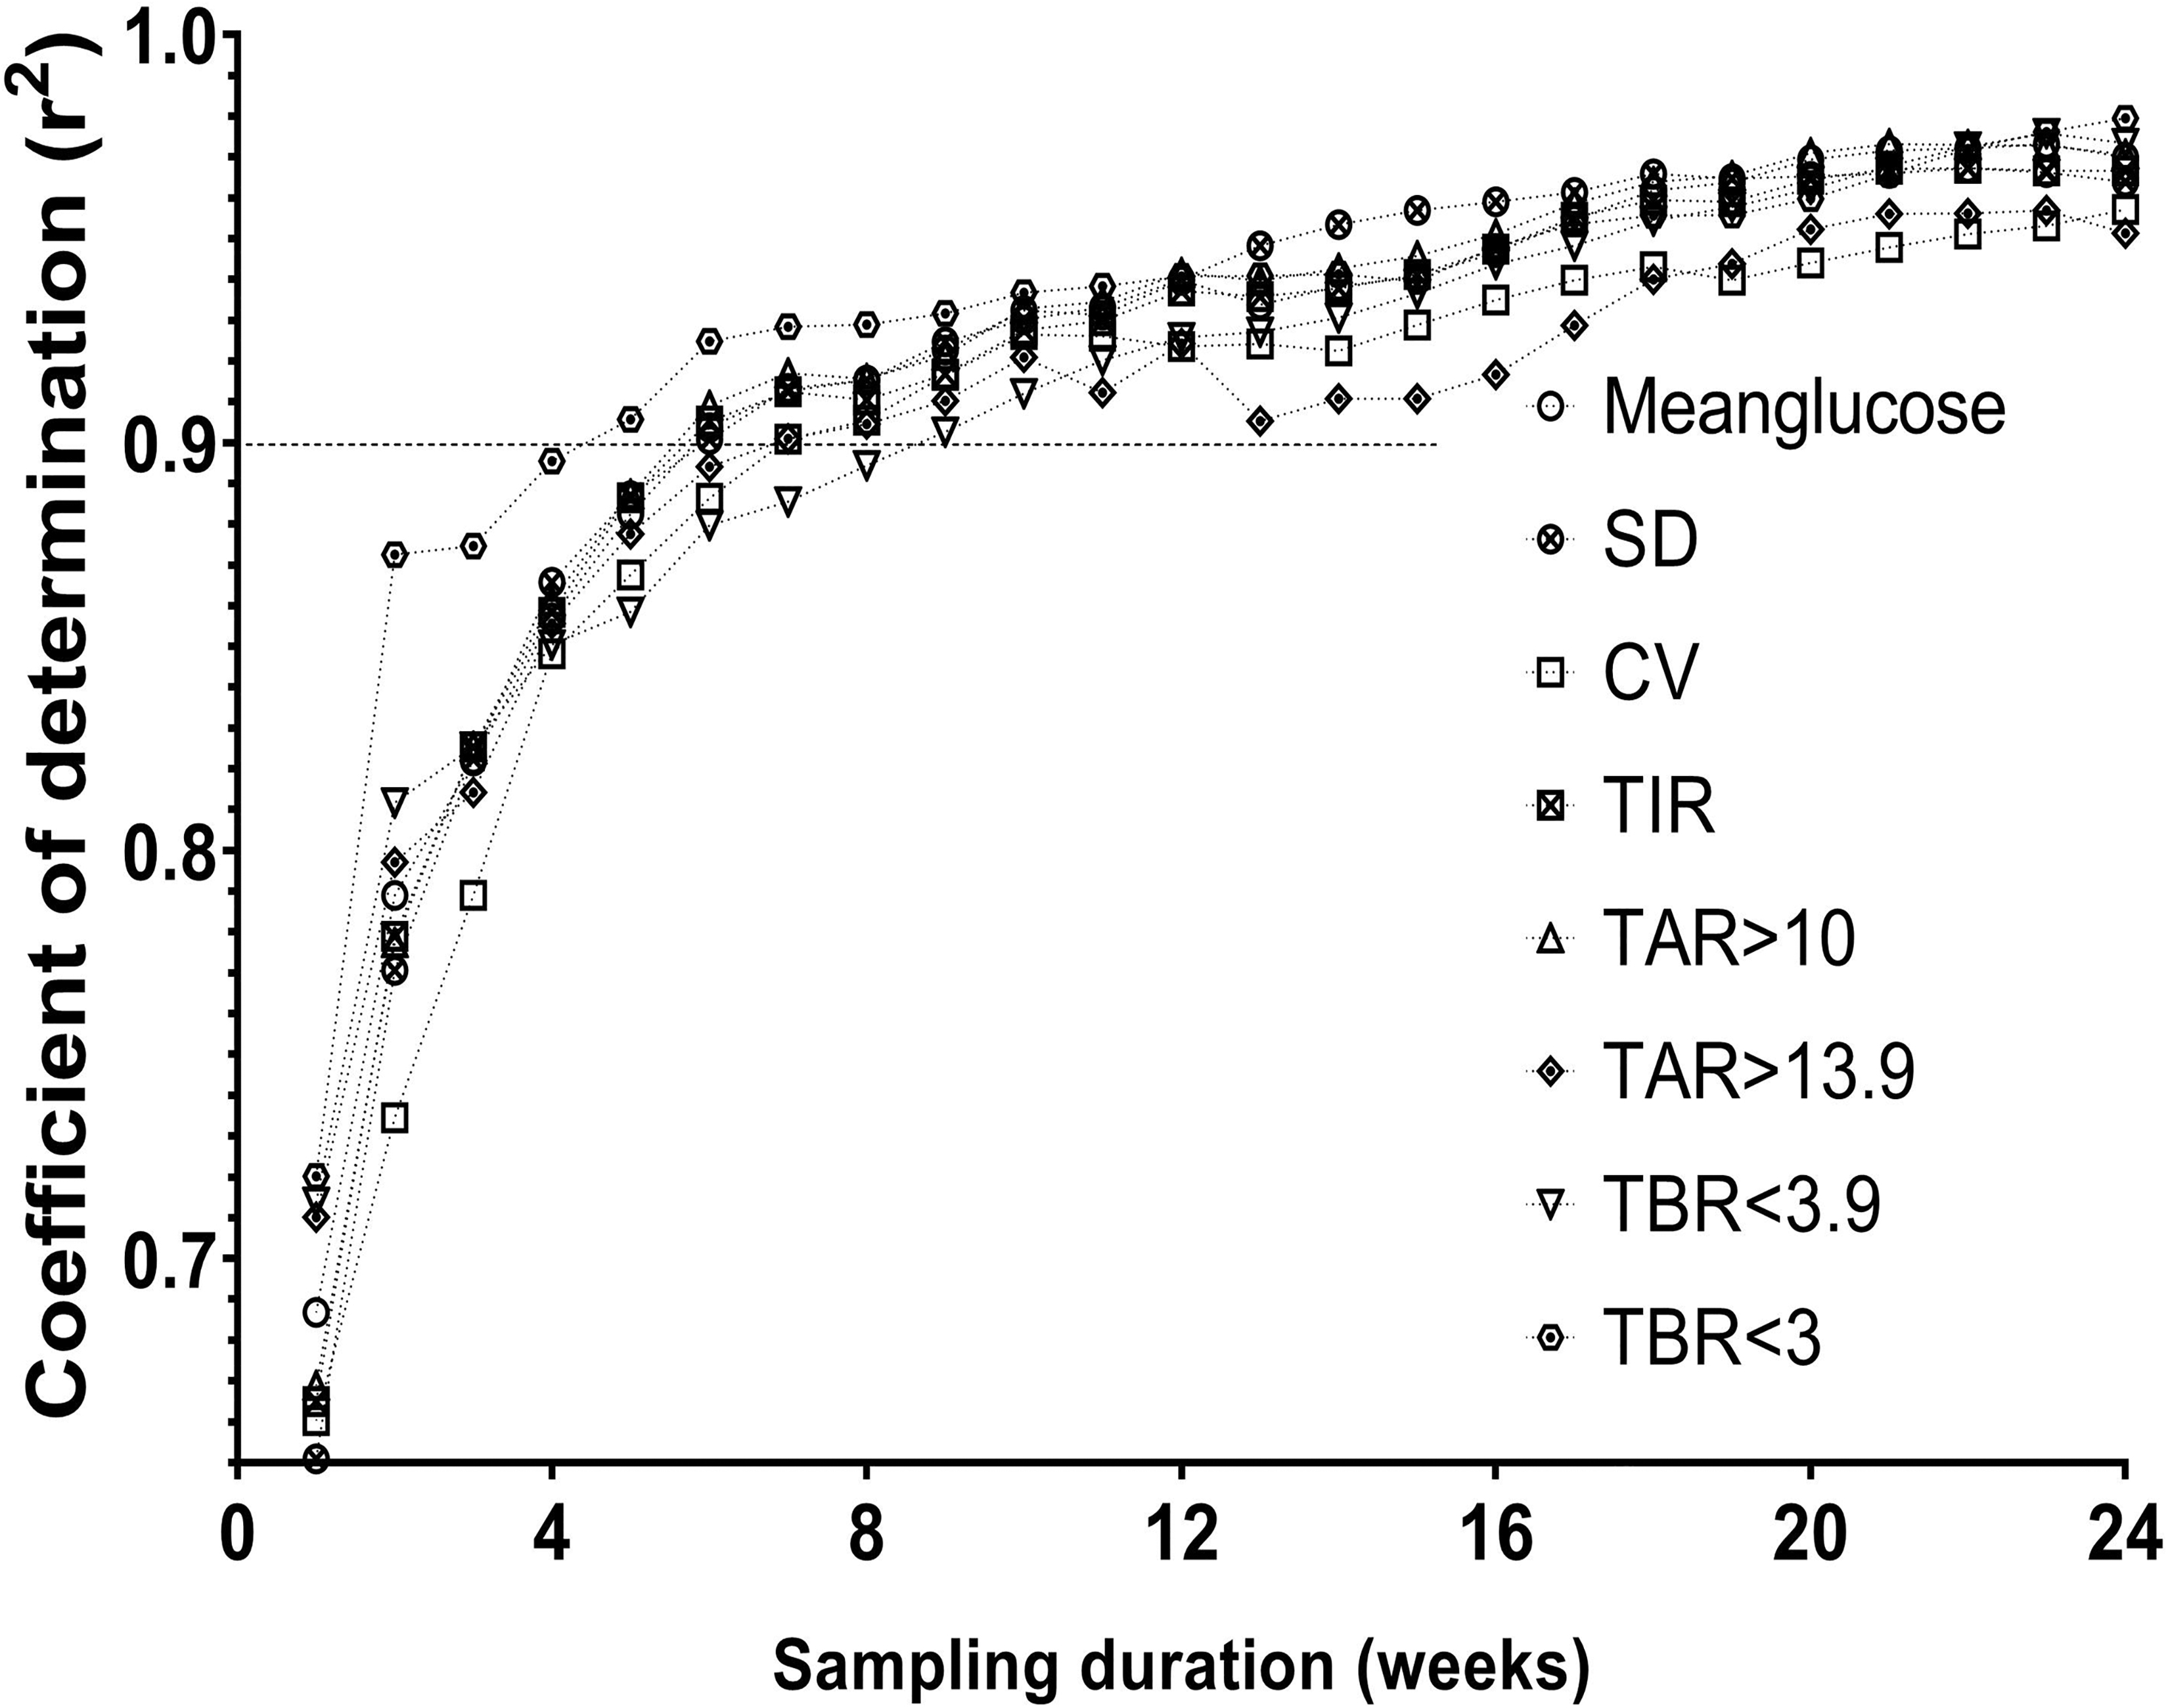
Correlation between glycemic indices derived from incremental sampling durations and the whole CGM data. CGM, continuous glucose monitoring.
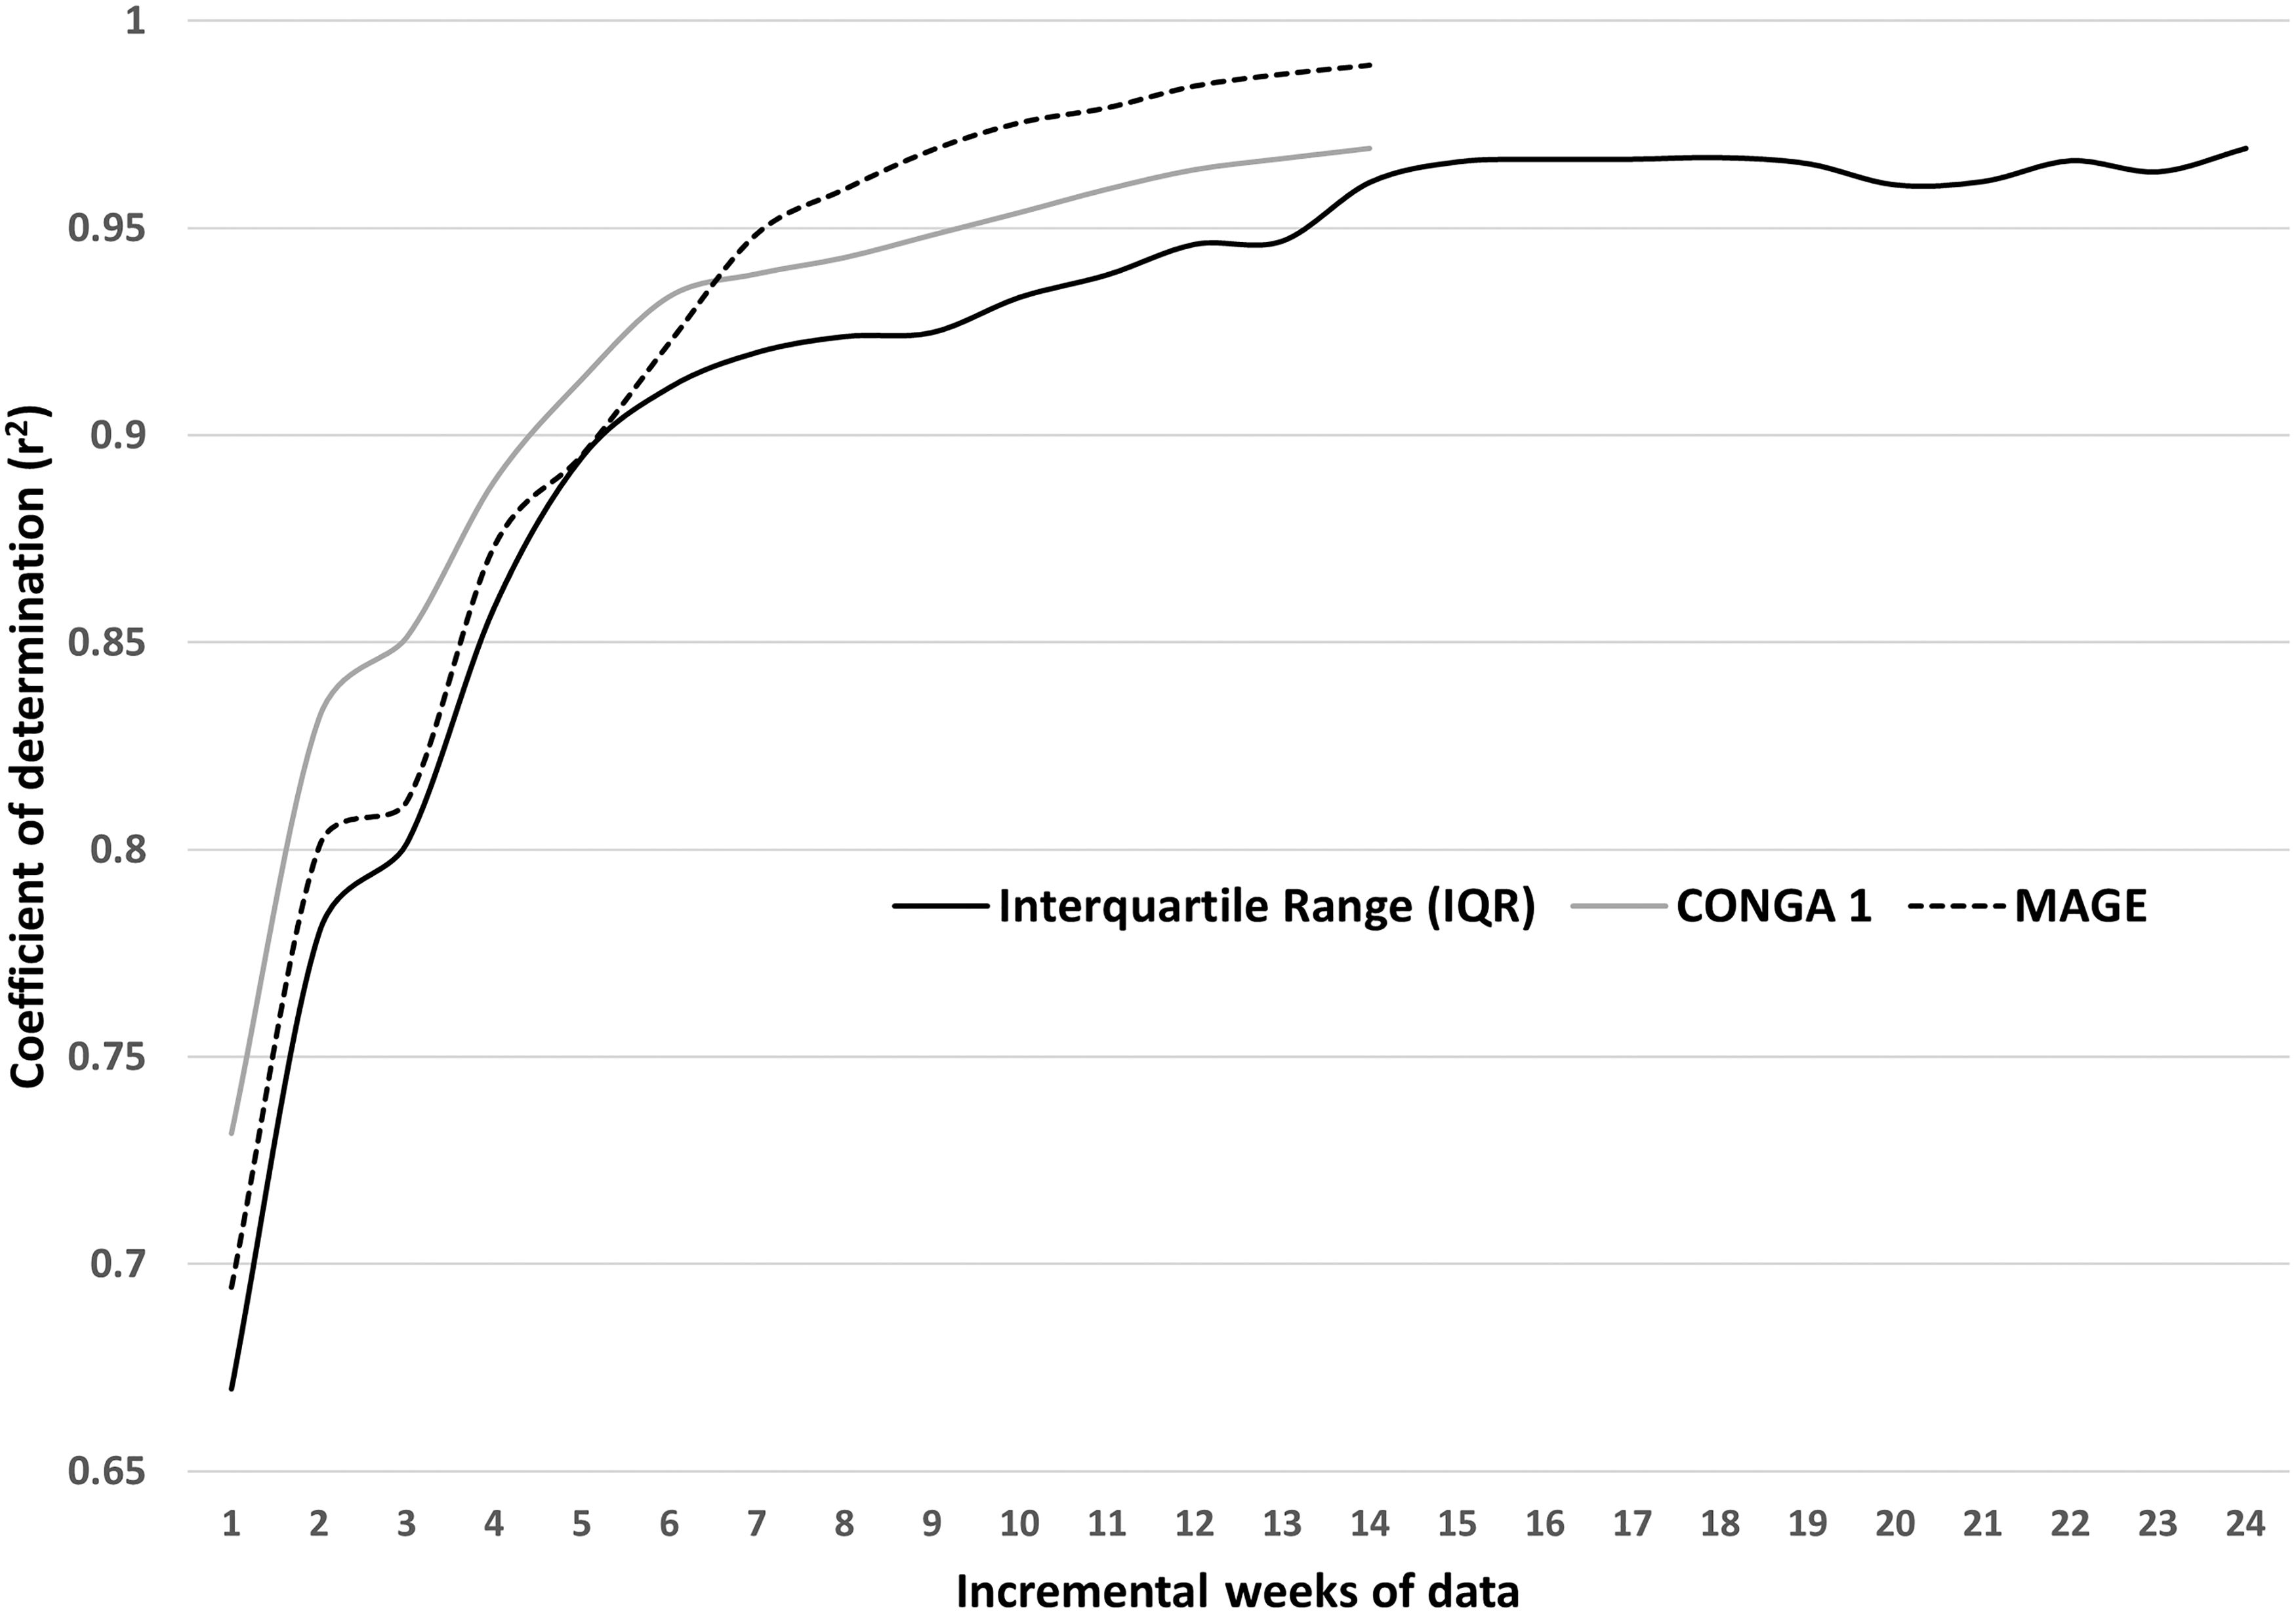
Correlation between IQR, MAGE, and CONGA1 derived from incremental weekly data to whole CGM data (data for MAGE and CONGA1 are limited to 14 weeks due to the limits of analysis on EasyGV ver9.0R2). CONGA1, continuous onset net glycemic action; IQR, interquartile range; MAGE, mean amplitude of glycemic excursion.
Effect of baseline GV
We divided the cohort into four quartiles based on week-1%CV (%CV: Q1, <33.7; Q2, 33.7 to <37.6; Q3, 37.6 to <42.2 and Q4, 42.2 to <61.3). The time to stability increased from the lowest (Q1) to the highest quartile (Q4) for mean glucose, TIR, and TAR >10, TAR >13.9 (Fig. 3). However, for TBR <3.9 and TBR <3 such an effect of baseline GV was not evident. For TBR <3.9 Q1, Q2 and Q4 had a shorter time to stability than Q3. This effect of baseline GV on the time to stability of glycemic indices was consistent even when only the 52 people with CGM duration of ≥24 weeks were analyzed. The time to stability (weeks) for Q1–Q4 varied from 2 to 16 for mean glucose, 3–21 for TIR, 3–16 for TAR >10, 1–30 for TAR >13.9, 6–16 for TBR <3.9, and 5–16 for TBR <3.
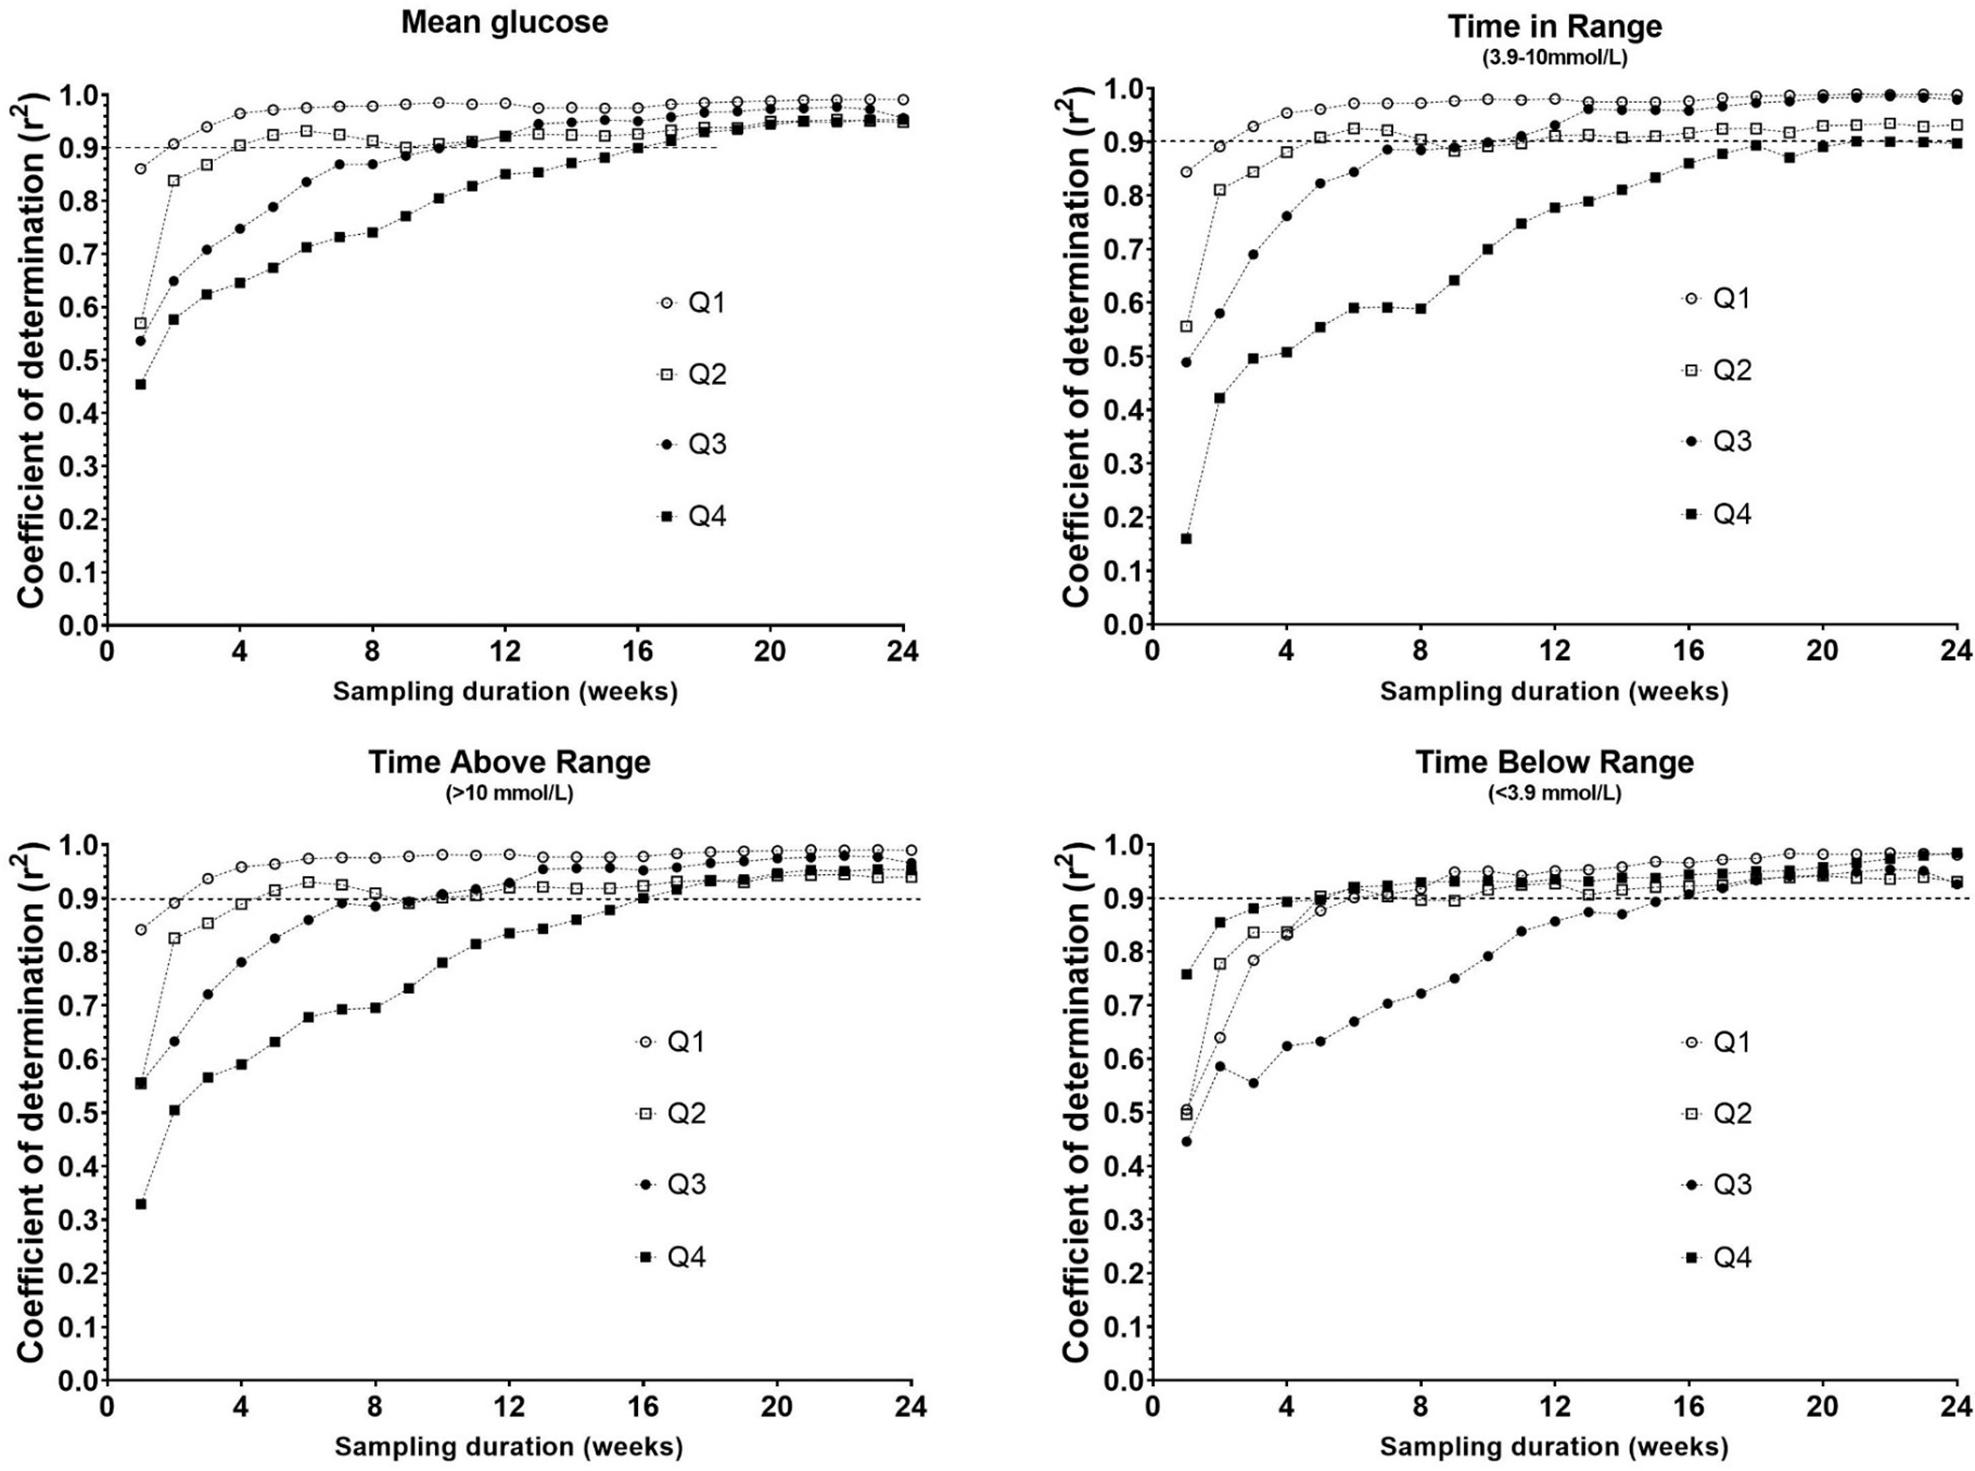
Effect of baseline glucose variability (week 1%CV) on the correlation between glycemic indices derived from incremental sampling durations to the whole CGM data (%CV: Q1, <33.7; Q2, 33.7 to <37.6; Q3, 37.6 to <42.2; and Q4, 42.2 to <61.3).
IWV of glycemic indices
IWV was assessed as %CVIWV. The mean %CVIWV was 9% for mean glucose, 13% for SD, 11% for %CV, and 16% for TIR. It was 31% for TAR >10 and 64% for TAR >13.9. TBR <3.9 had a %CVIWV of 62%, whereas TBR <3 had the highest IWV at 108% (Fig. 4). Indices measuring glycemia beyond the normal range (TAR and TBR) had higher IWV.
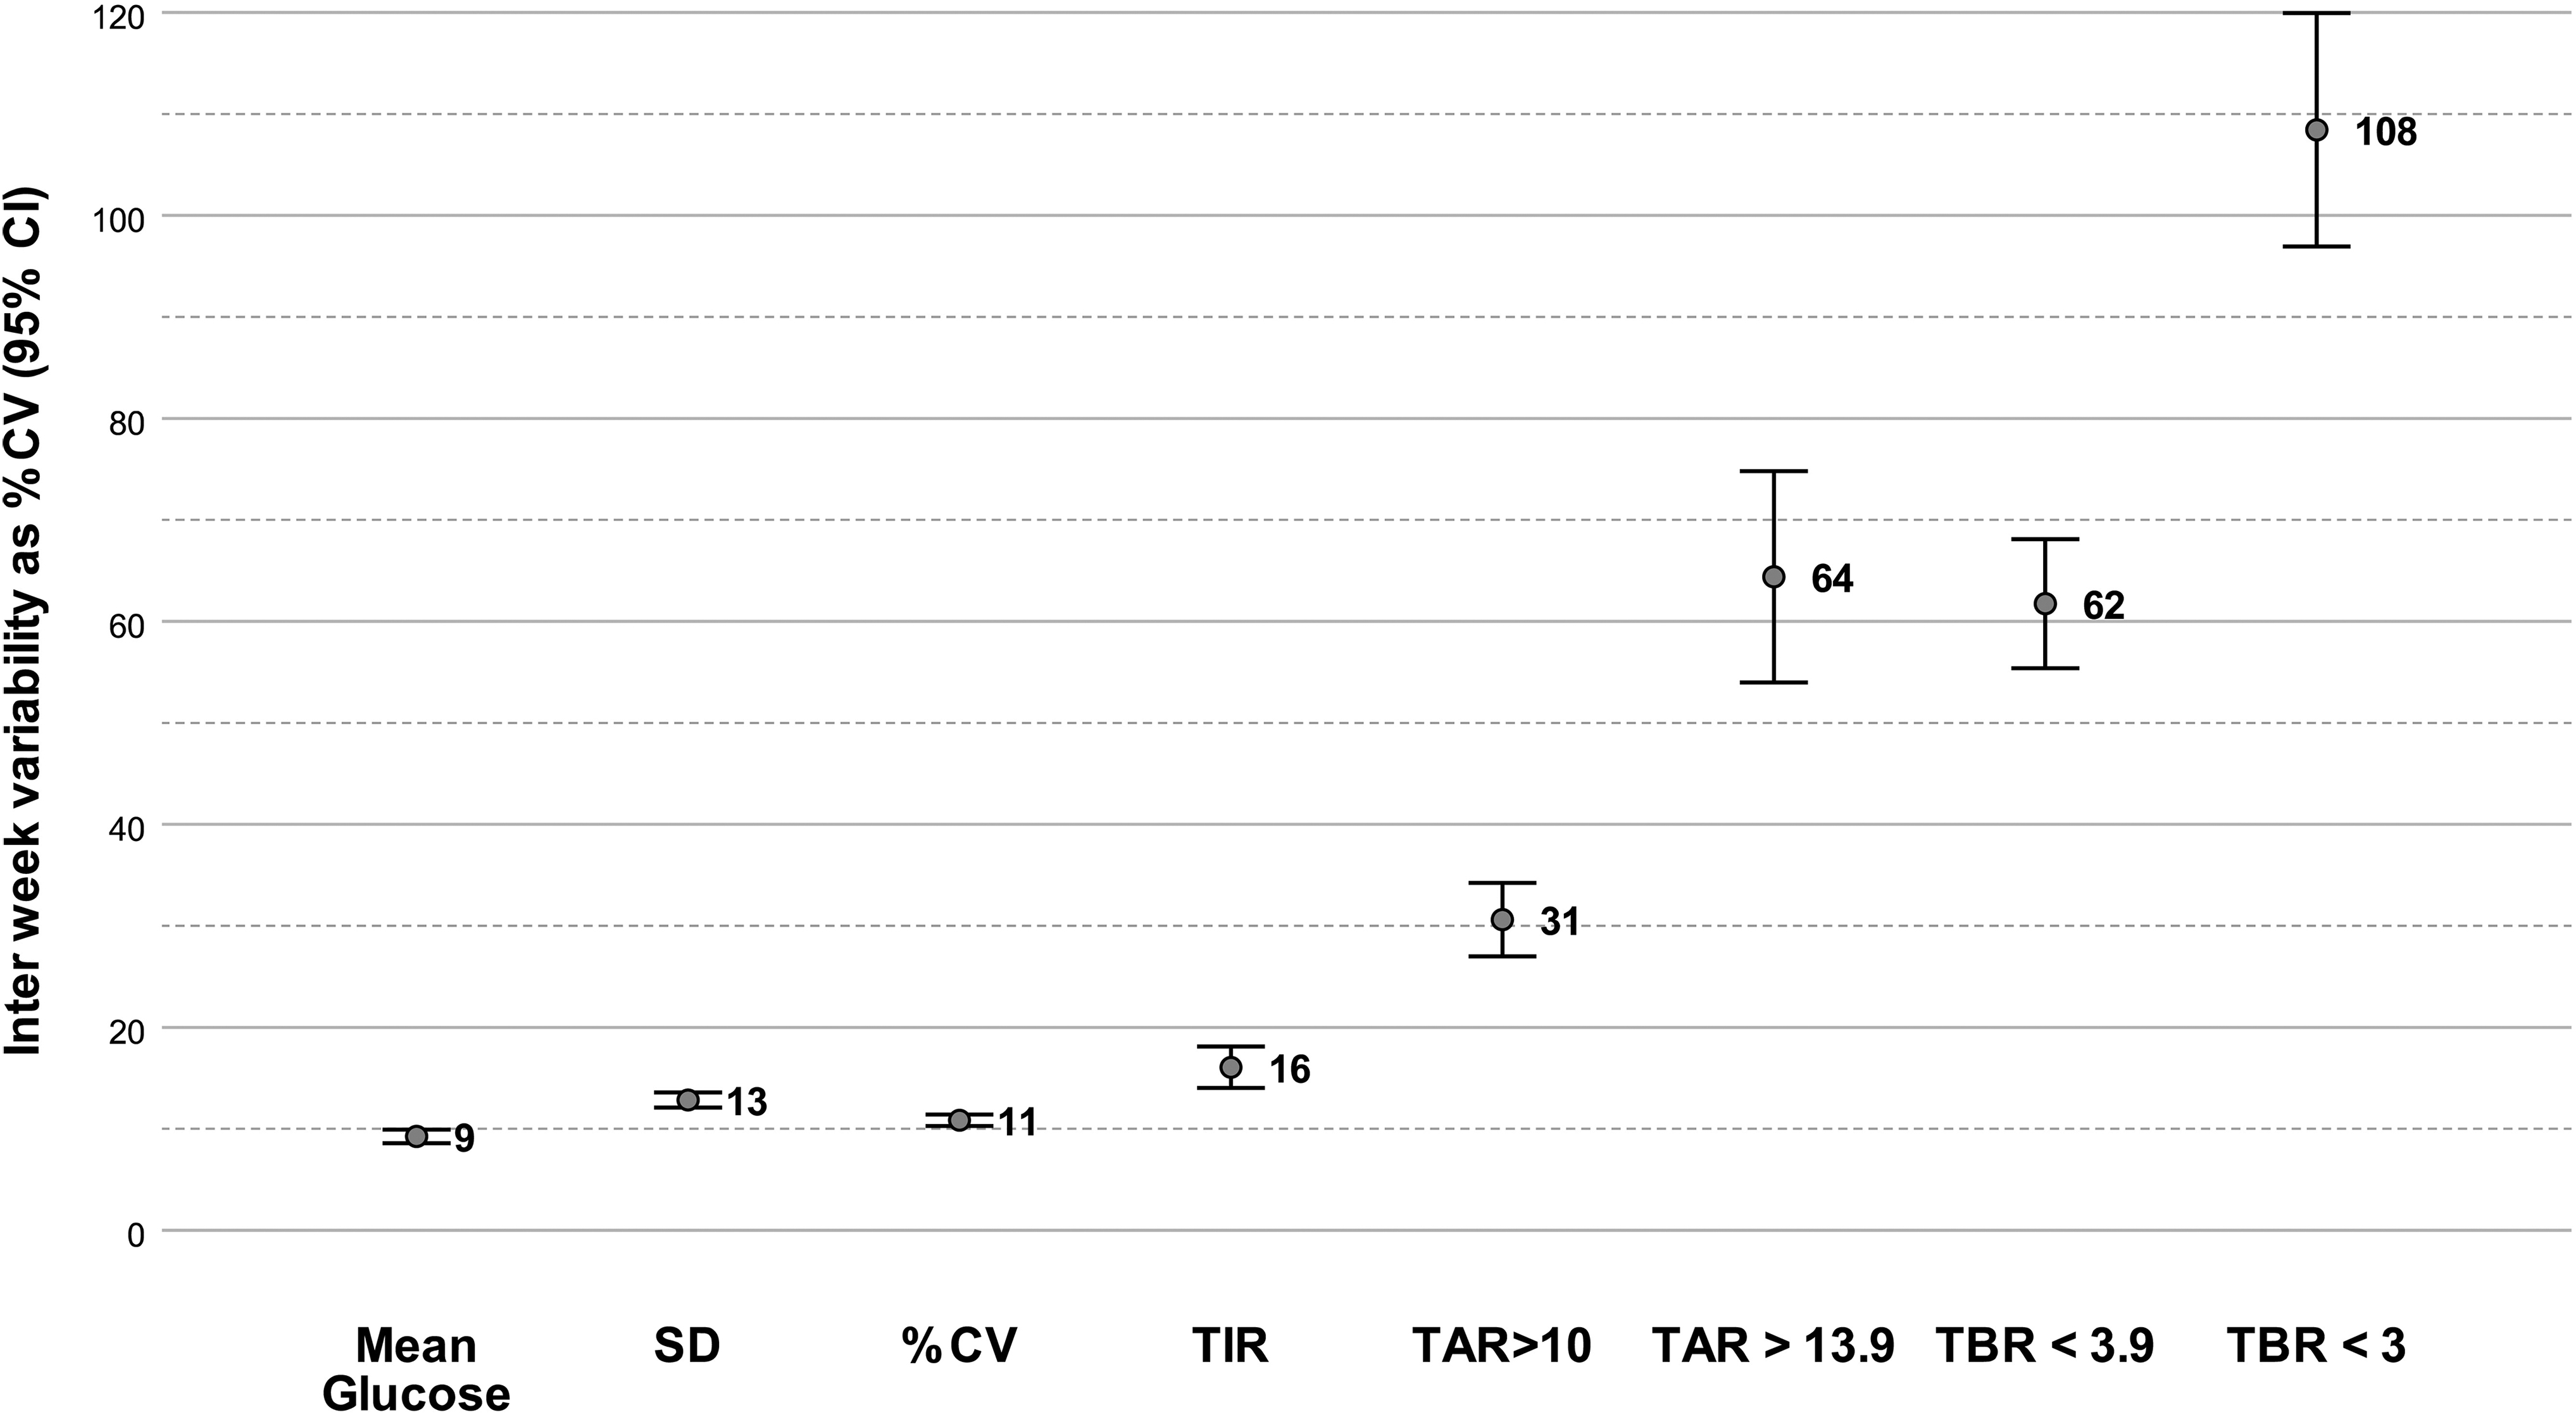
Interweek variability of CGM-derived glycemic indices expressed as %CV.
Clinical examples
To illustrate the aforementioned findings we present the variation in 1 and 2 week and 1- and 3-month data of two participants (L1 and L35), both on insulin pump therapy with similar HbA1c of 7.8% and 7.9%, respectively, at week 1. L1 had a baseline CV of 33.5% (Q1), and L35 had a week 1 CV of 48.2% (Q4). L1 with low baseline glycemic variability had smaller variations of glycemic measures across the sampling intervals; mean glucose (8.6–9.2 mmol/L), TBR (2.0%–4.9%), TIR (63.6%–69.3%), and TAR (26.3%–32.8%). In contrast, L35 with a higher baseline GV, while having smaller variations in mean glucose (8.4–9.2 mmol/L) and TIR (46.0%–54.6%), had large variations in TBR (9.1%–13.4%) and TAR (31.1%–44.2%).
Discussion
We found that the CGM-derived glycemic indices we analyzed took between 5 and 9 weeks to stabilize and provide a high degree of correlation with long-duration data. Baseline GV affects the time to stability of various glycemic indices. We defined “time to stability” as the minimum duration of time (data) needed to represent the glycemic signature of a person with diabetes. A higher baseline GV increases the time to stability for CGM-derived indices. Although previous studies concluded that 12–14 days of data were optimal for a 3-month period, 6,8,9 the same does not apply for longer durations of CGM data. A minimum sampling duration of 9 weeks (range 5–9 weeks) is required for the commonly used CGM indices when analyzing long-duration CGM data of >6 months. These findings are of relevance both in the clinical and research settings.
Glycemia is affected by both diabetes regimen setup and behavioral factors. The regimen setup, what we call “structural” factors, is the balance between basal and bolus insulin, the insulin to carbohydrate ratio (ICR), or insulin sensitivity factor (ISF) used to determine the doses of rapid-acting insulin. “Behavioral” factors are events such as a missed meal bolus, the frequency of glucose measurements, timing of rapid-acting insulin related to meals and over- or under-correction of high or low readings.
Dysglycemia related to behavioral factors, such as hyperglycemia from a missed bolus or cannula failure and hypoglycemia related to alcohol or exercise, is likely to result in short-term glycemic variability. In contrast, inappropriate structural setup of the insulin regimen, such as a wrong basal-bolus split, ICR, or ISF, is likely to result in recurrent long-term dysglycemic patterns. Although HbA1c remains an important measure of glycemia, changes to the treatment regimen are often triggered by CGM-derived indices such as the TIR, TBR, TAR, SD, and %CV, and these indices are being incorporated into the routine clinical conversation in diabetes clinics across the world.
When reviewing CGM data, most health care professionals opt to use the preset duration, usually 1–4 weeks, to generate the aforementioned indices. A review of the recent few weeks of CGM provides an excellent opportunity to discuss the impact of self-care behaviors on glycemia, as people tend to remember recent events better. However, our data show that a longer duration of data, possibly up to 9 weeks, is required for a true representation of the glycemic profile and assess longer-term risks of hyper- or hypoglycemia or the impact of “structural” changes to the insulin regimen such as changes to the ICR or ISF. This becomes extremely important when clinical decisions such as initiation or withdrawal of a diabetes-related technology are based on these CGM indices as thresholds.
These findings are equally important in a research setting as CGM-derived indices are gaining popularity as outcome measures. 4 First, the baseline GV of the study population of interest must be considered. Populations with a high baseline GV (e.g., diabetes on intermittent dialysis, 10 diabetes with eating disorders) will have a longer time to stability for CGM indices. 11 This duration will be shorter in populations with a low baseline GV (e.g.: type 1 diabetes in the honeymoon phase, early type 2 diabetes, 12 type 1 on closed-loop systems 13 ). Second, the CGM index of interest must be considered. CGM indices measuring the extremes of glycemia such as the TBR and TAR have a higher IWV than TIR. Hence while designing studies with CGM-derived indices as outcome measures, the baseline GV of the population and the inherent IWV of the CGM index must be considered.
Although our data show that baseline glycemic variability influenced the time to stability, other potential confounders for this effect need to be considered. An improvement in glycemia over time to reach a new steady state was considered, by comparing the monthly mean of these glycemic indices for 6 months and no significant change over time was found.
The limitations of this study include a nonrandom sample selection and the lack of analysis of the indications for CGM initiation. Furthermore, we did not analyze all the glycemic indices that have been described in the literature. Another factor that affects this correlational analysis is the inherent heterogeneity of glycemia in the type 1 diabetes population and variability due to sampling. Ours is a nonrandom opportunistic sample of people with type 1 diabetes using CGM, hence, the findings may not be generalized to all people with type 1 diabetes. However, we believe that our real-life data set may be more representative of a broader “real-world population” of people with type 1 diabetes using CGM than data from clinical studies that often have restrictive inclusion and exclusion criteria.
Conclusion
This study adds a novel perspective to the analysis of minimum time to stability for CGM indices with implications for the use of CGM in both the clinical and research settings. While the use of short duration CGM data (e.g., 2 weeks) in clinical consultations has great educational value in discussing the diabetes self-care behavior, longer duration data that provide the bigger picture should be used to make treatment decisions related to the structural setup of the insulin replacement regimen. The baseline GV of the person/population and the CGM index of interest impacts the minimum time to stability of a CGM index derived from long-duration CGM data.
Footnotes
Author Disclosure Statement
No competing financial interests exist.
Funding Information
This project has received funding from the Innovative Medicines Initiative 2 Joint Undertaking (JU) under grant agreement no. 777460. The JU receives support from the European Union's Horizon 2020 research and innovation programme and EFPIA and T1D Exchange, JDRF, International Diabetes Federation (IDF), The Leona M. and Harry B. Helmsley Charitable Trust. IMI website: htpp://
Supplementary Material
Supplementary Table S1
References
Supplementary Material
Please find the following supplemental material available below.
For Open Access articles published under a Creative Commons License, all supplemental material carries the same license as the article it is associated with.
For non-Open Access articles published, all supplemental material carries a non-exclusive license, and permission requests for re-use of supplemental material or any part of supplemental material shall be sent directly to the copyright owner as specified in the copyright notice associated with the article.