
Abstract
Background:
The objective of this study was to demonstrate the pharmacokinetic and pharmacodynamic similarity among SAR341402 insulin aspart biosimilar/follow-on product, United States-sourced insulin aspart (NovoLog®), and European Union-sourced insulin aspart (NovoRapid®).
Materials and Methods:
This was a single-center, randomized, double-blind, 3-treatment, 3-period, single-dose, crossover euglycemic study (NCT03202875) in 30 adult male subjects with type 1 diabetes (T1D). Subjects received 0.3 U/kg of each treatment under fasted conditions and underwent a 12-h euglycemic clamp technique to assess pharmacokinetic and pharmacodynamic activity for up to 12 h. Primary endpoints were area under the plasma insulin concentration–time curve from time zero to the last quantifiable concentration (INS-AUClast), and extrapolated to infinity (INS-AUCinf), maximum plasma insulin concentration (INS-Cmax), and the area under the body weight-standardized glucose infusion rate (GIR)–time curve from 0 to 12 hours (GIR-AUC0–12h) among the three treatments. GIRmax was the main secondary endpoint.
Results:
Of the 30 subjects randomized, 29 completed all 3 treatment periods. Pharmacokinetic and pharmacodynamic profiles were similar in all groups. The extent of exposure (INS-Cmax, INS-AUClast, and INS-AUCinf) and glucodynamic activity (GIR-AUC0–12h, GIRmax) was similar among the three treatments. The corresponding 90% confidence intervals for pairwise treatment ratios were completely contained within the limits of 80%–125%. SAR341402 was well tolerated.
Conclusions:
The present study demonstrated similar pharmacokinetic exposure profiles and glucodynamic potency among SAR341402, NovoLog, and NovoRapid in subjects with T1D, supporting further clinical evaluation of SAR341402 as a biosimilar/follow-on product.
Introduction
Insulin aspart is a rapid-acting human insulin analog of recombinant DNA origin. It is the active ingredient of the currently approved marketed products NovoLog® and NovoLog Mix in the United States (US), 1 and NovoRapid® and NovoMix® in the European Union (EU) 2 for the treatment of hyperglycemia. It has been widely used in clinical practice for about 20 years, with a well-characterized pharmacological efficacy and safety profile. 3
Rising insulin costs remain a concern for people with diabetes, their families, and health care providers. 4 The development of new biosimilar or follow-on insulin products over the last few years, including rapid-acting insulins, has the potential to reduce drug treatment costs and thereby facilitate greater access of insulin treatment for people with diabetes. 5 In July 2017, the first rapid-acting insulin biosimilar/follow-on product (SAR342434, insulin lispro Sanofi) was approved in Europe and subsequently in other countries for the same indications as the reference drug. 6,7 SAR341402 insulin aspart solution for injection (SAR-Asp; Sanofi, Paris, France) is the second rapid-acting insulin biosimilar/follow-on product to undergo evaluation, having the same amino acid sequence and corresponding structure as insulin aspart in the reference medicinal product, NovoLog (NN-Asp-US)/NovoRapid (NN-Asp-EU). SAR-Asp is produced in Escherichia coli, while NN-Asp-US/NN-Asp-EU is produced in Saccharomyces cerevisiae or baker's yeast. Consistent with regulatory guidance, the development of SAR-Asp is based on establishing a biological medicinal product that is similar to the already authorized original biological medicinal product in terms of quality, safety, and efficacy, based on a comprehensive comparability exercise. 8
SAR-Asp has been developed as a similar biological medicinal product to NN-Asp-US/NN-Asp-EU (100 U/mL) in accordance with relevant US and EU guidelines. 8 –11 SAR-Asp was shown to be similar to NN-Asp-US/NN-Asp-EU through physicochemical analysis and nonclinical studies, including in vitro and in vivo analyzes. It is intended to have the same indications, dosage form, routes of administration and dosing regimen as NN-Asp-US/NN-Asp-EU. The clinical development program of SAR-Asp was designed to demonstrate similarity in the pharmacokinetic and pharmacodynamic profiles, efficacy, and safety (including immunogenicity) between SAR-Asp and NN-Asp-US/NN-Asp-EU.
In this study, we report the results of a study to demonstrate similarity in pharmacokinetic exposure and glucodynamic activity of the SAR-Asp insulin aspart product to NN-Asp-US and NN-Asp-EU using the euglycemic clamp technique in subjects with type 1 diabetes (T1D).
Materials and Methods
This was a single-center, randomized, double-blind, controlled, single-dose, 3-treatment, 3-period, 6-sequence, euglycemic clamp crossover study (
Subjects
Participants were enrolled at the Profil Institute (Neuss, Germany) and included subjects aged 18–65 years with T1D (duration >1 year) but otherwise healthy, with a body mass index of 18 to 30 kg/m2, a fasting negative serum C-peptide level <0.3 nmol/L, a glycated hemoglobin level ≤75 mmol/mol (≤9%), a total insulin dose of <1.2 U/(kg·day), and a stable insulin regimen for at least 2 months before the study.
Study design and treatments
The study comprised a screening period followed by three treatment periods, each separated by a 5 to 18-day washout period (Supplementary Fig. S1). Subjects were randomly assigned using a computer-generated list to receive one of six possible treatment sequences for single 0.3 U/kg doses of SAR-Asp (test product), NN-Asp-US (insulin aspart 100 U/mL), or NN-Asp-EU (100 U/mL insulin aspart). SAR-Asp was manufactured by Sanofi (Frankfurt, Germany) and provided as solution for injection at a concentration of 100 U/mL. NN-Asp-US and NN-Asp-EU were provided as commercial formulations. To maintain double-blinding and consistency of dosing methodology, study treatments were withdrawn by an unblinded investigator from cartridges with insulin syringes; this person was not otherwise involved in the study.
Pharmacokinetic evaluation
Venous blood samples were collected before and then at frequent times after dosing in each treatment period; that is, every 10 min for the first 2 h, every 15 min from 2 to 4 h, every 20 min from 4 to 6 h, every 30 min from 6 to 8 h, and then every 60 min up to 12 h. All samples were centrifuged within 20 min of collection. Plasma was transferred to separate tubes, frozen immediately, and stored at −60°C to −80°C until analysis.
Plasma concentrations of SAR-Asp and NN-Asp-US/NN-Asp-EU were analyzed using a validated liquid chromatography-tandem mass spectrometry assay at Syneos Health (Québec, Canada). The measurement range of the assay was 100–8000 pg/mL with 100 pg/mL defined as the lower limit of quantification. Cross-validation of the assay with NN-Asp-US and NN-Asp-EU was also performed, with the assay shown to be precise, accurate, sensitive, and selective over the validated range. For patients receiving a rescue insulin during the clamp procedure (after dosing of study drugs), plasma concentrations of SAR-Asp and NN-Asp-US/NN-Asp-EU were analyzed up to the start time of the rescue insulin administration.
Pharmacodynamic evaluation using euglycemic clamp
The pharmacodynamic effect of insulin aspart was evaluated using the euglycemic clamp technique, as described previously. 12 During the euglycemic clamp, the blood glucose (BG) concentration and the glucose infusion rate (GIR), representing the amount of external glucose needed to keep a subject's BG concentration at its target level, were continuously measured and recorded by the clamp device (Biostator, Life Sciences Instruments, Elkhart, IN). The amount of glucose required (area under the body weight-standardized GIR time curve [GIR-AUC]) is a measure of the metabolic activity of the investigated insulin (decrease in endogenous glucose production and variable peripheral glucose uptake). The clamp device determined BG levels in 1 min intervals and adjusted the GIR in response to changes in BG using a predefined algorithm. During the clamp, arterialized venous BG concentration, 13 which reflects the supply for total glucose utilization of all tissues, and GIRs were continuously monitored (at a rate of 2 mL/h). In addition, blood samples were collected in 30 min intervals for concurrent calibration of the clamp device, which was required for the calibration procedure to maintain the glycemic clamp.
Before receiving study medication, subjects underwent a washout of their usual insulin therapy, with the last dose of basal insulin received at least 48 h before dosing. Subjects were required to abstain from injection or infusion of short-acting insulin products (other than insulin aspart) for a minimum of 8 h before dosing (See Supplementary Fig. S2 for further details). The clamp procedure was performed under fasting conditions following an overnight fasting period. Once connected to the clamp device, a variable basal intravenous infusion of insulin glulisine (0.3 U/mL) or 20% glucose solution was initiated to achieve a BG target level of 100 mg/dL [5.5 mmol/L]). After BG levels were stabilized for at least 1 h without any glucose infusion, the insulin aspart products were administered. The insulin glulisine infusion was discontinued at least 10 min before dosing. The short action time of insulin aspart after subcutaneous administration meant that monitoring under clamp conditions was limited to 12 h after study drug injection. This duration was deemed sufficient, allowing for individual variations in insulin elimination and the duration of pharmacodynamic activity. The clamp was prematurely terminated if BG consistently exceeded 200 mg/dL (11.1 mmol/L) with no glucose infusion for the last 30 min.
Safety evaluation
The safety and tolerability of SAR-Asp was assessed by 12-lead electrocardiogram, vital signs, routine laboratory assessments, physical examination, adverse event (AE) reporting, and assessment of injection site reaction. AEs were coded using Medical Dictionary for Regulatory Activities (MedDRA) version 15.1.
Pharmacokinetic and pharmacodynamic parameters
Pharmacokinetic parameter estimates for SAR-Asp and NN-Asp-US/NN-Asp-EU were calculated using standard noncompartmental methods with Phoenix WinNonlin® version 5.2.1 and PKDMS version 2.2 (Pharsight Corporation, Cary, NC). Area under the plasma insulin aspart concentration-time curve was calculated using the log-linear trapezoidal rule from time zero (predose) up to the time of the last quantifiable concentration (INS-AUClast) and extrapolated to infinity (INS-AUCinf). The primary pharmacokinetic endpoints of the study were maximum observed plasma insulin aspart concentration (INS-Cmax), INS-AUClast, and INS-AUCinf.
For derivation of the pharmacodynamic parameters, the individual maximum smoothed body weight standardized GIR (GIRmax) was based on smoothed (locally weighted regression in smoothing scatter [LOESS] plots; SAS®, PROC LOESS, factor 0.06) body weight standardized GIR data to reduce the noise associated with GIR adjustment. GIR-AUC from 0 to 12 hours (GIR-AUC0–12h) was the primary pharmacodynamic endpoint; GIRmax was a secondary endpoint.
Sample size and statistical analyses
The aim of the study was to demonstrate similarity in exposure and activity of SAR-Asp insulin aspart to NN-Asp-US and NN-Asp-EU. To demonstrate equivalence in pharmacokinetic exposure and pharmacodynamic activity among SAR-Asp, NN-Asp-US, and NN-Asp-EU, a total of 18 and 24 evaluable subjects, respectively, was required, assuming a true within-subject standard deviation of 0.175 for INS-AUCinf and 0.20 for GIR-AUC0–12h, respectively, for a true treatment ratio of 0.95. Sample sizes were planned to provide at least 90% power to demonstrate equivalence with 5% type 1 error for the pharmacokinetic and pharmacodynamic parameters using the 0.80 to 1.25 acceptance range, in agreement with regulatory guidance. 8 The study planned to recruit 30 subjects.
The log-transformed INS-Cmax, INS-AUClast, INS-AUCinf, and GIR-AUC0–12h were evaluated with a linear mixed effects model, including subject within sequence as a random effect with period, sequence, and treatment as fixed effects. For each parameter, the estimated difference in treatment means along with the 90% confidence limits was back transformed to estimate the treatment ratio of geometric means and the confidence limits. Similarity for the primary pharmacokinetic parameters INS-AUCinf and INS-Cmax and bioequipotency for the primary pharmacodynamic parameter GIR-AUC0–12h was concluded if the 90% confidence intervals (CIs) of the treatment ratios of the geometric means were entirely within the 0.80 to 1.25 equivalence interval. GIRmax was analyzed using a corresponding statistical model. For GIR AUC0–12h and GIRmax, 95% CIs were also presented. Statistical analyzes were performed using SAS version 9.2 (SAS Institute, Inc., Cary, NC).
Clamp quality was assessed by determining the time span of euglycemia, defined as the time from dosing to the last value of the smoothed BG concentration curve at or below 105 mg/dL (5.8 mmol/L); the duration of euglycemia; the individual mean of the BG concentrations; the precision, defined as the individual coefficient of variation (CV, %) of BG device measurements during euglycemia; and the control deviation, defined as the mean absolute difference of individual mean BG measurements from the clamp target level, as described previously. 14
Results
Thirty male subjects were randomized and treated. One subject discontinued study treatment prematurely due to an administration problem in one treatment period related to backflow of study medication after dosing of NN-Asp-US. This subject was randomized to a treatment sequence of NN-Asp-EU/NN-Asp-US/SAR-Asp and was therefore missing from the pharmacokinetic and pharmacodynamic populations for NN-Asp-US and SAR-Asp (29 subjects each) and from the safety population for SAR-Asp. All participants were Caucasian. Baseline characteristics of the subjects are given in Table 1.
Baseline Characteristics of the Study Population (Safety Population)
All average data are mean ± SD [range] unless stated otherwise.
HbA1c, glycated hemoglobin; SD, standard deviation.
Pharmacokinetics
The pharmacokinetic profiles of the three insulin aspart products were virtually superimposable as shown when plotting the mean insulin aspart concentration versus time (Fig. 1A) and the median of percentage of cumulative insulin aspart concentration (based on AUClast) versus time (Fig. 1B) for SAR-Asp, NN-Asp-US, and NN-Asp-EU. The 90% CIs of the treatment ratios for INS-Cmax, INS-AUClast, and INS-AUCinf were entirely within the predefined acceptance interval of 0.80 to 1.25 (Table 2), confirming equivalent exposure of the three insulin lispro products. Descriptive statistics per treatment for pharmacokinetic parameters are shown in Supplementary Table S1. The pharmacokinetic parameters show low to moderate between-subject variability, as demonstrated by CVs between 27% and 37%. Within-subject variability across the three clamps was low, with CVs of 10.01% (90% CI: 8.65–11.93) for INS-AUCinf and 17.56% (15.19–20.90) for INS-Cmax.
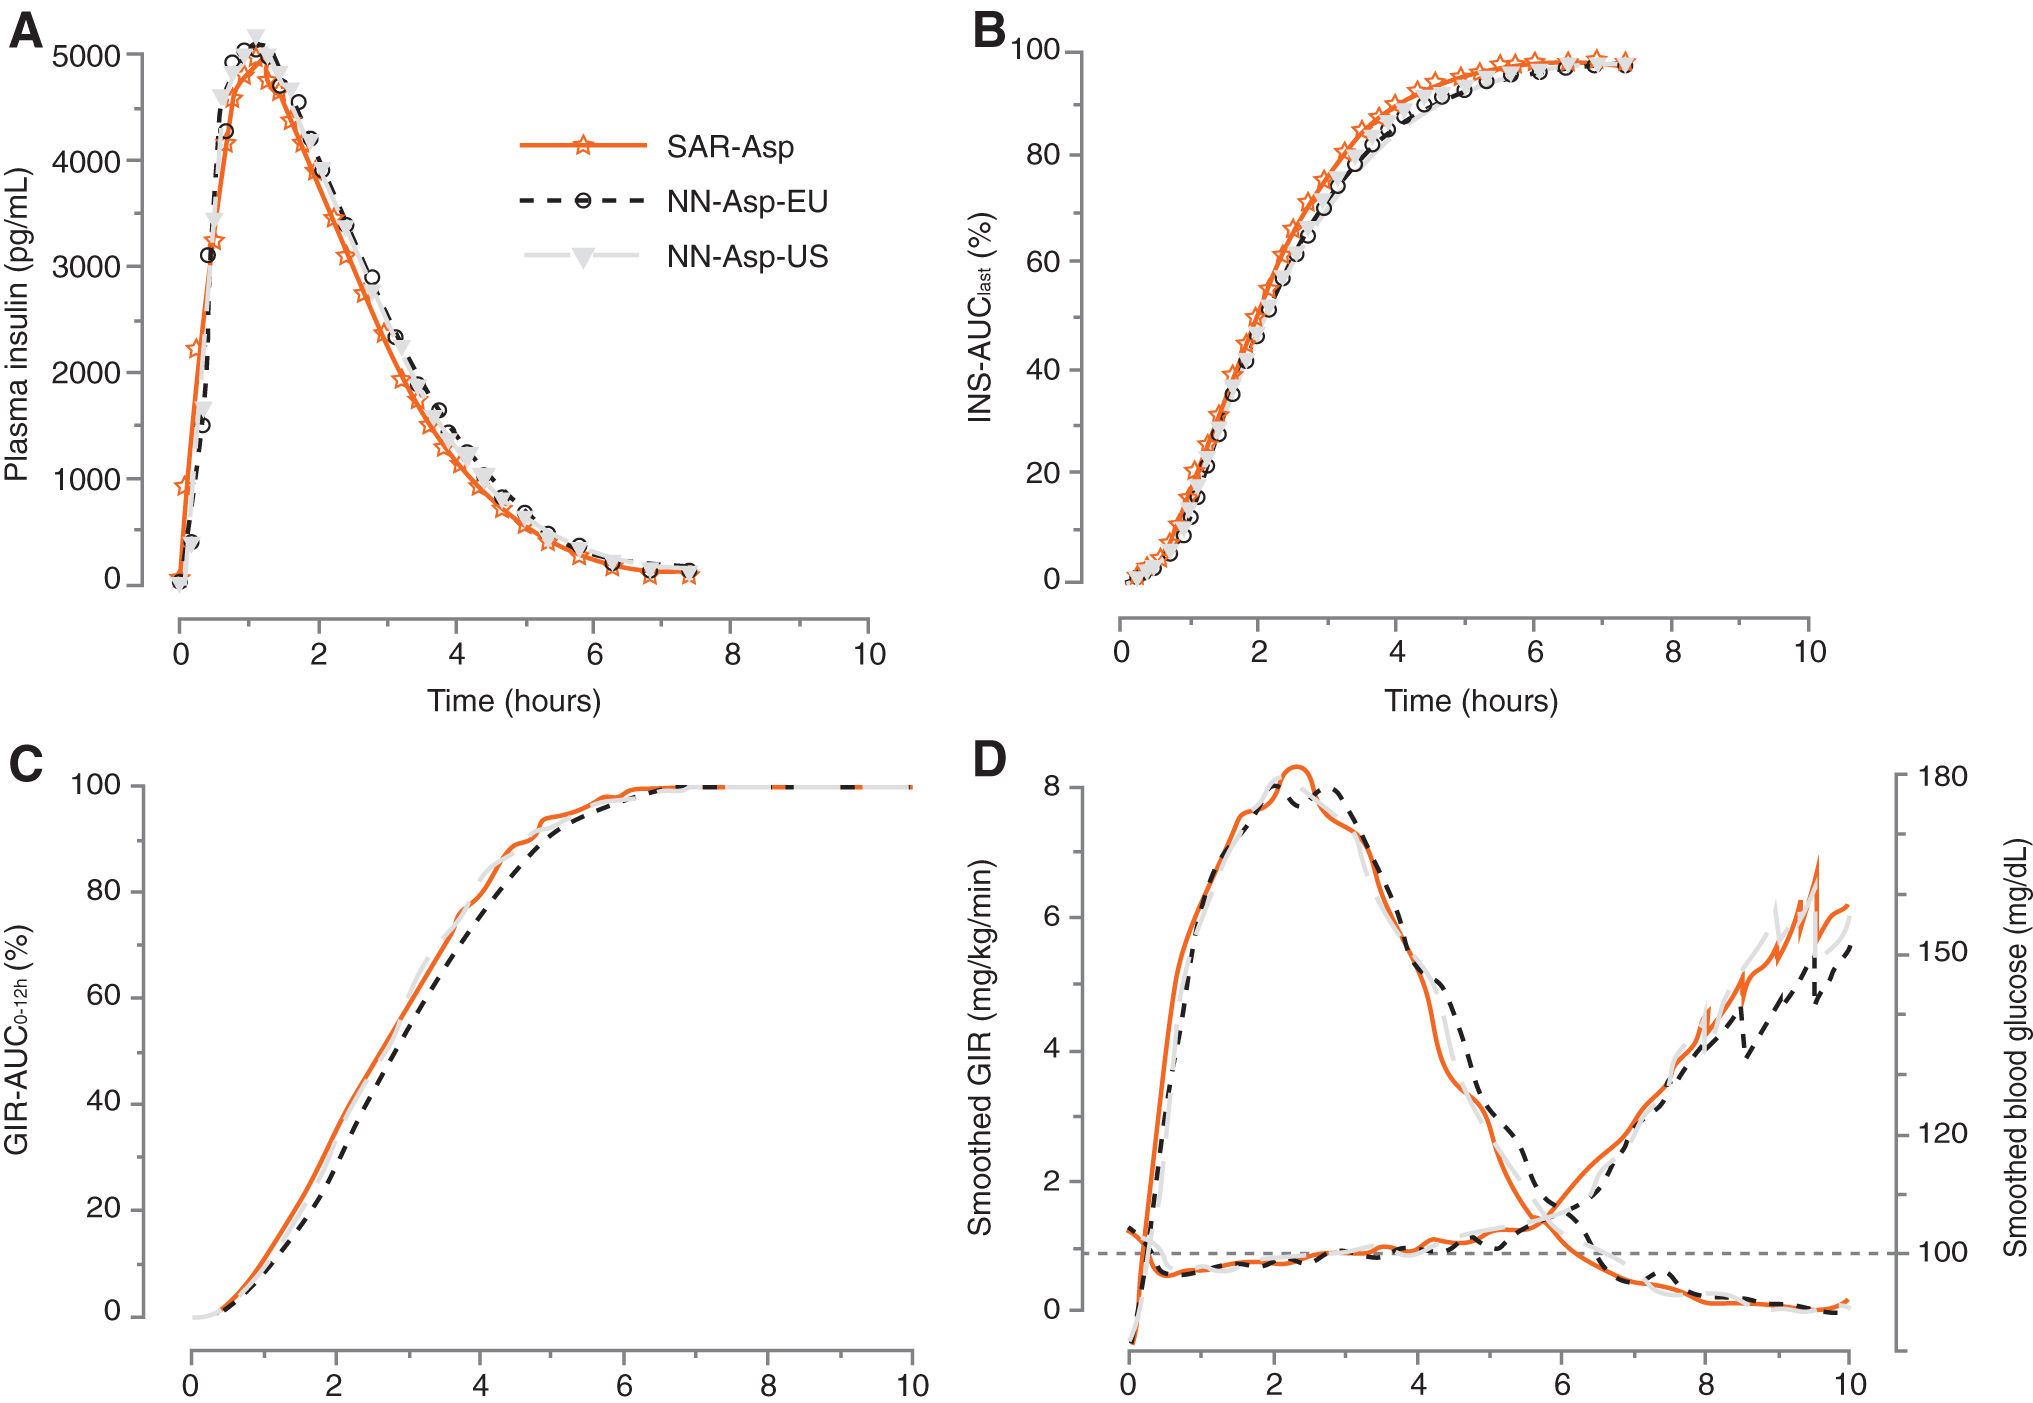
Pharmacokinetic and pharmacodynamic profiles for SAR-Asp, NN-Asp-US, and NN-Asp-EU versus time. Mean insulin aspart plasma concentration
Pharmacokinetic Endpoints
CI, confidence interval; INS-AUClast, area under the drug plasma concentration-time curve from time 0 to the time of the last quantifiable data point, INS-AUCinf area under the drug plasma concentration-time curve from time 0 to infinity, INS-Cmax maximum insulin aspart concentration in plasma.
Pharmacodynamics
The pharmacodynamic profiles of the three insulin aspart products were similar, as shown in plots of the median of percentage of cumulative glucose infusion based on GIR-AUC0–12h versus time (Fig. 1C) and the mean smoothed bodyweight-standardized GIR and BG control versus time (Fig. 1D). The overall pharmacodynamic effects of the three insulin aspart products were generally similar, displaying a short time-action profile.
The extent of glucose-lowering effect, as indicated by GIR-AUC0–12h and GIRmax, was similar among the three treatments (Table 3), with the 90% CIs and even the 95% CIs for the pairwise treatment ratio entirely within the predefined interval of 0.80 to 1.25, thereby demonstrating equipotency of SAR-Asp, NN-Asp-US, and NN-Asp-EU. Descriptive statistics per treatment for pharmacodynamic parameters are shown in Supplementary Table S1. Between-subject variability for GIR-AUC0–12h and GIRmax was low, as demonstrated by CVs per treatment between 18% and 27%. Within-subject variability across the three clamps was low, with CVs of 17.12% (90% CI: 14.81–20.38) for GIR-AUC0–12h and 15.48% (13.39–18.42) for GIRmax. Consistent with the GIR, the mean smoothed BG profiles were similar for all three insulin aspart formulations (Fig. 1D).
Pharmacodynamic Endpoints
90% and 95% CI for the pairwise treatment ratios.
GIRmax is based on smoothed GIR profiles (LOESS method, tension 0.06).
GIR, body weight standardized glucose infusion rate; GIR-AUC0–12h, area under the body weight-standardized GIR rate versus time curve from 0 to 12 hours; GIRmax, maximum smoothed body weight standardized GIR; LOESS, locally weighted regression in smoothing scatter plots.
The clamp was stopped prematurely, due to BG levels having reached the predefined criteria threshold (≥200 mg/dL for 30 min) in 17, 18, and 15 subjects after administration of SAR-Asp, NN-Asp-US, and NN-Asp-EU, respectively. The mean end duration of euglycemia was 7.09, 7.24, and 7.24 h after dosing for SAR-Asp solution, NN-Asp-US, and NN-Asp-EU, respectively (Table 4).
Performance of Clamp During Euglycemia a
Euglycemia starts with dosing and ends with the last value of the smoothed BG concentration curve ≤105 mg/dL [5.8 mmol/L]. Clamp level (BG target) was 100 mg/dL [5.5 mmol/L].
BG, blood glucose; CV, coefficient of variation.
Clamp quality was assessed using several recommended parameters (Table 4). Individual mean BG during euglycemia showed mean values of 100.06, 100.59, 100.10 mg/dL for SAR-Asp, NN-Asp-US, and NN-Asp-EU, respectively. The individual CV% of BG measurements during euglycemia showed median values of 6.60%, 6.40%, and 5.75% for SAR-Asp, NN-Asp-US, and NN-Asp-EU, respectively. Similarly, the mean absolute difference between individual mean BG measurements and the BG target level was 0.47 mg/dL for SAR-Asp, 1.14 mg/dL for NN-Asp-US, and 0.53 mg/dL for NN-Asp-EU.
Safety and tolerability
Single doses of the three insulin aspart products were well tolerated, with few AEs. Treatment-emergent adverse events (TEAEs) were reported in 3 of 29 subjects following administration of SAR-Asp, in 1 of 30 subjects following administration of NN-Asp-US, and in 4 of 30 subjects following administration of NN-Asp-EU. The most commonly reported TEAE was vomiting, reported by three subjects (one subject each following administration of SAR-Asp, NN-Asp-US, and NN-Asp-EU). There was one TEAE of severe intensity (joint dislocation while playing sport 1 day after administration of NN-Asp-EU), no deaths, and no subject experienced a TEAE that led to study discontinuation. All AEs were resolved by the end of the trial. One injection site reaction TEAE (erythema at injection site) was reported following administration of SAR-Asp. The event was rated as mild in intensity and resolved spontaneously.
Discussion
In this single-dose crossover study in subjects with T1D, SAR-Asp insulin aspart solution for injection demonstrated similar pharmacokinetic exposure and glucodynamic activity to commercially available insulin aspart formulations, as assessed by the euglycemia clamp technique.
The design of this study, using a single-dose crossover design and a euglycemic clamp procedure, is consistent with regulatory guidance for the development of biosimilar insulins. 8 A similar design was used for a study, in which similar insulin exposure and pharmacodynamic activity was demonstrated for the rapid-acting insulin lispro biosimilar/follow-on product SAR342434 compared with its US-and EU-approved marked products. 12 Exposure was assessed from insulin concentration-time profiles while insulin activity was assessed as glucose utilization in a euglycemic clamp setting. The crossover design allowed each subject to receive all three treatments, so that a comparison among the three treatments could be made on the same subject. The Williams design, 15 which consists of three treatments and three periods (3 × 3) in six sequences, is an ideal choice when there are three treatments in a bioequivalence study, especially given the short half-life of the insulins tested in this study that allowed complete washout between drug administration in the three treatment periods. Consistent with previous clamp studies evaluating prandial insulins, 12,16 the study was conducted without the use of a basal insulin to assess the biosimilarity among SAR-Asp, NN-Asp-US, and NN-Asp-EU without confounding additional insulin exposure from basal insulin products. Standardization of clamp technique and factors influencing insulin sensitivity such as time of day, physical activity, food intake/diet, avoidance of alcohol, caffeinated drinks, smoking, or medication other than the study medication are all important factors to be considered in undertaking a successful clamp study. 8
The 0.3 U/kg dose of SAR-Asp and commercially available insulin aspart formulations used in the study permitted effective pharmacokinetic and pharmacodynamic characterization and comparison; this dose is well characterized to provide strong effects in the euglycemic clamp (i.e., glucose demand reflected in a sizable GIR up to 12 h) in subjects with T1D, 17,18 is recommended in current guidelines for the development of biosimilar insulins, 8 and is consistent with prior insulin aspart clamp studies. 17,18
Consistent with current guidelines, 14 the quality of the clamp performance was measured by several parameters, including the duration of euglycemia, the individual mean of BG concentration, clamp precision (BG fluctuation from the clamp), and the control deviation (mean difference of individual mean BG measurements from the target clamp level). Individual mean BG during euglycemia had mean values between 100.06 and 100.59 mg/dL, indicating that the BG was controlled with very small mean deviation from the target clamp level of 100 mg/dL. In addition, clamp precision, as reflected by the median CV% of individual BG measurements during euglycemia, ranged from 5.75% to 6.60%, indicating low BG fluctuation and precise BG control at the clamp target level. This was supported by the low mean absolute difference between the individual mean BG and the target BG level between 0.47 and 1.14 mg/dL, showing that the control at the clamp target level was also well achieved on an individual basis. These findings are indicative of successful performance of the euglycemic clamp technique with BG control close to the clamp target throughout the study. 14 Overall clamp quality was consistent with findings observed in previous studies. 12 The within-subject variability of exposure and activity across the three clamps was low, indicating high day-to-day reproducibility, and is comparable to data from other rapid-acting insulin analogs. 12,19 –21
Strengths of the current study include its crossover design using single subcutaneous doses that enables the subjects to act as their own control, along with enrolment of subjects with T1D that allows comparison of exogenous insulins with respect to glucose-lowering effect without interference from endogenous insulin. 22 Investigator related bias was avoided by the automated glucose clamp procedure and the use of a double-blind design. An inherent limitation of the euglycemic glucose clamp technique to assess the pharmacodynamic properties is the requirement for standardized and well-controlled conditions (e.g, a long fasting period, wash-out of current insulin, absence of basal insulin, and administration of a fixed dose). In this regard, the set-up and performance of the clamp technique is aimed at optimizing the sensitivity for identifying potential differences between the investigated insulins rather than at establishing real-life conditions. 13 Another potential limitation was that the study population only included males. Restriction of studies to males alone is considered acceptable, as insulin sensitivity in women may vary during the menstrual cycle. 8
Conclusion
In summary, SAR-Asp demonstrated similar pharmacokinetic exposure and glucodynamic activity to commercially available insulin aspart formulations, supporting further clinical evaluation of SAR-Asp as a biosimilar/follow-on product.
Footnotes
Acknowledgments
We thank Xavier Benain, Anne Lehmann, Peter Bunning, Baerbel Rotthaeuser, Reinhard Becker, and Irma Slomp, all employed by Sanofi, for their assistance during the conduct and analysis of this study.
Author Disclosure Statement
C.K. is an employee and co-owner of Profil which has received research funds from ADOCIA, Biocon, Boehringer Ingelheim Pharmaceuticals, Inc., Dance Biopharm Holdings, Inc., Eli Lilly and Company, Gan & Lee Pharmaceuticals, MedImmune, Mylan, Nordic Bioscience, Nestlé, Novo Nordisk A/S, Poxel SA, Sanofi-Aventis, Wockhardt, Xeris Pharmaceuticals, Inc., Zealand Pharma A/S. L.N. is an employee of Profil Neuss. W.S., L.T. and I.N. are employees of Sanofi.
Funding Information
This study was funded by Sanofi. The funder participated in trial design, data collection, and analysis.
Supplementary Material
Supplementary Table S1
Supplementary Figure S1
Supplementary Figure S2
References
Supplementary Material
Please find the following supplemental material available below.
For Open Access articles published under a Creative Commons License, all supplemental material carries the same license as the article it is associated with.
For non-Open Access articles published, all supplemental material carries a non-exclusive license, and permission requests for re-use of supplemental material or any part of supplemental material shall be sent directly to the copyright owner as specified in the copyright notice associated with the article.