
Abstract
Background:
Titration of basal insulin led by either the physician or the patient is not well understood in India. This analysis of Indian subset of Asian Treat to Target Lantus Study (ATLAS) compared effectiveness of patient-led with physician-led titration of once-daily insulin glargine 100 U/mL (Glargine-U-100) in patients with type 2 diabetes mellitus (T2DM) uncontrolled on oral antidiabetes drug (OAD).
Methods:
In this open-label parallel group study, randomized patients (either physician-led or patient-led [self-titration] group) followed the same dose titration algorithm (fasting blood glucose [FBG] target 110 mg/dL [6.1 mmol/L]). The primary endpoint was change in mean glycated hemoglobin (HbA1c) at week 24 in the patient-led group versus the physician-led group.
Results:
Patients (40–75 years) were randomized to either the physician-led group (n = 39) or the patient-led group (n = 36). At week 24, self-titration led to a greater decline in HbA1c than physician-led titration (−1.3% vs. −1.1%). Mean decrease in FBG was more in the patient-led group than in the physician-led group (−53.7 mg/dL vs. −35.5 mg/dL). Mean daily dose of Glargine-U-100 at week 24 was higher in the patient-led group than in the physician-led group (30.0 U vs. 23.8 U). At any time during the study, 30.6% and 7.7% of patients in the patient-led and physician-led groups, respectively, showed target HbA1c level of <7.0% without severe hypoglycemia. Treatment satisfaction and quality of life improved in both groups. Overall, treatment was safe and well tolerated, and none of the events led to treatment discontinuation.
Conclusion:
Patient-led adjustment of Glargine-U-100 in outpatient setting can be a safe and effective method for glycemic control in Indian patients with T2DM uncontrolled on OADs.
Introduction
Diabetes is a major global public health concern and has been recognized as the biggest epidemic of the 21st century. India is ranked second in the world with more than 72.9 million people affected by type 2 diabetes mellitus (T2DM), and this number is expected to reach 134 million by the year 2045. 1
The management of diabetes is multifactorial, and evidence from the landmark UK Prospective Diabetic Study (UKPDS) suggests that early and tight glycemic control helps in reducing the rates of clinical complications. 2,3 The progressive nature of diabetes prompts early intervention with insulin therapy when glycemic targets are not achieved with noninsulin therapies. 4,5 However, chances of hypoglycemia remain one of the major concerns in initiating insulin-mediated therapy. 6 –8 The advent of novel insulins, such as insulin glargine 100 U/mL (Glargine-U-100), has attempted to address the concerns of hypoglycemia. To improve glycemic control with minimal incidence of hypoglycemia with novel insulins, various algorithms for patient self-management have been developed and assessed with the physician-led algorithms. 9 –13 Patient-led titration has shown relatively better improvement in glycemic control than physician-led titration. 14,15 However, there is a lack of larger studies from Asian countries to compare the titration regimens. Therefore, the Asian Treat to Target Lantus Study (ATLAS) was designed and conducted to examine the safety and benefits of Glargine-U-100 titration regimen in patient- versus physician-led management setup. 16 The consolidated results of the ATLAS showed that compared with physician-led titration, a simple patient-led titration algorithm confers significantly improved glycemic control with a low incidence of severe hypoglycemia. 14
Indian population has apparent phenotypic and possible pathophysiological differences in T2DM presentation. 17 The PARADIGM study that evaluated the differences between non-Asian, Asian Indian, and East Asian patients with T2DM with respect to initiation and intensification of insulin therapy showed that the Asian Indians, in general, have the least improvement in glycemic excursion, despite having a similar mealtime insulin ratio and a higher dose of insulin. 17 Moreover, in India, for most patients receiving insulin therapy, dose titration is carried out by physicians. 18 Therefore, the findings from the present subgroup analysis of the ATLAS will provide information on the diabetes self-management capabilities of Indian patients with T2DM. The study would also help to evaluate a treat-to-target approach in the Indian context and allow policymakers to devise and implement better health care interventions for the management of T2DM. The primary objective of the subgroup analysis was to compare the safety and benefit of patient-led titration (intervention group) with physician-led titration (usual standard of care) in optimizing the clinical use of Glargine-U-100 in Indian patients with T2DM uncontrolled on oral antidiabetes drugs (OADs). In addition, treatment satisfaction and health-related quality of life (HR-QoL) were also assessed.
Methods
Study design and patient selection
This was a 24-week, randomized, multicenter, multinational, open-label parallel-group study conducted in six Asian countries including seven centers in India. The study was conducted in accordance with the Declaration of Helsinki and the International Conference on Harmonisation guidelines for Good Clinical Practice, and each participating site ensured adherence to local regulations. All patients provided written informed consent.
Patients with T2DM (aged 40–75 years) who were being treated in a primary care setup, met the eligibility criteria, and provided written informed consent were enrolled in the study. The detailed study design is published elsewhere. 16 Patients were included in the study if they (1) were insulin-naive with T2DM for at least 2 years; (2) had suboptimal diabetes control (glycated hemoglobin [HbA1c] between 7% and 11% inclusive), despite receiving stable doses of two OADs for more than 3 months before randomization; (3) had body mass index (BMI) ≥20 and ≤40 kg/m2; and (4) were eligible to receive basal long-acting insulin for the control of hyperglycemia. The key exclusion criteria were as follows: patients with other than and/or previous use of insulin (except for previous treatment of gestational diabetes or brief treatment with insulin for <1 week); patients with current treatment with thiazolidinediones, current or previous use (within the last 3 months) of GLP-1 receptor agonists or GLP-1 analogues; currently receiving treatment with nonselective β-blockers; and patients with impaired renal function (serum creatinine ≥1.5 mg/dL [133 μmol/L] for males or ≥1.4 mg/dL [124 μmol/L] for females) or presence of macroproteinuria (>2 g/day).
Randomization and study procedure
At the baseline visit (week 0) after a 2-week screening period, patients were randomized (1:1) to either physician-led insulin administration or patient-led intervention group. Randomization was performed via a validated, centralized, concealed interactive voice response system. 19 Each patient was assigned a unique treatment identification number based on their order of enrollment in their group. In brief, this was an open-label study in which the study medication (Glargine-U-100) and prescribed oral glucose-lowering drugs were made available at patient's local pharmacy with standard labeling compliant to local regulatory specifications.
Glargine-U-100 dose was adjusted using an algorithm in both treatment groups from an initial once-daily subcutaneous self-administration (8–10 U/day in the abdomen at bedtime, preferably between 9:00 p.m. and 11:00 p.m.) to achieve desired fasting blood glucose (FBG) levels (70 < FBG ≤110 mg/dL [3.9 < FBG ≤6.1 mmol/L]) (Table 1). This algorithm was developed to complement the needs of the study population and prevailing medical practice. In physician-led titration group, basal insulin dose was adjusted at each visit by a physician, whereas in patient-led titration group, patients self-adjusted their basal insulin dose every 3 days on the basis of the middle value of the last three consecutive FBG values. Patients were allocated a blood glucose (BG) meter (Accu-Chek® Performa, manufactured by Roche) and a patient diary at the time of screening (visit 1; week 2) and instructed on their proper use. They were also trained on the administration of Glargine-U-100 through Lantus® SoloSTAR® pen. Both treatment groups continued to receive OADs at existing doses.
Treatment Titration Algorithm for Insulin Glargine
Occurring independent of the FBG and defined as symptoms of hypoglycemia responding to ingestion of carbohydrate or an episode associated with a BG level ≤5.6 mg/dL (≤3.1 mmol/L). Small departure from the titration scheme was allowed (e.g., decrease of insulin glargine dose) based on investigators judgment and patients situation.
BG, blood glucose; FBG, fasting blood glucose.
Assessments and data collection
All patients were assessed at baseline and follow-up visits conducted at 2, 6, 12, 16, and 24 weeks after the initiation of Glargine-U-100 therapy. The effectiveness data were collected at prespecified time intervals for FBG, postprandial glucose (PPG), HbA1c, 7-point BG profile, daily insulin dose, body weight, hypoglycemic events, adverse events (AEs), and medications administered. Detailed assessment methods have been published previously. 14,16 The safety data included treatment emergent adverse events (TEAEs); however, hypoglycemia events were not included during safety reporting.
Treatment satisfaction and HR-QoL were assessed using validated Diabetes Treatment Satisfaction Questionnaire status (DTSQs) and European Quality of Life-5 Dimension (EQ-5D) questionnaire and European Quality of Life-Visual Analogue Scale (EQoL-VAS) scores. 20 –22
Statistical analysis
Statistical methods were performed according to validated models and presented elsewhere. 14 Changes in data points from baseline to 24th week were analyzed descriptively. Continuous variables were summarized using either mean ± standard deviation or median and range. Categorical variables were presented as frequencies and percentages. Since the data present subgroup of global ATLAS, no inferential statistical analysis was performed.
Results
Demographics
Of 75 patients enrolled across various centers in India, 36 patients were randomized to patient-led treatment arm and 39 patients to the physician-led treatment arm. Baseline demographics and characteristics were similar in the patient-led and physician-led groups (Table 2). The mean age of patients was 51.9 ± 7.1 years, and BMI was 27.9 ± 3.6 kg/m2; patients were predominantly men (62.7%, 47/75), with the mean diabetes duration of 8.5 ± 5.3 years. The mean oral glucose-lowering treatment duration was 6.8 ± 5.2 years, and the mean HbA1c was 9.1% ± 1.1%. The pattern of OADs at baseline showed that most patients (97.3%, 73/75) were receiving dual OADs. Of this, majority (90.7%, 68/75) were taking a combination of biguanides and sulfonylureas. Metformin (98.7%, 74/75) was the frequently prescribed biguanide and the corresponding sulfonylurea was glimepiride (60%, 45/75).
Demographic and Baseline Characteristics of Patients Randomized to the Patient-Led Versus Physician-Led Insulin Titration
Values are presented as mean ± SD, unless otherwise specified.
Hypoglycemia is expressed in n of patients with ≥1 hypoglycemic episodes.
BMI, body mass index; DPP-4, dipeptidyl peptidase 4; HbA1c, glycated hemoglobin; OAD, oral antidiabetes drug; PPG, postprandial glucose; SD, standard deviation.
HbA1c and other BG parameters
A substantial decrease in HbA1c relative to baseline was observed in both treatment groups as early as week 12 (Fig. 1A). The mean HbA1c at week 24 was 7.7% ± 1.3% in the patient-led group and 8.1% ± 1.0% in the physician-led group. The decrease in HbA1c from baseline to 24 weeks was greater in the patient-led group than in the physician-led group (−1.3% vs. −1.1%; Supplementary Table S1).
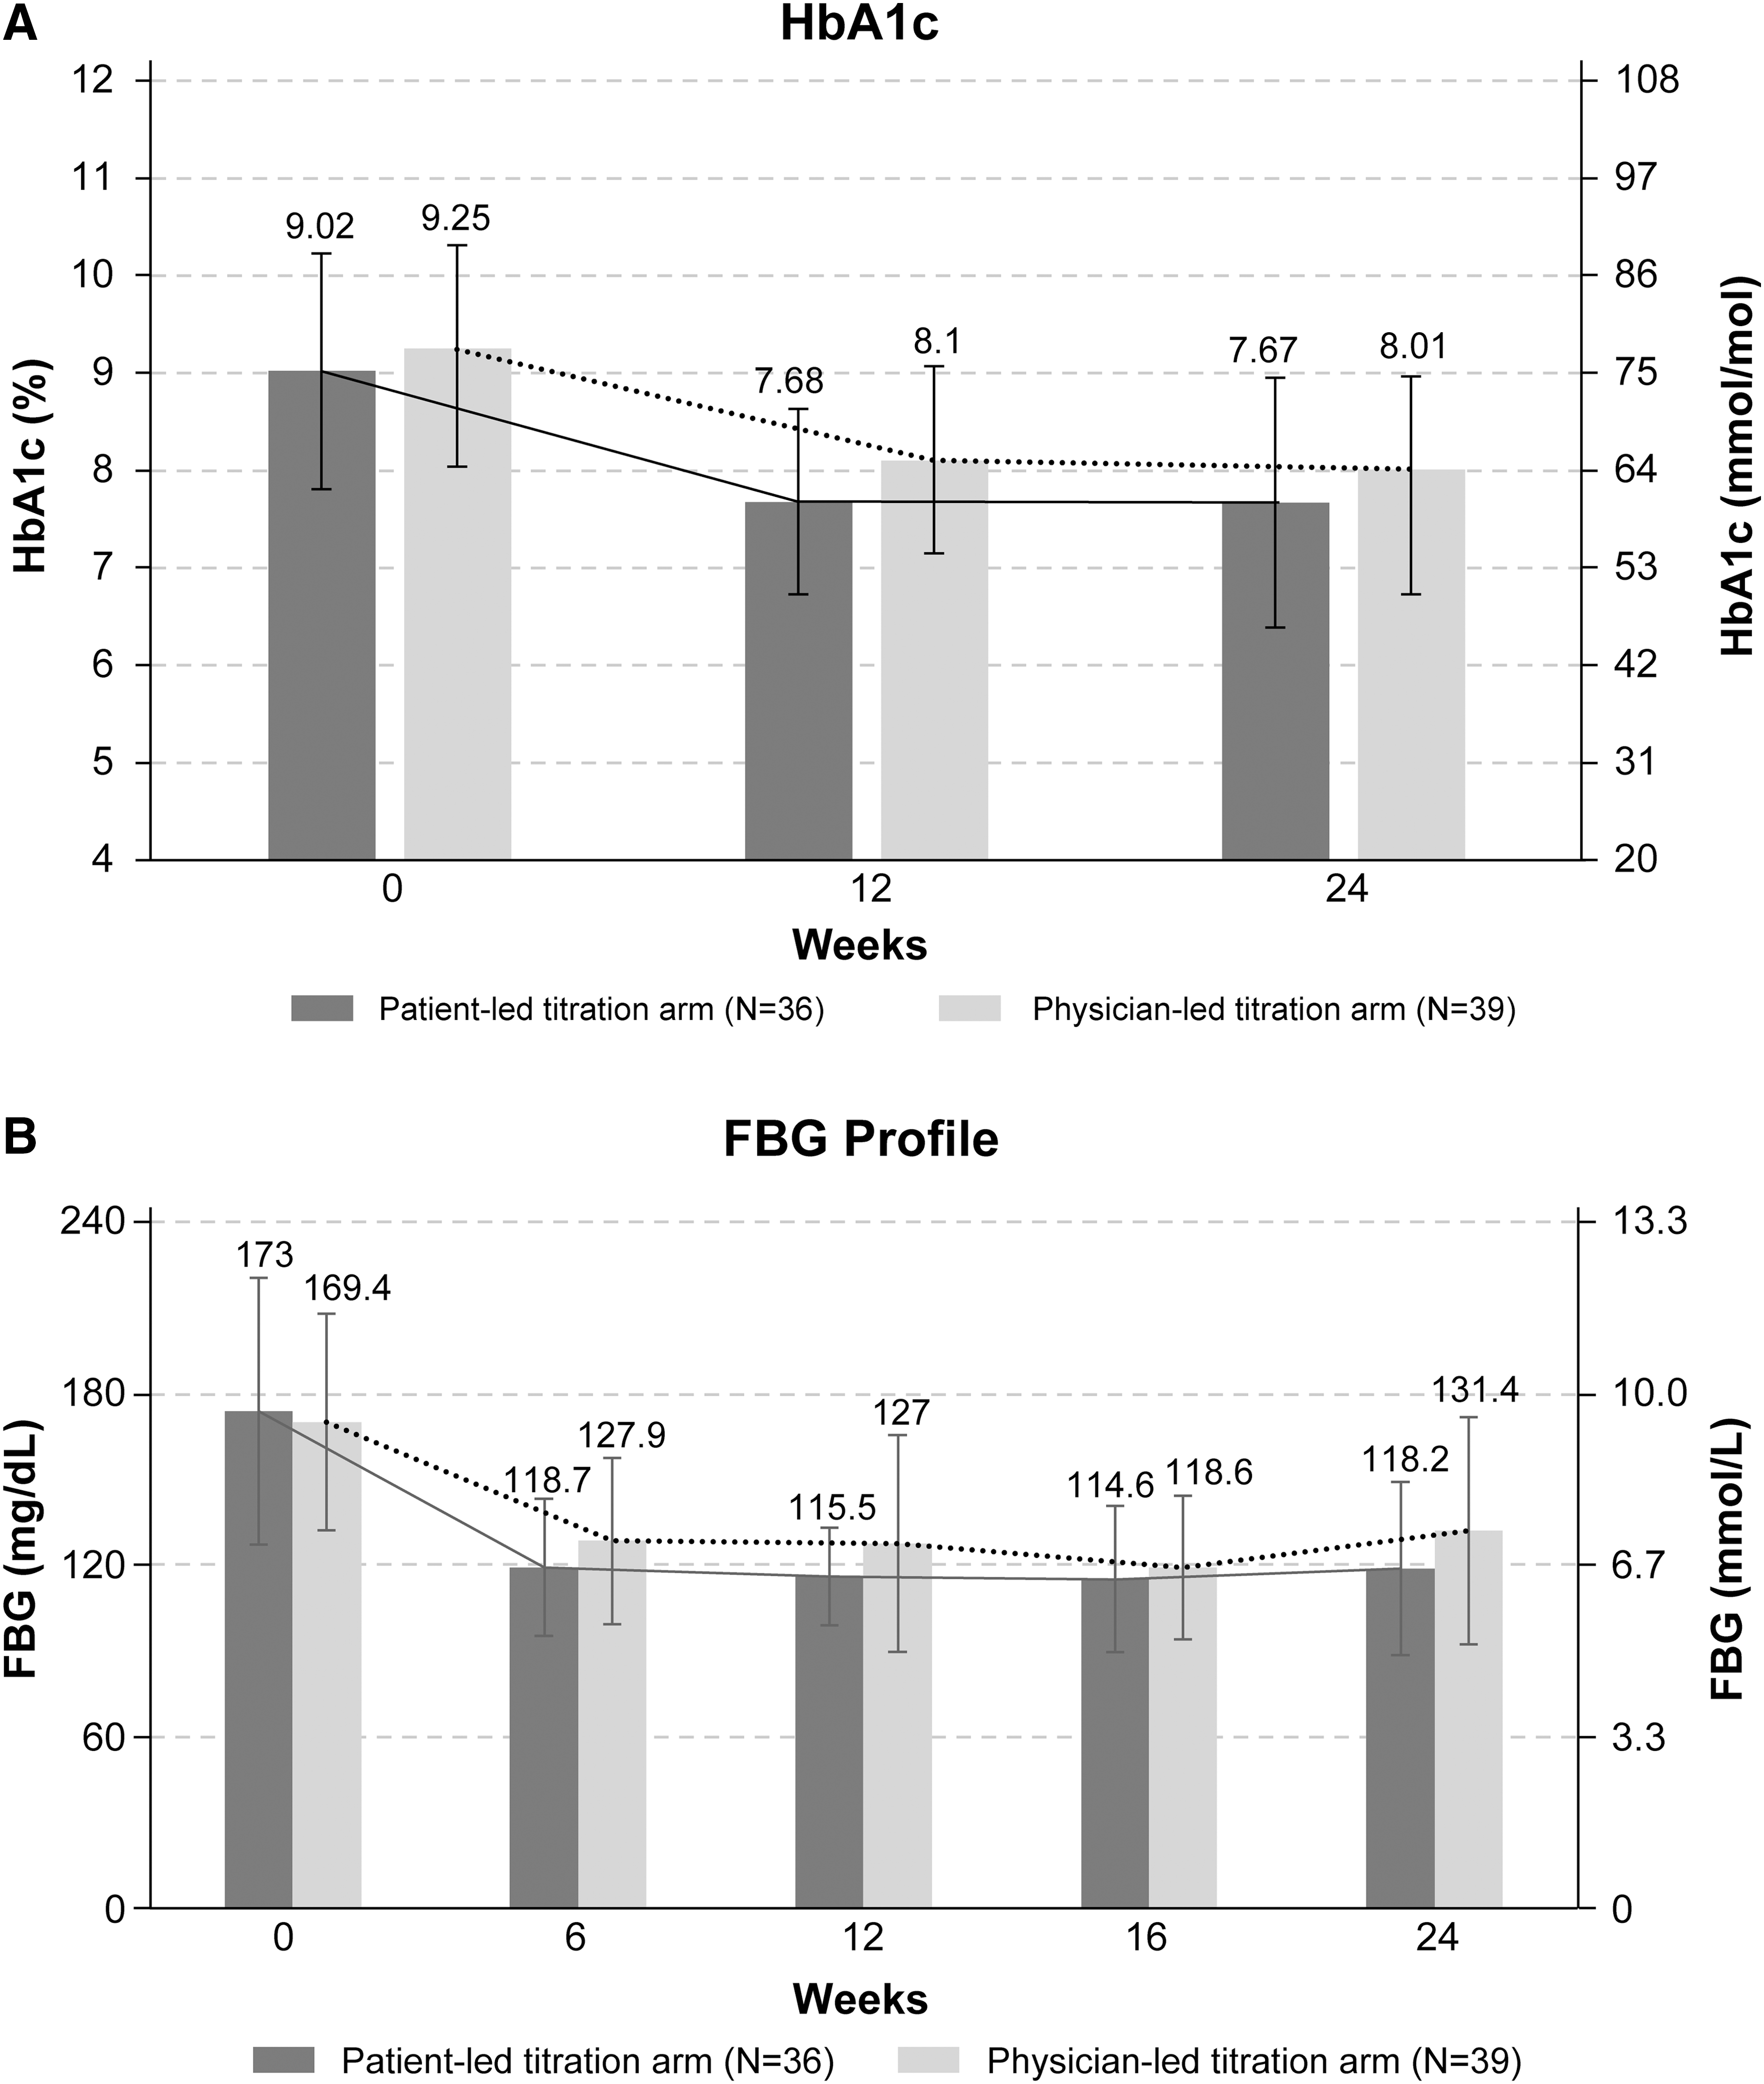
At any time during the study, target HbA1c level of <7.0% was achieved without severe hypoglycemia in 30.6% (11/36) and 7.7% (3/39) patients in the patient-led and physician-led groups, respectively. Overall, the proportion of patients achieving target HbA1c (without severe hypoglycemia) of <7% was higher than those achieving HbA1c of <6.5% (18.7% [14/75] vs. 6.7% [5/75]) at any time during the study. Both patient-led and physician-led groups witnessed almost a similar drop in HbA1c of ≥0.5%, at any time throughout the study. The proportion of patients who experienced a drop in HbA1c of ≥1.0% at any time during study was greater in the patient-led group than in the physician-led group (61.1% vs. 56.4%) (Table 3).
Glycemic Control, Hypoglycemia, Insulin Dosage, Weight Change, and Patient-Reported Outcomes at 24 Weeks
Values are presented as mean ± SD, unless otherwise specified.
DTSQs, Diabetes Treatment Satisfaction Questionnaire status; EQ-5D, European Quality of Life-5 Dimension; EQoL-VAS, European Quality of Life-Visual Analogue Scale.
The mean FBG levels in the patient-led and physician-lead groups at week 24 were 118.1 ± 30.0 mg/dL (6.6 ± 1.7 mmol/L) and 131.2 ± 39.4 mg/dL (7.3 ± 2.2 mmol/L), respectively (Fig. 1B). Similarly, the mean PPG levels in the patient-led and physician-led groups at week 24 were 180.1 ± 40.0 mg/dL (10.0 ± 2.0 mmol/L) and 186.4 ± 55.3 mg/dL (10.4 ± 3.1 mmol/L), respectively. The changes from baseline in blood glucose parameters at different time points are presented in Supplementary Table S1.
The mean 7-point BG values for both patient-led and physician-led groups at baseline are shown in Figure 2. The mean 7-point BG values in the patient-led arm were lower than the corresponding values in the physician-led arm at each time point (Fig. 2).
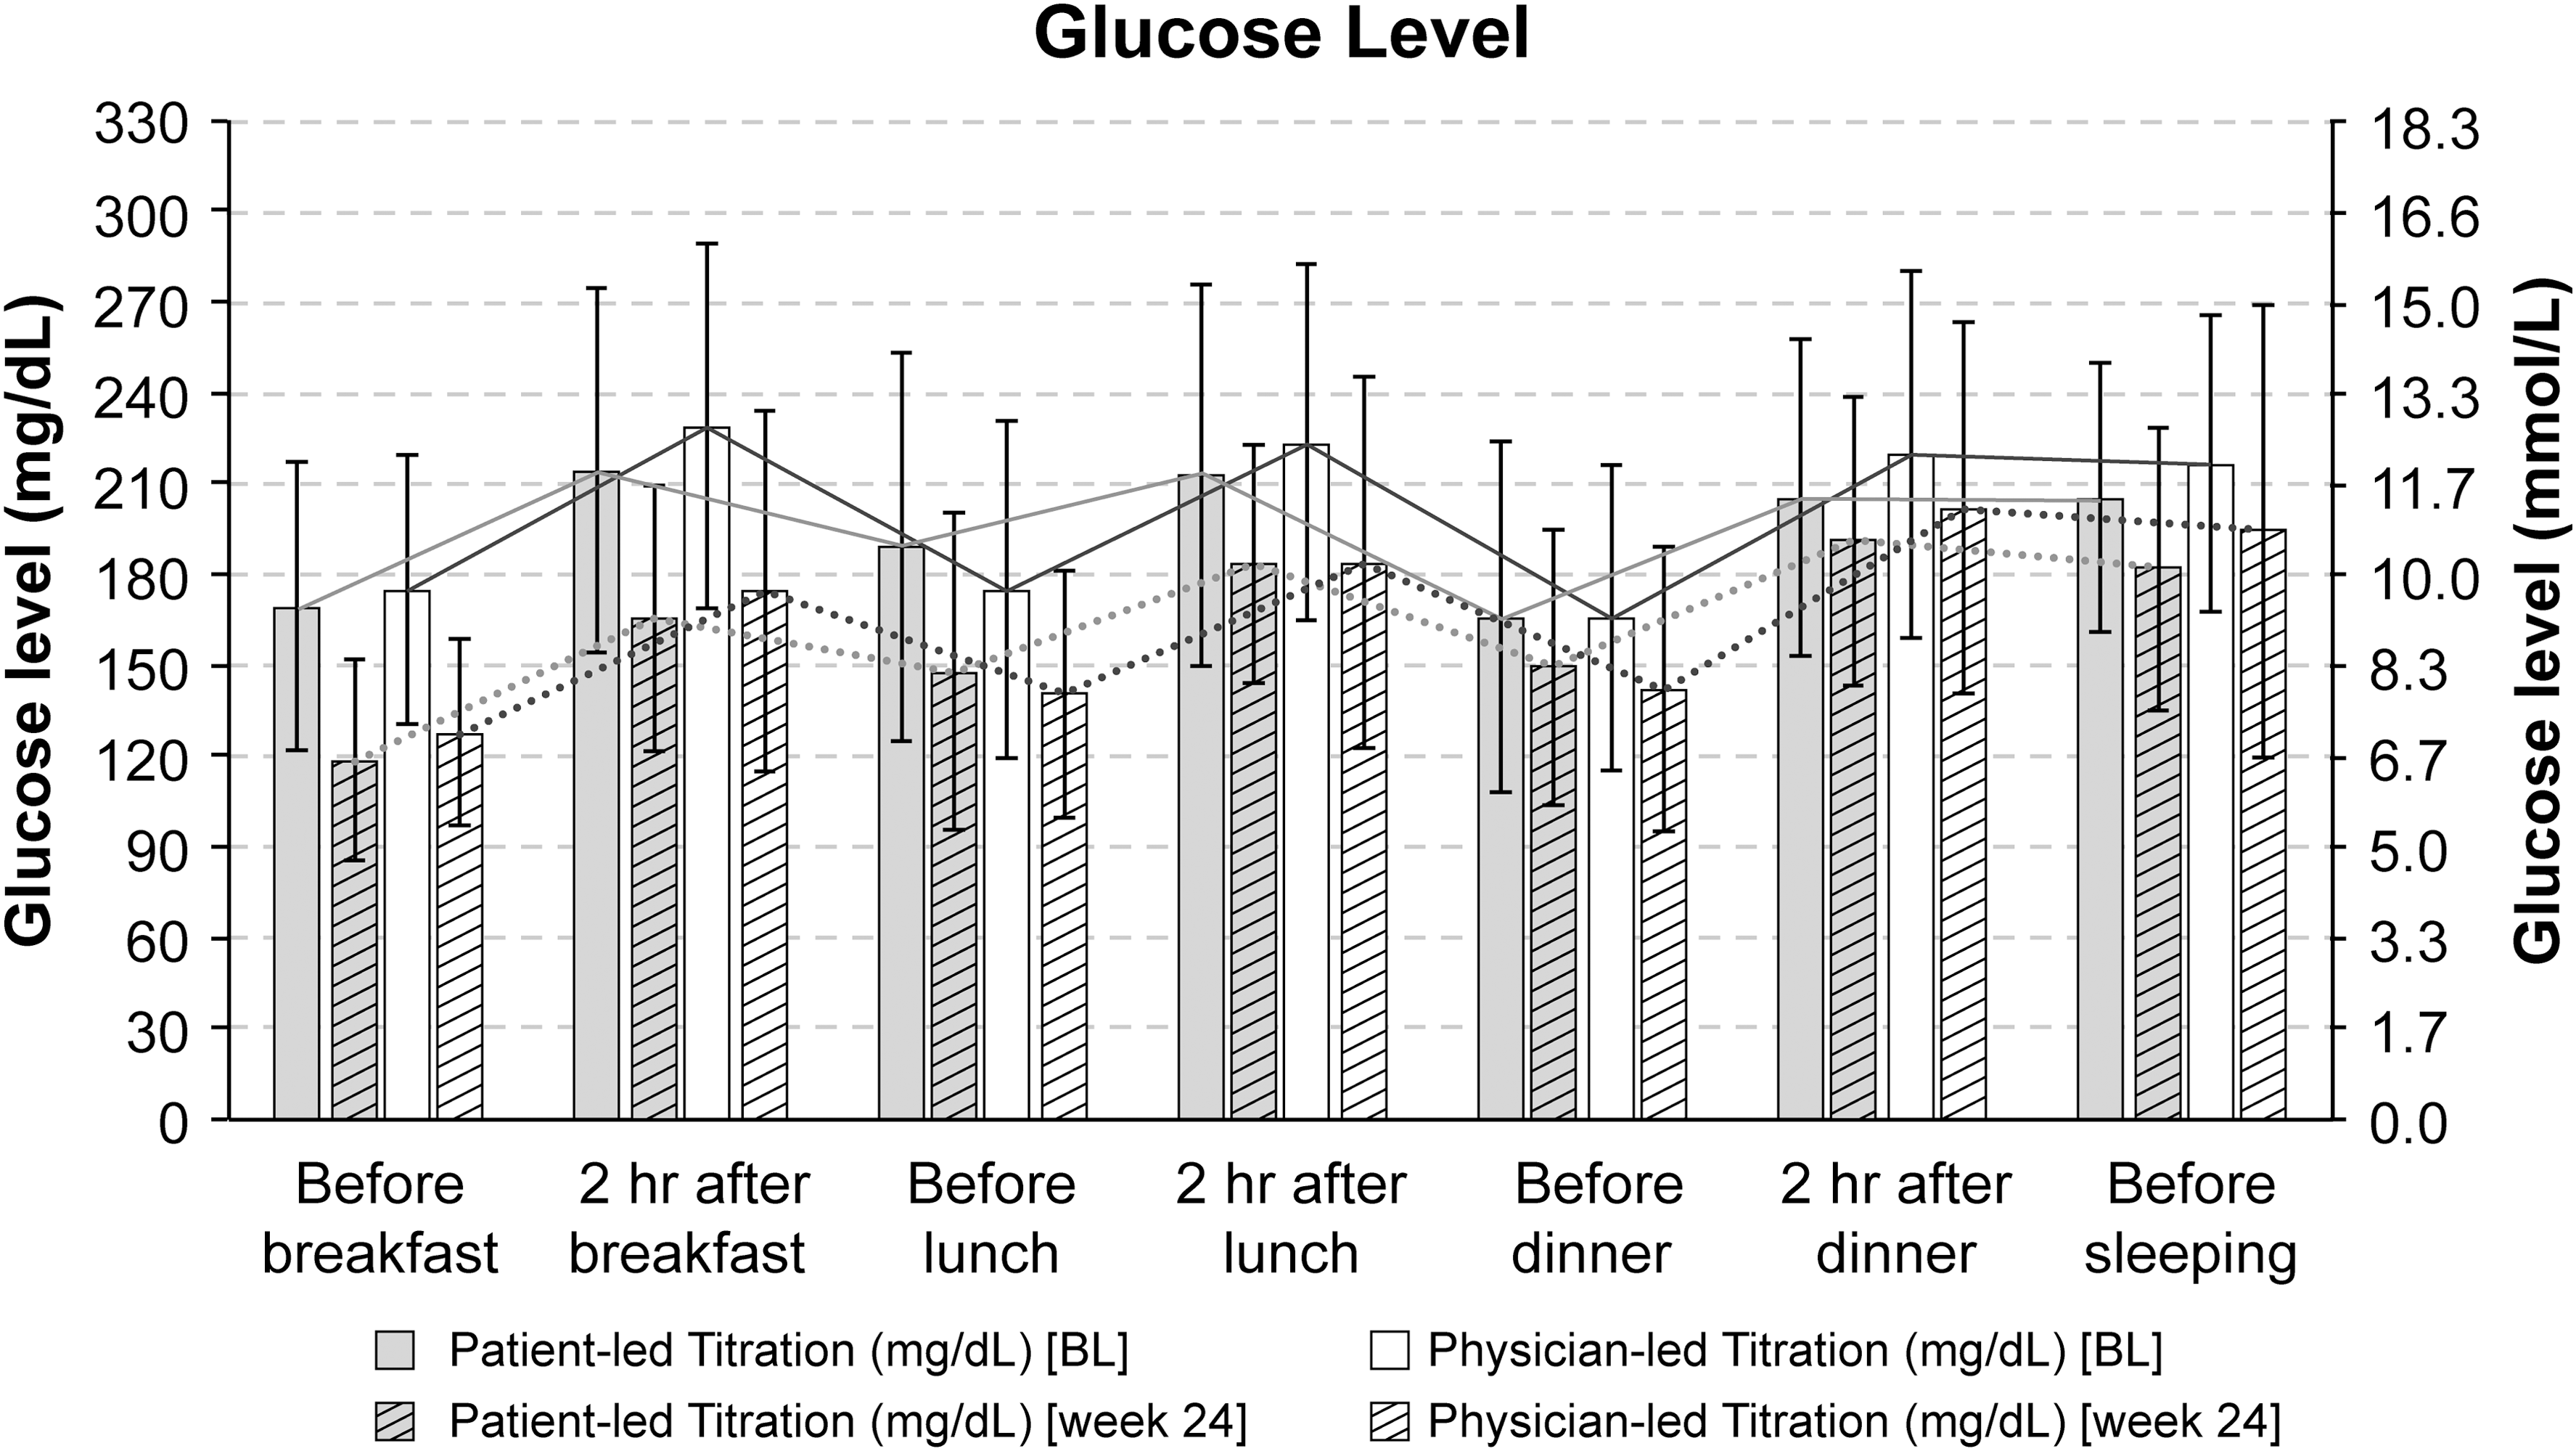
Seven-point BG profiles (mean ± SD) at baseline and at week 24. BG, blood glucose; SD, standard deviation.
Glargine-U-100 dose
Glargine-U-100 doses were titrated more in the patient-led group than in the physician-led group. The mean daily dose of Glargine-U-100 at week 24 was higher in the patient-led group than in the physician-led group (30.0 U, range 20.0–38.0 vs. 23.8 U, range 15.0–32.0) (Table 3). The mean changes in Glargine-U-100 doses in both groups over the period of data collection are presented in Figure 3.
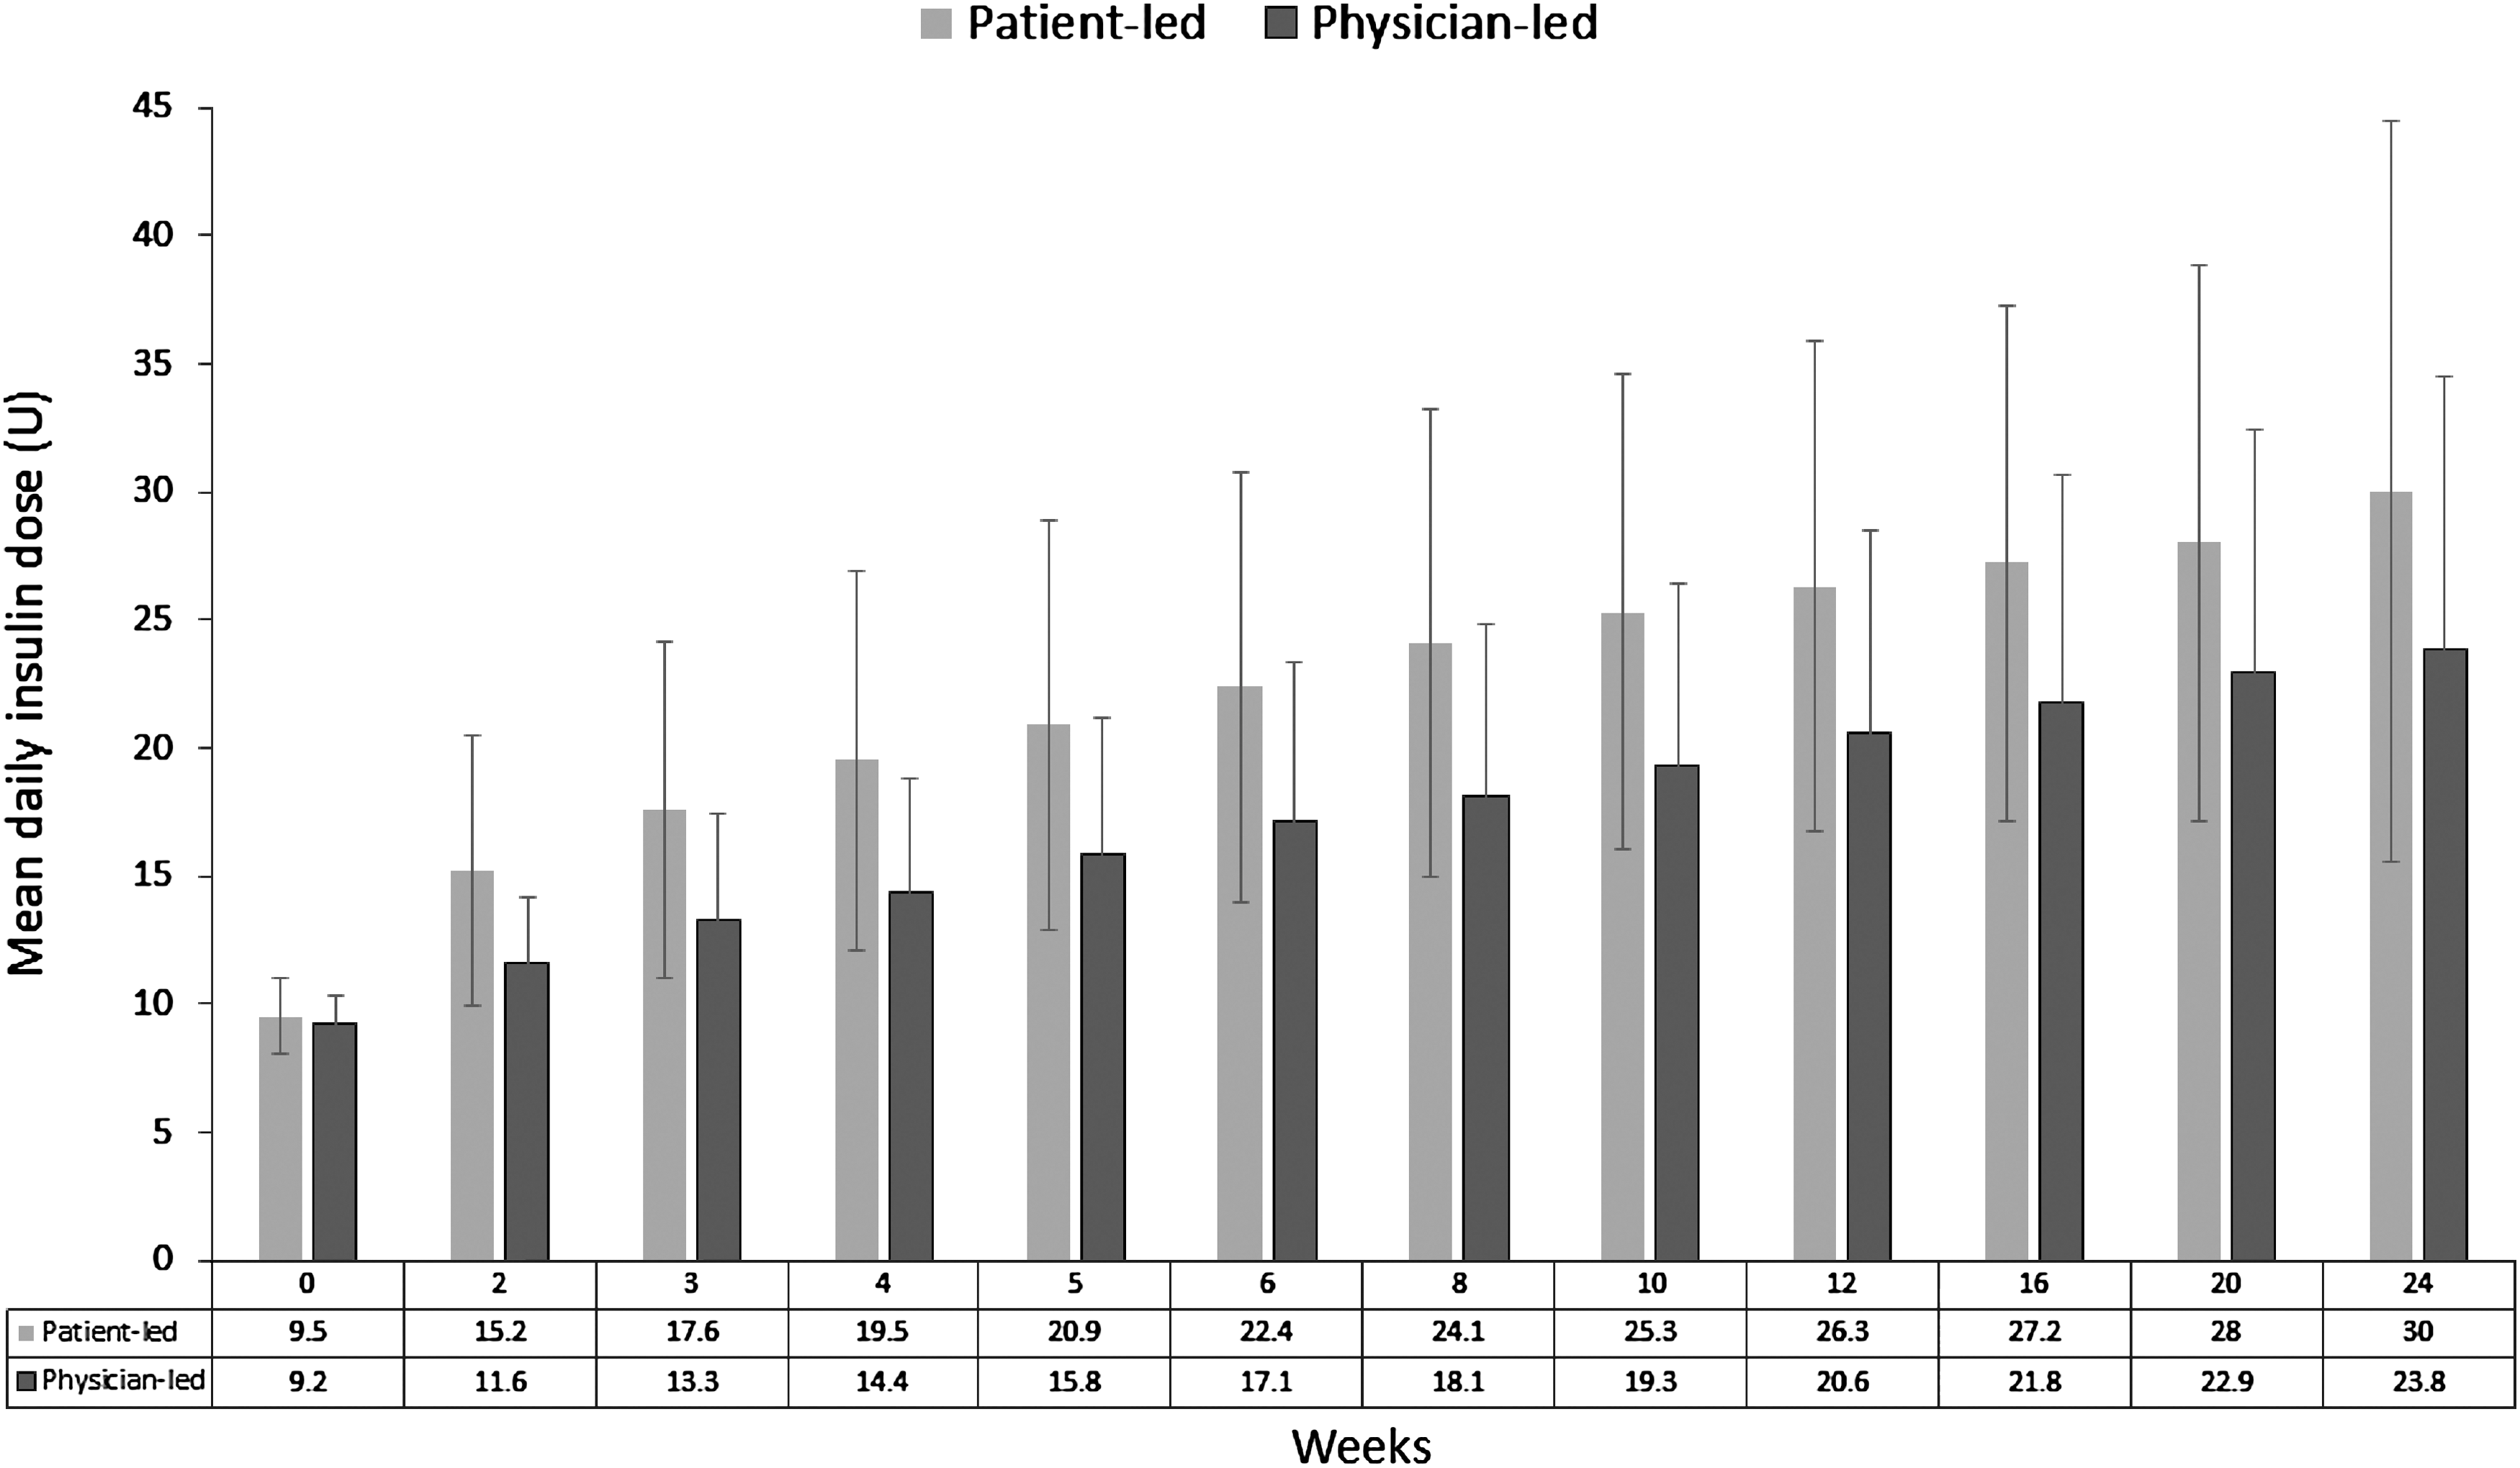
Mean change in insulin dose from baseline.
Body weight
There was a small (<1 kg) increase in weight from baseline in both treatment groups. The mean change in weight from baseline was similar in both groups (Table 3).
Hypoglycemia
A total of 12 hypoglycemia episodes were noted with more frequent incidences of symptomatic, nocturnal, and asymptomatic episodes in the patient-led group (Table 3). None of the patients experienced severe hypoglycemia.
Treatment satisfaction
Treatment satisfaction was found to improve in both groups. The increase in DTSQs score from baseline to week 24 was numerically higher in the patient-led group than in the physician-led group (4.4 vs. 1.6, respectively). Overall, DTSQs increased by +2.8 points at week 24 in both groups. At week 24, the mean EQ-5D health utility scores increased (+0.03) in the patient-led group indicating good health status, whereas the score decreased in the physician-led group (−0.063). An increase in EQoL-VAS scores was also observed in both treatment groups at week 24 (Table 3).
Safety
Overall, 30.1% (22/73) of patients experienced at least one TEAE: 37.1% (13/75) in the patient-led group and 23.7% (9/38) in the physician-led group. Gastrointestinal disorders were the most common (9.6%, 7/22) TEAE observed. One patient experienced serious AE in physician-led titration group, which was possibly related to treatment. None of the events led to treatment discontinuation (Table 4).
Percentage of Patients Experiencing Treatment Emergent Adverse Events (>5%)
TEAEs do not include hypoglycemia events.
TEAE, treatment emergent adverse event.
Discussion
ATLAS is the first large randomized study to examine the optimization of basal insulin titration in Asian population with uncontrolled T2DM. 14 Once-daily dose of Glarine-U-100 at bedtime consistently over a period of 24 weeks with ongoing OADs improved the glycemic status in terms of HbA1c, FBG, and PPG in Indian patients, without significant impact on body weight. These effects were noticeable as early as 12 weeks. The patient-led titration group achieved greater glycemic control with a higher percentage of patients attaining target HbA1c of ≤7.0% without hypoglycemia than the physician-led group.
The findings of the present study are comparable with the results from the global ATLAS trial. The HbA1c values at week 24 in the patient-led group in the present study and the global ATLAS trial were 7.7% versus 7.3%, respectively. 14 The reduction in HbA1c was also comparable to the AT-LANTUS study where patients self-titrated basal insulin (glargine) dose using FBG-based algorithm. The reductions in HbA1c in the patient-led titration in the present study and the AT-LANTUS study were −1.40% and −1.2%, respectively. 13 Results from this subgroup analysis are comparable to other studies where basal insulin dose was titrated using simplified FBG-based algorithms. The FBG, at the end of the study in Indian patients, was comparable with that seen in the treat-to-target (TTT) trial of insulin glargine in patients with T2DM (124.5 mg/dL vs. 117 mg/dL, respectively). However, the overall improvement in HbA1c achieved with insulin glargine was lesser in the Indian subgroup than in the TTT trial (7.8% vs. 6.96%, respectively). 23 These comparisons indicate that patients with T2DM in India show similar trend of glycemic improvement in other countries when guided for insulin self-titration.
The algorithm used in the ATLAS has been tested in several other studies such as the Initiate Insulin by Aggressive Titration and Education (INITIATE), TTT, Implementing New Strategies with Insulin Glargine for Hyperglycemia Treatment (INSIGHT), and Treat to Target with Once-Daily Insulin Therapy (TITRATE). In these studies, up- and down-titration of the initial dose of 10 U/day effectively and safely achieved target FBG levels within a range of 70–110 mg/dL. 12,23 –25 As a result, considering FBG and HbA1c as target, guidelines such as the American Diabetes Association/European Association for the Study of Diabetes (ADA/EASD) and the American Association of Clinical Endocrinologists/American College of Endocrinology (AACE/ACE) recommended 10 U/day as starting dose of insulin. 4,26 The AACE/ACE guidelines state that the dose should be adjusted at regular and short intervals to achieve target glucose levels while avoiding hypoglycemia. 26 Since most of the guidelines encourage patient-centered approach of insulin titration and self-management of their diabetes, this algorithm may serve as a simple and easy way to achieve BG control.
In line with international organizations, the Indian National Consensus Group developed the Indian insulin guidelines aimed at timely initiation and intensification of insulin therapy. 27 Subsequently, the Improving Management Practices and Clinical Outcomes in Type 2 Diabetes (IMPACT) study was conducted that enrolled 20,653 patients with T2DM from 885 centers across India. 28 In this study, the difference in the mean daily dose of insulin at initiation versus at follow-up of 26 weeks was only 0.8 U; weekly titration for achieving HbA1c <7% was carried out in only 51.1% of patients, of whom 8.9% performed titration by themselves, thereby showing a lack of optimization of insulin doses. In this context, using insulin management algorithm results from the present study in Indian subgroup can effectively address optimization and self-titration issues related to the use of insulin. The present study can also help physicians to empower patients to manage BG on their own leading to the effective management of T2DM in India.
At 24 weeks, the dose of Glargine-U-100 was substantially higher in the patient-led group than in the physician-led group. This is concordant with the global ATLAS and AT-LANTUS studies where successful glycemic control was achieved with greater increases in daily Glargine-U-100 dose in the patient-led group than in the physician-led group. 13,14 This could be the reason for achieving near-target glycemic control in the patient-led group relative to the physician-led group. However, the increased insulin dose might have contributed to the observed increase in hypoglycemic events in the patient-led group compared with the physician-led group. The full analysis 14 indicates that BMI and sulfonylurea dose were predictors of hypoglycemia events across all participating countries, except India. Also, rates of nocturnal and symptomatic hypoglycemia were lower in India than in other countries. 14 Overall, the treatment was safe and effective, with the low incidence of hypoglycemia in both treatment arms.
The patient satisfaction scores consistently improved over the period of 24 weeks in both treatment groups. This trend corroborates with that observed in other countries in the ATLAS and indicates that Indian patients with T2DM can optimize/manage insulin self-titration without affecting treatment satisfaction and/or quality of life.
The major limitation of this subgroup analysis is small study population to make any statistical inference; therefore, extrapolation of the results in real-world clinical setup needs to be performed cautiously. In the study population, the group receiving sulfonylureas were perhaps at a heightened risk of weight gain and fluid retention. However, we could not measure the risk in those receiving and not receiving sulfonylureas. In addition, the dose adjustments (if any) of metformin or sulfonylureas were not recorded during this study. Another important limitation in our study is that we could not collect the data on education level, socioeconomic status, and if the patients had minimal understanding/education of diabetes, which could have implications in the outcomes in the patient-led titration group. However, all the study sites, and therefore, the patients were given adequate training to titrate as per algorithm provided in the protocol. Additionally, titration forms were filled to determine if titration was carried out correctly. Apart from descriptive statistics, there was no statistical test performed to analyze any correlation or noninferiority and therefore is a limitation.
Conclusion
This study is one of the first steps to translate a treat-to-target approach in a bigger community in India and allow to initiate future studies with advanced algorithms of self-monitored BG. The pattern of increase in the mean daily dose of insulin glargine over the course of 24 weeks in the patient-led versus physician-led arms suggests that Indian patients can be empowered to self-titrate insulin glargine. Furthermore, the interpretations from this study warrant detailed investigation on the effectiveness of treatment algorithms for the management of T2DM in Indian context.
Footnotes
Acknowledgment
The authors would like to thank the study participants, their family and caregivers who were involved in this study. Editorial support in the preparation of this publication was provided by Amrita Saxena and Leena Patel of Jeevan Scientific Technology Limited (Hyderabad, India) and paid for by Sanofi. Editorial support in the preparation of this publication was also provided by Anahita Gouri and Rohan Mitra of Sanofi, India. The authors individually and collectively are responsible for all content and editorial decisions and received no payment from Sanofi directly or indirectly (through a third party) related to the development/presentation of this publication. This study was funded by Sanofi.
Data Sharing Statement
Qualified researchers may request access to patient-level data and related study documents including the clinical study report, study protocol with any amendments, blank case report form, statistical analysis plan, and data set specifications. Patient-level data will be anonymized, and study documents will be redacted to protect the privacy of trial participants. Further details on Sanofi's data sharing criteria, eligible studies, and process for requesting access can be found at
Author Disclosure Statement
R.G. and A.W. are employees of Sanofi. All other authors declare no conflict of interest.
Supplementary Material
Supplementary Table S1
References
Supplementary Material
Please find the following supplemental material available below.
For Open Access articles published under a Creative Commons License, all supplemental material carries the same license as the article it is associated with.
For non-Open Access articles published, all supplemental material carries a non-exclusive license, and permission requests for re-use of supplemental material or any part of supplemental material shall be sent directly to the copyright owner as specified in the copyright notice associated with the article.