
Abstract
Background:
Diabetes devices provide data for health care providers (HCPs) and people with type 1 diabetes to make management decisions. Extracting and viewing the data require separate, proprietary software applications for each device. In this pilot study, we examined the feasibility of using a single software platform (Tidepool) that integrates data from multiple devices.
Materials and Methods:
Participating HCPs (n = 15) used the software with compatible devices in all patient visits for 6 months. Samples of registration desk activity and office visits were observed before and after introducing the software, and HCPs provided feedback by survey and focus groups.
Results:
The time required to upload data and the length of the office visit did not change. However, the number of times the HCP referred to the device data with patients increased from a mean of 2.8 (±1.2) to 6.1 (±3.1) times per visit (P = 0.0002). A significantly larger proportion of children looked at the device data with the new application (baseline: 61% vs. study end: 94%, P = 0.015). HCPs liked the web-based user interface, integration of the data from multiple devices, the ability to remotely access data, and use of the application to initiate patient education. Challenges included the need for automated data upload and integration with electronic medical records.
Conclusions:
The software did not add to the time needed to upload data or the length of clinic visits and promoted discussions with patients about data. Future studies of HCP use of the application will evaluate clinical outcomes and effects on patient engagement and self-management.
Introduction
N
Diabetes health care providers (HCPs) play a critical role in helping patients interpret diabetes device data. Historically, HCPs have been encouraged to review device data with patients and families during routine clinic visits, after downloading the data in the office or asking patients to download at home using software provided by the device manufacturers. 8,9 However, HCPs are challenged by the time and resources required to download, review, and interpret the data during clinic visits, as well as through remote interactions by telephone or video telemedicine visits. 10 It has been proposed that HCPs may be reluctant to prescribe or encourage technology such as CGM because of their own lack of comfort with interpreting data, time constraints, and perceived disruption to clinic workflow. 11 Tools that improve the integration of diabetes device data from multiple, discrete sources (i.e., different brands of glucose meters, insulin pumps, and CGM) are needed for optimal diabetes management, since lack of interoperability may be a significant barrier to device use for patients and providers. 12,13 Standard device software, reported device statistics, and common definitions and metrics are critical to optimize use of technology by providers and patients, to make clinical decisions, and to evaluate outcomes. 11,14
In addition to reviewing device data during clinic visits, many HCPs strive to educate their patients on how to use their data on their own at home to perform self-management tasks such as adjusting insulin doses, carbohydrate ratios, insulin sensitivity factors, or changing the timing of boluses with eating or exercise. 4 –6 However, HCPs may struggle with how to discuss data and engage their patients, which is especially challenging during the adolescent period. Despite HCP efforts, only a small minority of patients download and review their diabetes data from their devices, for reasons that include not knowing that they could look at their data, how to download the data, and what to do with the information. 15 To empower patients to use their diabetes data on their own, HCPs need tools that facilitate education about how patients can use data and apply information learned to their daily lives.
To address the need for tools to assist HCPs in reviewing, discussing, and increasing patient engagement with device data, we performed a pilot feasibility study of a software platform designed to collect and display diabetes device data in one interface. The Tidepool platform collects data from multiple device vendors, and the Tidepool web application presents the data in a device-agnostic manner. 16 As part of the process of introducing new software into clinical practice, it is important to assess acceptability of the technology by end-users. According to the Technology Acceptance Model (TAM), in health care settings, successful implementation of technology is dependent on perceived usefulness (how much the technology will enhance job performance), perceived ease of use (the degree of effortlessness of utilization of the technology), subjective norms (social influence of important others about use of the technology), and facilitating conditions (beliefs about infrastructure, resource constraints, skills, and opportunities to use the technology). 17 –21 The objective of this pilot study was to examine the use of the Tidepool software applied to real-world clinical practice, evaluate the effect of this software platform on clinic workflow and discussion of diabetes data during clinic visits, and to determine acceptability among HCPs, using the TAM constructs of perceived usefulness and ease of use. These results will provide pilot data that will help improve the software and HCP experience, which can lead to subsequent research studies with larger groups of HCPs in different settings to evaluate clinical impact and the effect on diabetes outcomes.
Materials and Methods
Data visualization application
The Tidepool software and data platform for collection and visualization of diabetes data have been previously described.
16,22
A universal “Uploader” application
23
collects data from many commercially available glucose meters and all conventional insulin pumps and CGM devices, and it stores the data in secure, HIPAA-compliant cloud storage. Devices that are supported by the system are listed on the Tidepool website (
Further details about clinican use and features of the Tidepool software can be found in the clinician overview on the Tidepool website (
Participants and practice setting
All participants were HCPs who were actively seeing patients with T1D using diabetes devices, at a tertiary, multidisciplinary pediatric diabetes center. At baseline, at this center, it was the general practice that registration desk staff (medical assistants and administrative assistants) upload data from all patients' diabetes devices at check-in for each clinic visit. This has typically been done using device manufacturers' proprietary software, and printed hardcopies of the data have been given to the HCP for use in each visit. For this study, HCP participants included physicians (faculty and clinical fellows), nurse practitioners, certified diabetes educators (CDEs), and any other providers (e.g., registered dietician and transition care coordinator) who used diabetes data in their interactions with patients. HCPs had to have at least one in-person clinical encounter with a patient for which they used glucose data, or at least one telephone or telemedicine encounter, in which glucose data were discussed, during the study period.
Procedures and study flow
The study was completed between June 2016 and August 2017, with baseline data collection in June–August 2016, active use of the application from October 2016 to April 2017, and follow-up data collection in May–August 2017 (Fig. 1). At baseline, HCP participants completed surveys on existing practices, current device software (comfort with and frequency of use), and their beliefs about the use of diabetes data. To understand how diabetes device data influenced clinic workflow, a small sample of at least 15 “check-in” encounters at the registration desk were observed to record the number of devices from which data were uploaded, the time spent uploading the devices, and any problems encountered. In addition, a sample of at least 20 HCP–patient encounters were observed in the clinic, in which the patient had T1D and was using an insulin pump, either with or without CGM.
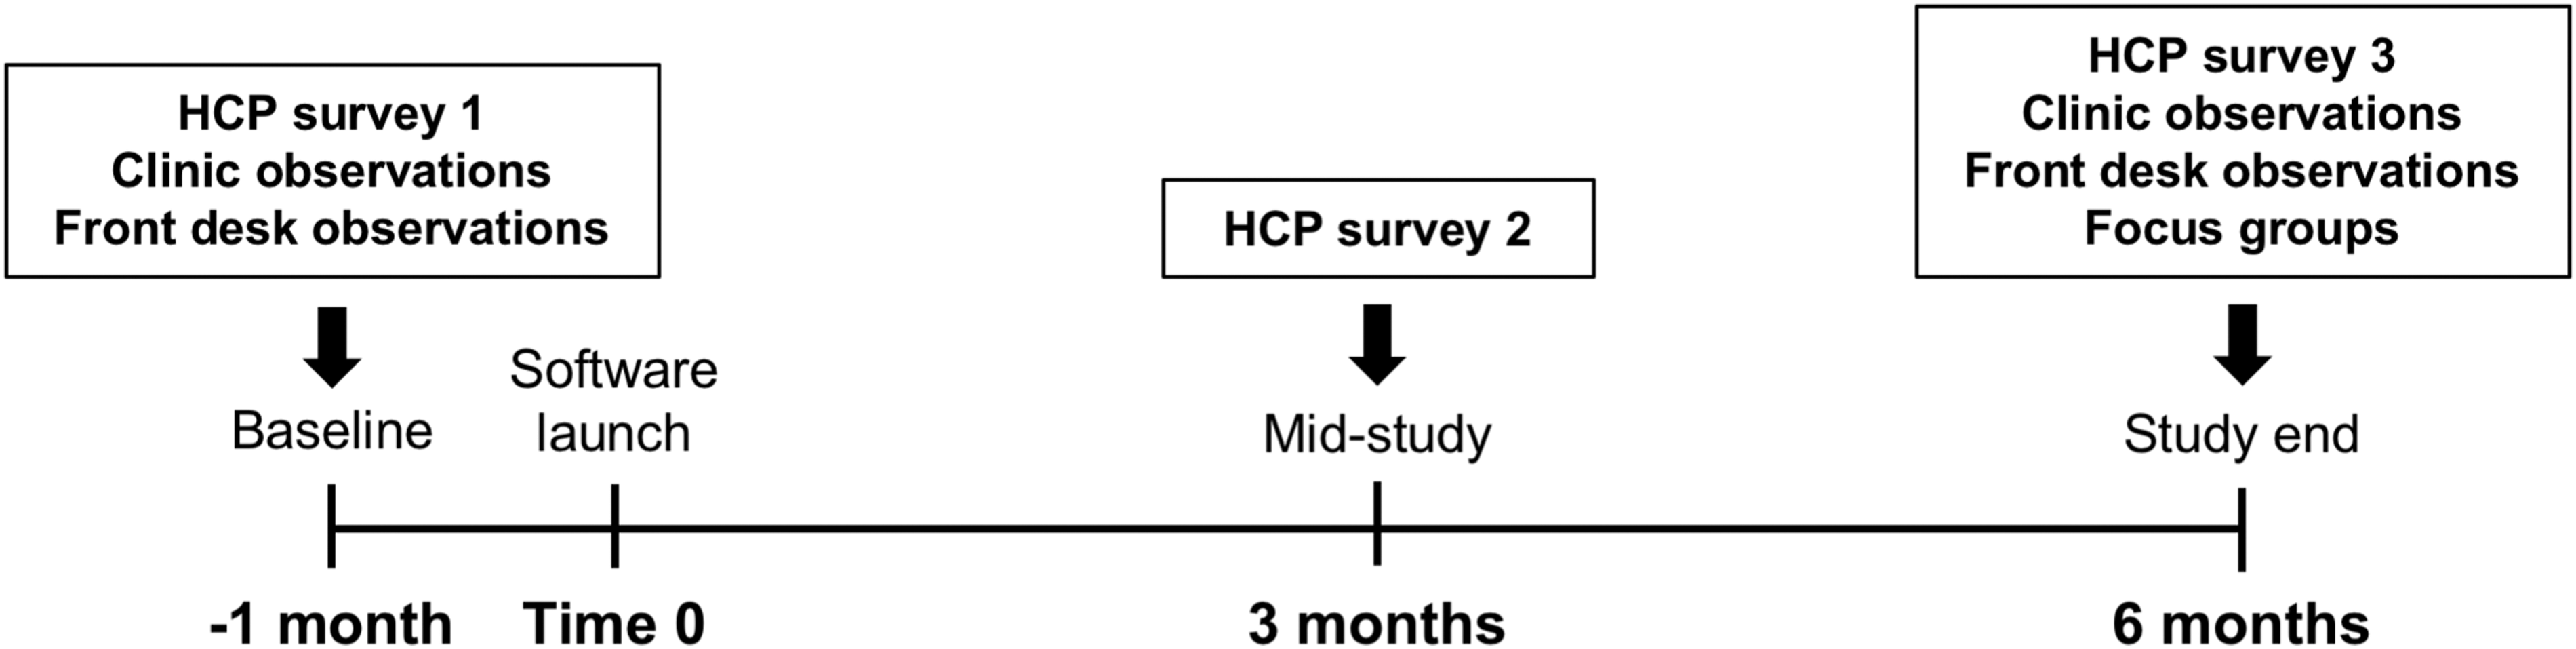
Study flow and timeline.
Once baseline data were collected, the new software application was launched in the clinic for all participants. HCPs were trained in a group in-service setting on how to use the visualization application. The registration desk staff members were also trained in an in-service session on how to register each patient for the software, and on how to upload data for each compatible device. During the study period, registration desk staff uploaded data from each device to the software for each patient during the check-in process. HCPs then used the software to review diabetes data during all office visits with patients whose devices were compatible with the software. They also had the option of accessing the software at any time outside of in-person clinic visits, for use between visits, such as telephone or telemedicine encounters. HCPs were given repeat surveys on device data and on the new application at 3 months (mid-study) and 6 months (study end) after the launch of the new software application. Samples of registration desk activity and HCP–patient encounters were again observed at study end.
The protocol and procedures were approved by the Institutional Review Board at the University of California San Francisco. All HCP participants and observed patients provided informed consent (or assent, if minors) for participation.
Measurements and observations
Data were obtained from HCPs by surveys at baseline, mid-study, and at the end of the study. At baseline, HCPs provided demographic data (gender, decade of age, provider type, years in practice, and average number of patients seen per month). They were asked about their frequency of using diabetes data in clinic visits, how they typically viewed it, and their preferred data formats. At baseline, HCPs were also asked about comfort with and ease of use of existing device software. During and after the study, they were asked about the utility of the new application.
Observational data were collected from a sample of patient encounters at the registration desk and from a sample of patient encounters at baseline and at the end of the study, which were representative of the entire clinic population. At the beginning of the study, the primary researcher (J.C.W.) met with research assistants (Z.I., S.S., M.N., and J.M.) to create standard observation “checklist” forms for registration desk and patient encounters. Research assistants observed activities without interacting with participants. Initially, direct ethnographic observation of each encounter was performed by two research assistants simultaneously but indepedently, and their notes were compared and discussed with the primary researcher to achieve uniformity in how each research assistant conducted their observations. Once uniformity in observation was established, only one observer was needed for each encounter. Registration desk activities were observed but not audio recorded since most activities did not involve conversation or discussion. However, for clinic visits, after obtaining consent from the patient and family, the clinic visits were audio recorded.
Front desk measurements included patient variables (number and type of diabetes devices uploaded and use of CGM), time spent uploading the devices, and any problems encountered during the uploading process (short descriptions were recorded). Clinic visit observations included patient demographics (patient gender and age) and clinical characteristics (time since previous visit, use of CGM, frequency of blood glucose monitoring, and A1c) for each encounter. HCP activities (time spent in the examination room, time spent reviewing and discussing data, frequency of referencing data, and frequency of reviewing data before the face-to-face encounter) and if the child (≤18 years of age) looked the data on the computer screen were also recorded. To calculate time spent on any activity, the observer recorded the time (on the clock) of the start of the encounter and then noted clock time for each event of interest. Observers recorded short descriptions of activities or conversations leading up to the provider looking at the data, and they kept a tally of the number of times the provider referenced the data. They recorded short descriptions of how the data were used and what teaching points were discussed.
Focus group interviews
HCPs participated in focus group interviews at study end. Focus group interviews were held to understand HCP perspectives on using diabetes data in clinic visits, opinions of the new application, and suggestions for future development to address the TAM constructs of perceived ease of use and usefulness of the application. The group setting was chosen so that participants would be encouraged to share their opinions and be inspired by the comments of, and interactions with, others and so that many opinions could be gathered within a short period of time. 24,25 Two groups of seven to eight participants were held and moderated by the senior researcher, and two note-takers were present. A semi-structured, open-ended focus group guide was used, and topics included the purpose of diabetes data, the experience using the new software (how it changed management compared to existing software, the features that were most useful, any barriers to use), and how interactions with patients in the clinic and between visits were changed by the application. Each session lasted for 90 minutes, was audio-recorded, and transcribed. Focus group data were analyzed by thematic content analysis. 26 Through these methods, commonalities and differences in the data were identified, content was categorized, and conclusions were made around themes. 27,28
Results
Baseline use of diabetes data by HCPs
A total of 15 diabetes providers with various roles, numbers of years in practice, and size of patient panels participated in the study (Table 1). Before introducing the new software application into clinic workflow, participants were asked about their use and opinions of existing proprietary diabetes collection and visualization software that is provided by device manufacturers (Table 2 and Supplementary Table S1; Supplementary Data are available at
Provider Characteristics
Provider Usage and Opinions of Existing Diabetes Data Software at Baseline
n = 15.
EHR, electronic health record; HCP, health care provider.
In terms of data acquisition and presentation, 67% felt that automated device download was important, and 60% valued a standardized view of the data, but only 27% felt that it was easy to recognize patterns in the data given the existing software. At the beginning of the study, no HCPs viewed data in their native software on the computer routinely (“almost every time” or “every visit”) in clinic visits, and only a small minority of HCPs viewed data on the computer regularly (Table 2 and Supplementary Table S1). Instead, 47% of HCPs used printed hardcopies of the data reports at least “most of the time” in clinic visits, but only 27% expressed that it was “very important” or “essential” to use printouts.
Effect of the data collection and visualization application on registration process
A sample of activities at the registration desk of the clinic were observed at baseline before the new software was introduced (16 patient encounters) and after the data visualization application had been in use for 6 months (19 encounters; Table 3). Each observed patient who registered for their clinic visit had up to three diabetes devices (glucose meter, insulin pump, and/or CGM device), and the average number of devices was not significantly different between baseline and the end of the study. However, there were more CGM users in the encounters observed at the end of the study, although the difference was not statistically significant. The average amount of time required to upload data from all diabetes devices did not change with use of the new application.
Registration Desk Activity
CGM, continuous glucose monitoring; IQR, interquartile range.
Effect of the data visualization application on HCP–patient encounters
A sample of patient clinic visits with individual HCPs were observed at baseline (23 encounters) and at the end of the study (20 encounters) (Table 4). Most of the clinic encounters observed were of faculty physicians, but some visits were of clinical fellows, nurse practitioners, CDEs, or the transition care coordinator. The patients observed in these visits were similar with respect to age, gender, and the number and brands of devices used, at baseline and at study end, although more patients used CGM in the observations at study end (Table 4).
Characteristics of Observed Patient Visits
For continuous variables, mean (standard deviation) is shown. For categorical variables, percent is shown.
Once the new application was introduced, there were trends in how HCPs spent their time during patient visits and how they used device data (Table 5). Overall, the average amount of time the HCPs spent in the examination room and reviewing and discussing data was not statistically different after the new application was introduced. However, after using the new software platform, there was a trend toward having a larger proportion of HCPs review patient device data before entering the examination room to start the visit, although this was not statistically significant (36% at baseline, and 55% after the application was introduced, P = 0.26). In addition, the average number of times the HCP referred to the data with patients increased from 2.8 (±1.2) to 6.1 (±3.1) times per visit (P = 0.0002). Finally, a significantly higher proportion of the pediatric patients looked at the diabetes data with the new application compared with before it was introduced (61% before and 94% after, P = 0.015).
Provider Activity During Patient Visits
For continuous variables, mean (standard deviation) is shown.
For categorical variables, percent is shown.
It was of interest to note the topics that caused the provider to reference the diabetes data, and those were discussed as a result of the provider reviewing data, both before and after the new application was initiated. The most common topic discussed was glucose patterns that were identified in the data (52% of encounters at baseline, and 85% of encounters at 6 months), and providers frequently gave recommendations for changes in insulin pump settings (basal rates, insulin-to-carbohydrate ratios, and insulin sensitivity factors). Review of the data prompted providers to commonly recommend that the patient check glucose levels or give bolus insulin more often. At baseline, no providers discussed the use of extended boluses, but after 6 months, 15% of encounters included a discussion about extended boluses.
Perceived ease of use and usefulness of the data visualization application
During the study and at the end of the 6-month period, participants were again asked about use and importance of diabetes data collection and visualization software. Overall, there were no significant differences in opinions about data compared to baseline (data not shown). In addition, HCPs were asked their opinions about specific features of the new application, focusing on the perceived ease of use. On a scale of 1 (very negative) to 5 (very positive), on average, HCPs rated their experience with the application 4.5 (±0.7) and 4.6 (±0.5) overall, at 3 and 6 months, respectively. At 3 months, 82% found the process of learning how to use the application “easy” or “very easy.” As the study progressed, there was a trend toward HCPs reporting that it was easier to find the information they needed, with the percentage of those finding it “easy” or “very easy” increasing from 55% at 3 months to 88% at 6 months (P = 0.08). The majority of HCPs agreed or strongly agreed that the new software eased the process of many common HCP tasks with diabetes data, and these opinions did not change from 3 to 6 months (Supplementary Table S2).
Focus groups of all HCPs who participated were held at the completion of the study to understand opinions about the use of diabetes device data in general. Generally speaking, HCPs described using device data to find trends and patterns to determine if any changes in management are needed. When in clinic or receiving an advice telephone call from a patient or family member, HCPs wanted to have the device data in front of them so that they had a more concrete, objective view of the situation that the patient or family described. They preferred having access to many details about the data, including the number of blood glucose checks per day, the percentage of basal and bolus insulin used per day, and the frequency of insulin pump set changes, and they preferred to see all device data (glucose meter, insulin pump, and CGM data) in one place and not in multiple software applications.
Focus groups were also used to assess perceived usefulness of the new application specifically (Table 6). HCPs were generally positive about the new data visualization interface and liked the integration of data from multiple devices in one application. In particular, they liked the use of color to indicate if glucose levels were within (green), above (purple), or below (red) target range and found that children and families responded well to color and the visual display. The computer interface for viewing data enabled patients and families to be more engaged with the data, and HCPs remarked that having the device data on a screen in front of the family was a useful tool to generate discussions on management decisions. For example, after glucose patterns were identified and shown to patients, conversations were initiated about the context (carbohydrates eaten, physical activity, and illness) that led to the patterns, which prompted discussions about ways to prevent suboptimal glucose patterns in the future. Having data accessible in the clinic allowed HCPs to explain the rationale for suggestions to changes in management, including insulin dosing or pump settings. In addition, HCPs liked the ability to access patient device data remotely when patients uploaded data to the web-based application from home, which assisted HCPs in giving recommendations during telephone encounters and telemedicine visits.
Provider Perspectives
There were some challenges that the new application did not address that the HCPs described as suggestions for future innovation (Table 6). The new application did not solve the existing problem that data acquisition is not completely automated, and that most data must be actively uploaded by the patient from devices to be seen in the application. As a result, HCPs struggled with the fact that many families still did not have the necessary device cables, forgot their passwords, or simply did not have enough time to upload data from their devices at home. If a family did upload data, the application did not automatically alert the HCP, and HCPs had to ask families to notify them when data were uploaded and ready to review. HCPs felt that they had limited contextual data about activities, food content and composition, or other events that might have influenced glucose levels, even though the application has a feature that allows patients and caregivers to record notes in real time using their mobile devices that appear alongside data; this feature was infrequently utilized by patients. Despite this, although HCPs then had to ask the patients for more information, they found that the application was helpful in initiating these conversations. The HCPs acknowledged that data review took more time, and they desired to have mechanisms in place to document, bill, and receive compensation for the time spent on data review. Finally, the new application was not integrated with the electronic medical record, and HCPs found it cumbersome to log in to different applications to document the glucose patterns identified and management decisions that were recommended.
Discussion
In this pilot study of HCP use of a software application for review of diabetes device data in a clinical diabetes practice, we have shown that a new data visualization tool can promote discussions about, and can increase attention to, diabetes data, without having a significant impact on clinic flow or visit time. Successful introduction of new procedures or tools into clinic practice requires that there be minimal disruptions to clinic work flow in order for the technology to be accepted. 21,29 Our results showed that the software application did not require extra time for the registration desk staff, nor did it increase the length of the clinic visit. The presence of the software application in the clinic did change the way that providers used data in the visits themselves, increasing the average number of times the provider referred to or referenced the data in the visit. Importantly, this study was conducted in a pediatric clinic, where it can be a challenge to engage children and adolescents in reviewing their device data, even as adolescents are transitioning to being independently responsible for their care. 30,31 Our findings in this pilot study suggest that the software application can, in fact, increase interaction with data by both the provider and the pediatric patient, without having negative consequences on visit length or clinic flow. Further studies with larger cohorts of HCPs in multiple practice settings are needed. Follow-up studies will evaluate if increased interaction with data results in improved clinical outcomes, such as A1c or time in target range. 14 In addition, further human factors and usability studies 32 –35 looking at the interaction of the patient and provider with the software application will be important to identify the characteristics of the application (e.g., the computer interface, elements of the design, or integration of data) that are most widely used and are of highest value to providers and patients.
Using constructs from the TAM, we assessed perceived ease of use and perceived usefulness of the application by HCPs. The TAM has been used in previous studies of HCP acceptance of health information technology, including online training tools, telemedicine, and mobile applications assisting in decision support in clinic settings. 18 –21 Overall, HCPs perceived that learning to use the application and finding information were easy, and that sharing, reviewing, and communicating with patients about device and contextual data were made easier with the application. Focus group data showed that HCPs perceived the application to be useful in identifying glucose patterns, generating discussions, and educating patients about management decisions. Importantly, HCPs felt that the application was useful in engaging children and families in critically reviewing their data. These data suggest that many aspects of the application will likely be accepted with more widespread implementation to other clinic settings. However, it is important to recognize some remaining obstacles that may prevent wider adoption, which include the lack of universal automated device data upload and lack of integration of the application with the electronic medical record (specifically, the inability to easily transfer device data to clinic visit documentation).
In our study, HCPs found value in being able to easily access patients' diabetes device data. Increased access was due to integration of insulin and glucose data from multiple devices. The software successfully presented the data in a uniform, streamlined manner, which eliminated the need to cross-reference data from different software programs. It has been suggested that standardization of device data is needed for HCPs to understand patients' clinical status and make management decisions, and lack of standardization may contribute to inadequate glycemic control. 11 To this end, a proposed standardized profile of CGM data has been bundled with commercial CGM software, and a commercially available mobile application, which displays meter, pump, and CGM data in a standard, integrated manner, has been shown to improve frequency of blood glucose monitoring, uploading data from meters, and lower average glucose levels when used by patients. 36 –38 To add to the studies of data visualization software use in patients, this study explores the impact of a data integration and visualization tool by HCPs. While it is important to give patients ways to view their data on their own, as we have done previously, 22 it is equally important to equip HCPs with tools that allow them to effectively use data to make management recommendations for patients. HCPs also need tools to facilitate conversations about the data with patients, promoting patient education and empowerment about the use of data. With the rapidly changing landscape of diabetes technology and the increase in the amount and complexity of data available to users, for example, from flash glucose monitoring and hybrid closed loop systems, the need to understand and provide education about data is even more critical. Improved data collection and visualization may also enable HCPs to overcome barriers to prescribing devices and using data in clinic visits, which may lead to more optimal device and data use by patients, and ultimately to improved outcomes.
As a pilot feasibility study, the size and scope of this project was limited. We had a small sample size of HCPs, all practicing at the same pediatric diabetes clinic, and the majority of HCPs included were endocrinologists. Although we did have input from nurse practitioners and CDEs, future studies will need to focus on how educators use data visualization tools in a variety of patient practices. We were only able to follow HCPs for 6 months, and longer studies are needed to evaluate the long-term impact on the clinic and patient outcomes. In the current study, automated methods were not available to capture the amount of time spent on various activities (e.g., uploading data, using specific features in the software application, or discussing results), but these would be important in subsequent studies. This study did not evaluate patient clinical outcomes, such as glycemic control, which will be important in the future. Future trials should also identify the specific features of the application that have the most impact on quality of care, patient education, and HCP decision-making. These studies may include more comprehensive usability and human factors testing of the software user interface, 35,39 with comparison to other available data visualization tools. We anticipate that future clinical studies will address these issues, as well as patient-related factors such as engagement and self-management, and cost-effectiveness analysis of using a data integration tool in clinical practice.
In summary, our study shows the potential value of using a software application that integrates and standardizes diabetes device data from multiple sources in clinical practice. For HCPs, software that is standardized across devices can increase the ease of accessing, reviewing, and discussing data with patients. It may promote opportunities for education and teachable moments between HCPs and patients about diabetes data and facilitate data capture for remote patient care, such as telemedicine. For software developers, future challenges include automation of the data acquisition process, notifying users about new data or important glucose patterns, and seamless integration into clinic workflow and electronic health records.
Footnotes
Acknowledgments
The authors acknowledge the employees of Tidepool and members of the public who have contributed to the open-source Tidepool platform. The authors are grateful for the staff, patients, and families at the Madison Clinic for Pediatric Diabetes who made this study possible.
Author Disclosure Statement
This study was funded, in part, by a grant from JDRF to Tidepool for integration of the Tidepool platform with clinical use. Z.I., S.S., M.N., and J.M. report no conflicts of interest. J.C.W., A.B.N., and S.A. are volunteers on the medical advisory board of Tidepool, but do not have a direct role in development of Tidepool's software products and have no financial interests in the company. J.C.W. has received grants from Dexcom, Inc., outside of the scope of this study. A.B.N. has received research grant support from Cisco Systems, Inc. S.A. owns publicly traded shares in Dexcom, Inc. and Tandem Diabetes Care, Inc. J.C.W. is supported by NIH K23DK107894.
References
Supplementary Material
Please find the following supplemental material available below.
For Open Access articles published under a Creative Commons License, all supplemental material carries the same license as the article it is associated with.
For non-Open Access articles published, all supplemental material carries a non-exclusive license, and permission requests for re-use of supplemental material or any part of supplemental material shall be sent directly to the copyright owner as specified in the copyright notice associated with the article.