
Abstract
Background:
The potential clinical benefits of continuous glucose monitoring (CGM) have been recognized for many years, but CGM is used by a small fraction of patients with diabetes. One obstacle to greater use of the technology is the lack of simplified tools for assessing glycemic control from CGM data without complicated visual displays of data.
Methods:
We developed a simple new metric, the personal glycemic state (PGS), to assess glycemic control solely from continuous glucose monitoring data. PGS is a composite index that assesses four domains of glycemic control: mean glucose, glycemic variability, time in range and frequency and severity of hypoglycemia. The metric was applied to data from six clinical studies for the G4 Platinum continuous glucose monitoring system (Dexcom, San Diego, CA). The PGS was also applied to data from a study of artificial pancreas comparing results from open loop and closed loop in adolescents and in adults.
Results:
The new metric for glycemic control, PGS, was able to characterize the quality of glycemic control in a wide range of study subjects with various mean glucose, minimal, moderate, and excessive glycemic variability and subjects on open loop versus closed loop control.
Conclusion:
A new composite metric for the assessment of glycemic control based on CGM data has been defined for use in assessing glycemic control in clinical practice and research settings. The new metric may help rapidly identify problems in glycemic control and may assist with optimizing diabetes therapy during time-constrained physician office visits.
Introduction
D
More recently, data from the Swedish National Diabetes Registry found that patients with type 1 diabetes and glycated hemoglobin (A1c) levels of 6.9% (below current ADA Clinical Practice Recommendations) had twice the mortality as age-matched cohorts without diabetes. 3 In patients in the Swedish National Registry, 14.5% of all mortality was attributed to diabetic ketoacidosis or severe hypoglycemia. Among patients younger than 30 years, 31.4% of all premature mortality was attributed to diabetic ketoacidosis or severe hypoglycemia.
Continuous glucose monitoring (CGM) is emerging as an important tool in the treatment and management of diabetes, but the estimated utilization of the technology remains small compared to the total patient population who could benefit from its adoption. Early continuous glucose monitoring systems had poor accuracy and reliability compared with today's devices. Despite technical problems with early generations of the technology, numerous studies have found that sustained use of CGM technology improved overall glycemic control in both adults and children with type 1 diabetes. 2,4 –6
Compared with intermittent episodic capillary fingerstick blood glucose testing, continuous glucose monitoring systems produce very large amounts of data. The development of automated data visualization tools for continuous glucose monitoring systems has been a major focus of research in academia and in industry. 7 –11 Many insurance companies in the United States now provide reimbursement to patients for CGM devices (hardware and sensors). Historically, an additional factor limiting the more widespread use of continuous glucose monitors has been the lack of reimbursement for physicians in assisting patients interpreting the data from their devices. 12 There is now a Current Procedural Terminology (CPT) code, CPT 95251 that explicitly covers interpretation of data from a continuous glucose monitoring system. However, typical office visits to endocrinologists specializing in the use of diabetes technology are often constrained to a maximum of 15 to 20 min per patient. While visualization tools can provide useful insights into underlying patterns, they can be difficult and time-consuming for physicians and other healthcare providers to use in typical overscheduled medical practices.
As continuous glucose monitoring systems become more widely used as a standard tool for patients with type 1 diabetes, larger numbers of patients will be receiving care from endocrinologists, internists, family practitioners, and pediatricians who are not specialists in diabetes technology. While visualization tools for continuous glucose monitoring may be helpful to endocrinologists with interest and experience in diabetes technology, simpler tools are needed for other healthcare providers to be able to rapidly identify problems in glycemic control of their patients from the large body of data generated by CGM. A1c is a useful biochemical measure of glycemic control, but it has many limitations such as the insensitivity to glycemic variability and the frequency of severe hypoglycemic and hyperglycemic events. 13
We have developed a simplified composite metric for assessing glycemic control from CGM data without the need for complicated visual displays of data. Composite metrics have been widely used in numerous areas of medicine, including the Apgar score in neonatology 14 and the acute physiology and chronic health evaluation (APACHE) score in critical care medicine. 15 Recently, Vigersky proposed a novel composite metric for evaluating medical interventions in diabetes using a combination of A1c, frequency of severe glycemic events, and changes in the subjects' weight. 16 The metric proposed here, the personal glycemic state (PGS), is intended to evaluate four dimensions of glycemic control based solely on data from continuous glucose monitoring systems. The proposed PGS metric includes mean glucose, glycemic variability, percent time in range and frequency and severity of hypoglycemia.
The PGS is intended to be similar in spirit to the ubiquitous technology of Global Position Systems (GPS), which allows users to identify their current location—the PGS can be a tool for healthcare provider or for a patient to assist in understanding their current position in several key domains of glycemic control. It is meant for rapid screening of glycemic control based on CGM data to assist the physician, diabetes educator, or other healthcare provider in quickly identifying areas for possible modification of therapy. It is intended to be used as standalone index or could be used in conjunction with more detailed visualization tools depending on the time available for consultation, clinical problem at hand, or preference of the healthcare provider.
The PGS metric is intended to complement not replace A1c as a measure of the quality of patient's glycemic control. The PGS metric is well suited for use assessing the effect of changes in medication on glycemic control. It is also well suited for use assessing the emerging technology of artificial pancreas on glycemic control. In addition to the PGS metric, the individual components of the PGS metric may be used by physicians to rapidly identify specific elements of glycemic control that could be adjusted to benefit the patient while at the same time continuing to strive to achieve current ADA guidelines for A1c.
Methods
The PGS metric is a composite index intended to capture four separate domains of glycemic control available from continuous glucose monitoring data: the glycemic variability, mean glucose, percent time in range (70–180 mg/dL), and incidence of hypoglycemic episodes per week defined separately as the number of episodes per week ≤54 mg/dL and the number of episodes <70 mg/dL and greater than or equal to 55 mg/dL.
The PGS uses a new metric for glycemic variability, the glycemic variability percentage (GVP), based on the length of the continuous glucose monitoring temporal trace normalized to the duration under evaluation. The results are expressed as a percentage above the minimum line length with zero glycemic variability. Whereas other metrics preferentially weight either the amplitude or the frequency of oscillations associated with glycemic variability, the new metric gives equal weight to both the amplitude and frequency. The GVP metric is similar mathematically to two other previously proposed metrics for glycemic variability, the mean absolute glucose (MAG) described by Hermanides et al.
17
and distance traveled proposed by Marling et al.
18
However, GVP may be easier to understand conceptually and easier to use clinically because the results are expressed as a percentage compared with the minimum line length for a given duration. In addition, the concept of a GVP relative to a norm allows for easier comparison of glycemic variability between different data sets. The GVP can be calculated from the equation for the length of a line L given by the summation over all n line elements dL based on decomposition into horizontal (dx) and vertical (dy) components and application of the Pythagorean theorem.
In this equation, the differential element dx is defined as the time between two successive continuous glucose monitoring system measurements and the differential element dy is determined as the change in glucose over that time interval.
The GVP, is given by the length of the line L from the continuous glucose monitor trace normalized to the ideal line length L0 for a given temporal duration or simply
where L0 would typically be given in days, weeks, or months. We have chosen to express the new metric as the percentage of glycemic variability above a deviation from a straight line for the duration of time under consideration. In the data set described below and used for this study, the lowest values for GVP were seen in study subjects without diabetes (n = 43) who had a mean GVP of 17.3% (range 8.4%–28.4% and standard deviation 4.3%). Study subjects with type 2 diabetes (n = 21) had a slightly higher mean GVP of 27.6% (range 8.3%–60.8% and standard deviation 9.7%). Highest values for GVP were seen in study subjects with type 1 diabetes (n = 141) who had a mean GVP of 45% (range 17%–112% and standard deviation 14.1%).
The PGS is an additive composite metric and can be calculated from the following simple equation
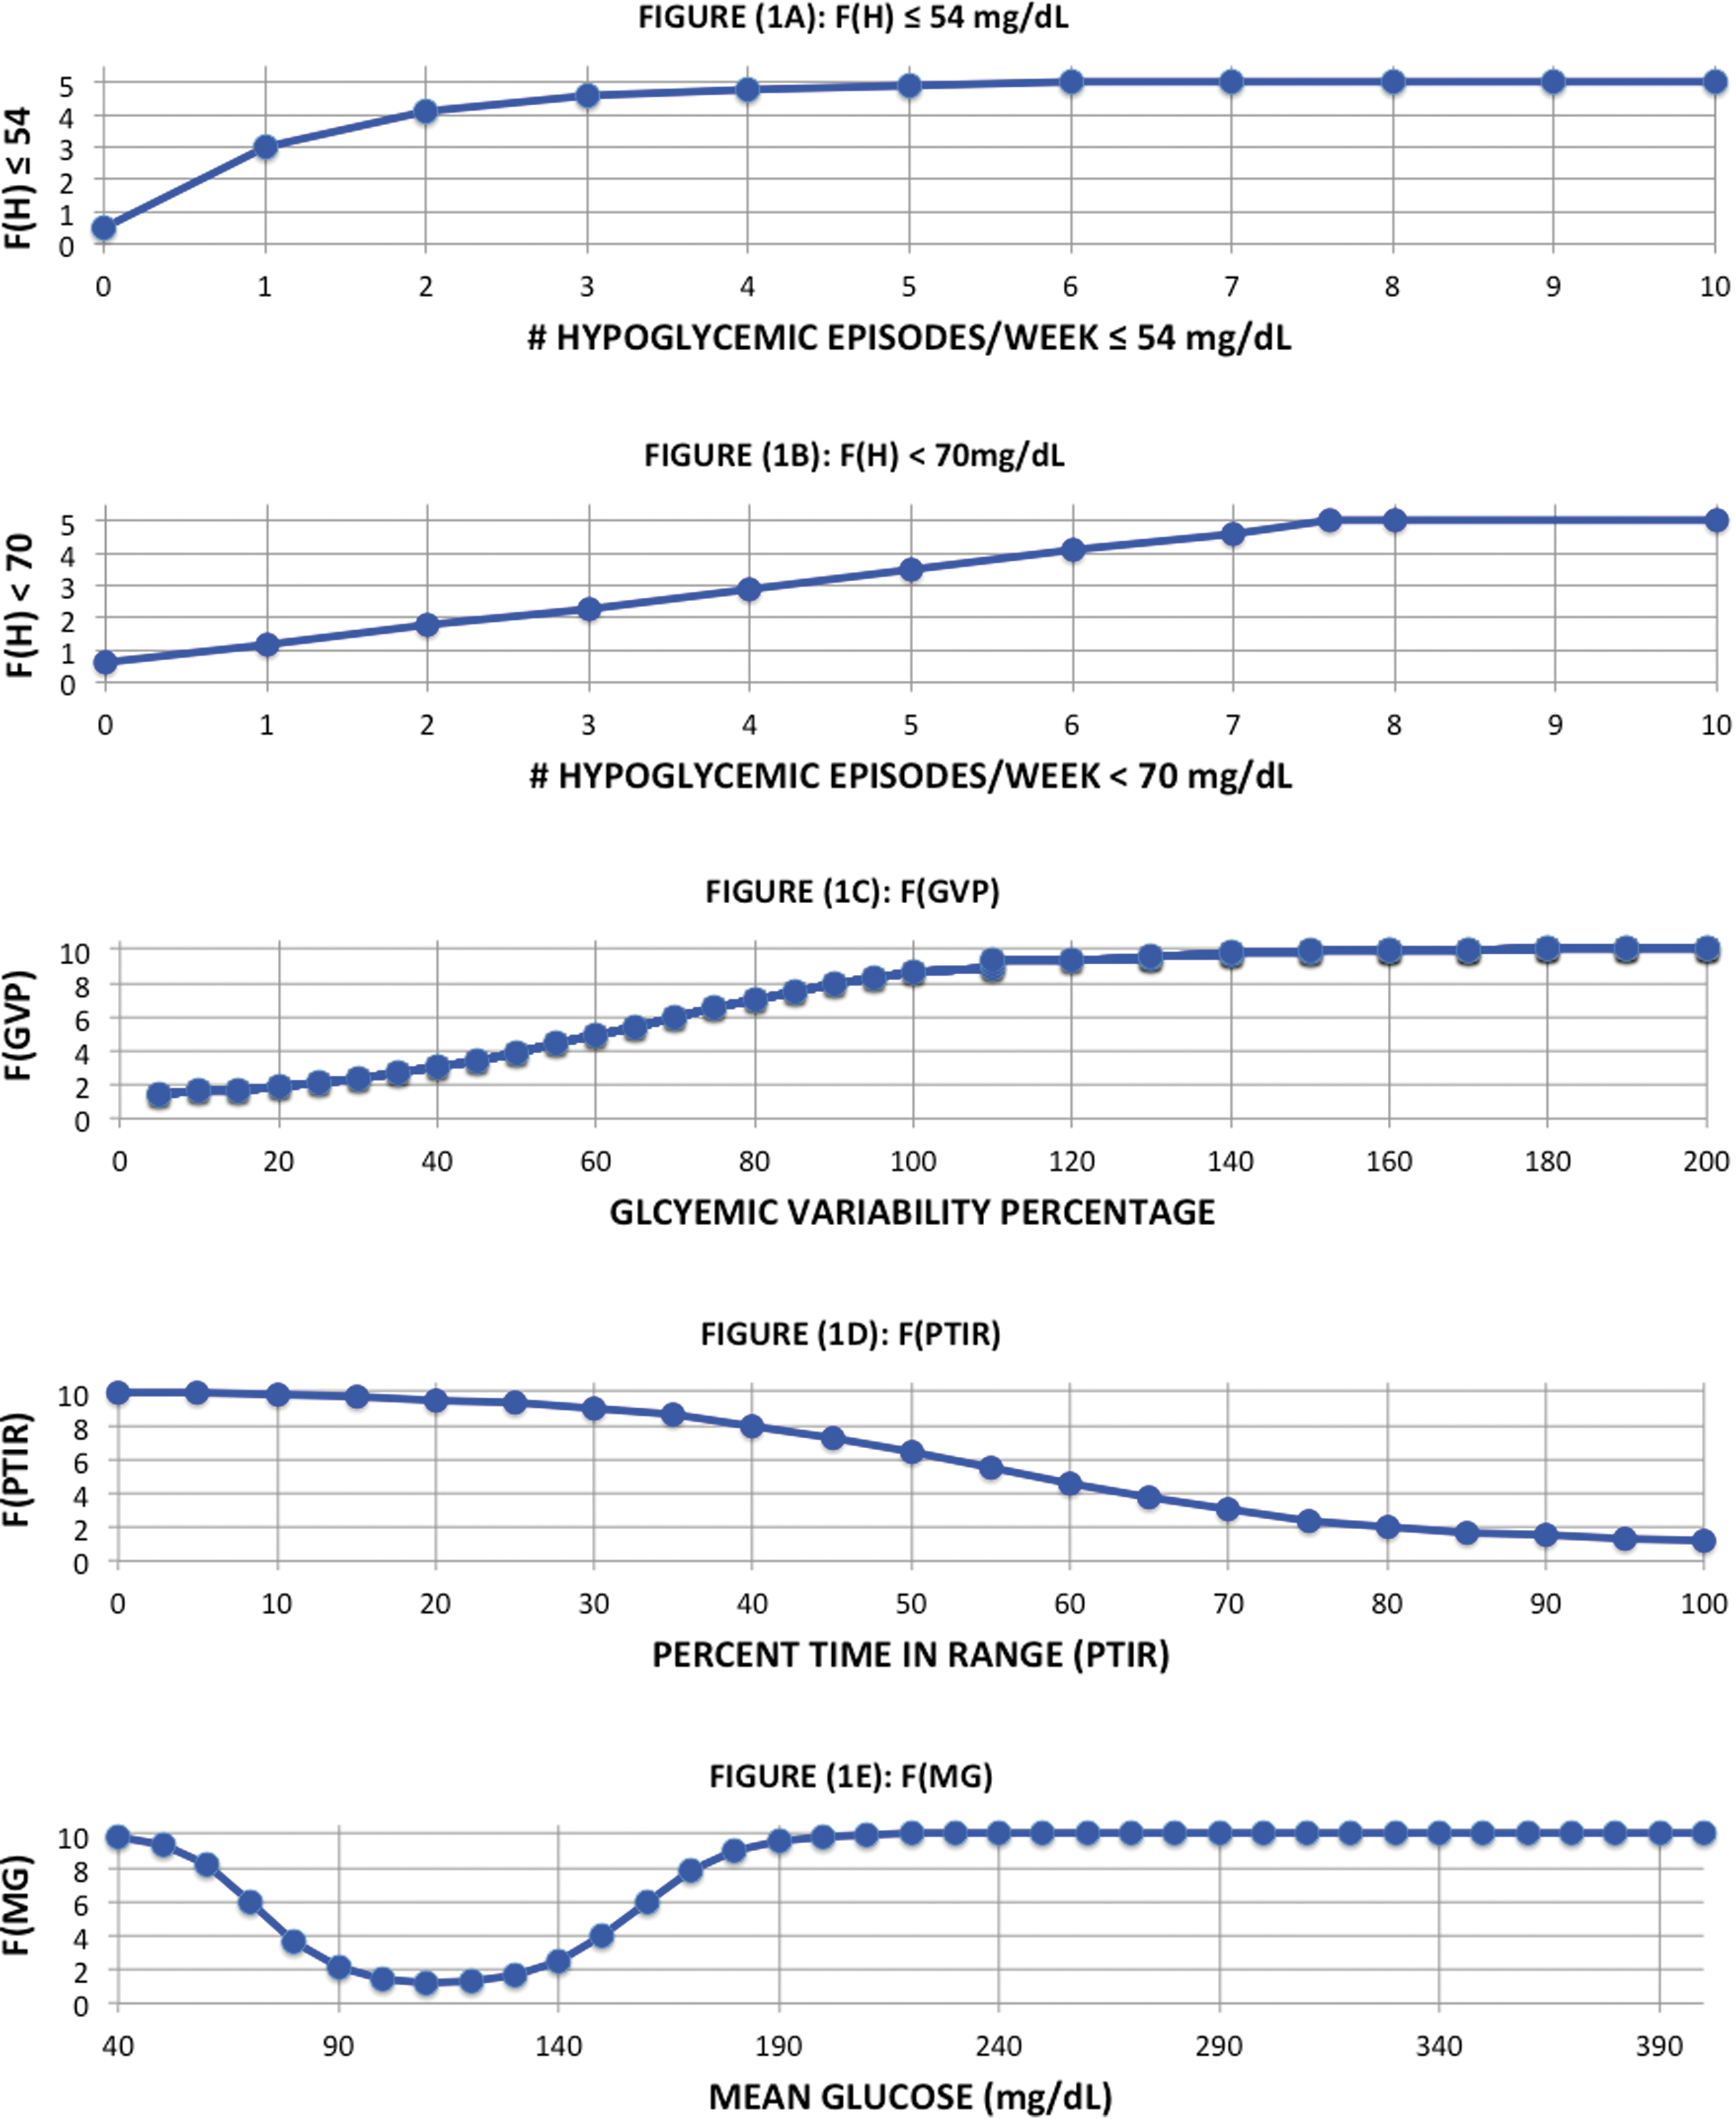
where F(GVP) is a function of the glycemic variability percentage, F(MG) is a function of the mean glucose, F(PTIR) is a function of the percent time in range (from 70 to 180 mg/dL), and F(H) is a function of the incidence of the number of hypoglycemic episodes per week.
The hypoglycemia function incorporates two distinct thresholds (54 and 70 mg/dL) and is the sum of two terms: F54(H) and F70(H). The hypoglycemic function F54(H) for the 54 mg/dL threshold is nonlinear reflecting the severity of hypoglycemic events at that value. The lower threshold is often associated with neurocognitive impairment requiring the patient to obtain the assistance of others for treatment. The hypoglycemic function F70(H) for the 70 mg/dL threshold is linear not only reflecting the difference between the clinical significance of the two threshold values but also acknowledging the risks associated with repeated episodes per week at the higher threshold. The higher threshold represents the onset of biochemical hypoglycemia and is the value used by most patients to treat with fast-acting carbohydrates.
In addition, it is the value used in many artificial pancreas studies to prompt treatment with carbohydrates. The hypoglycemic function F(H) includes both values to provide an assessment not only of potentially clinically significant episodes of hypoglycemia, but the number of times as well that treatment may be needed to reverse hypoglycemia and prevent progression to lower values. Both hypoglycemic functions are graded on a scale of 0.5 to 5. The minimum of each hypoglycemic event is used to assign the event either to the nonlinear function for values less or equal to 54 mg/dL or to the linear function for values between 55 and 70 mg/dL. The two hypoglycemia functions are shown in Figure 1A and B, respectively.
Functional form of the four functional components of the PGS composite index:
The nonlinear functions for each of the other component elements have all been scaled to give values approximately between 1 and 10. The minimum value of the PGS metric is 4.6 corresponding to excellent glycemic control typical of patients without diabetes or patients with diabetes under superb glycemic control. The maximum value of the PGS metric is 40 corresponding to a poor quality of glycemic control that would be seen in patients with elevated A1c values, high mean glucose, and low percent of time in the euglycemic range. In addition, these patients would typically also exhibit high glycemic variability and experience frequent episodes of hypoglycemia. The component elements of the PGS metric are given by the following equations:
where
and
where GVP is the glycemic variability percentage, MG is the mean glucose, PTIR is the percent time in range (70–180 mg/dL), N
54 is the number of hypoglycemic events per week below the low threshold (≤54 mg/dL), and N
70 is the number of hypoglycemic events between the low threshold and the high threshold (<70 mg/dL). The values of the components of the PGS are given to one decimal point in Supplementary Figure S1 (Supplementary Data are available online at
All four functions have been designed to enable rapid identification of potential clinical problems with each domain of the scale. The GVP function was based on the interquartile analysis to be published separately. 19 The mean glucose function is asymmetric and reaches a minimum in the tight euglycemic range and increases rapidly in value both below 80 mg/dL and above 140 mg/dL. The percent time in range function is a decreasing rectangular hyperbolic equation that asymptotes at a maximum value at 20% time in range and at a minimum value at 90% time in range. Finally, the hypoglycemic function is a penalty function designed to rapidly identify patients with repeated incidents of potentially clinically serious hypoglycemia (≤54 mg/dL) and separate incidents of biochemical hypoglycemia (<70 mg/dL). The hypoglycemic function is a minimum equal to 1.1 when there are no episodes of hypoglycemia per week and a maximum equal to 10 when there are multiple episodes of both levels of hypoglycemic events.
A composite index of this type is intended to assist the physician or healthcare provider in rapidly forming a clinical judgment, but should not be used independent of a larger clinical assessment. In addition to assessing the numerical value of the composite metric, the component elements should also be separately evaluated.
The new PGS composite index was applied to data obtained from four pivotal studies for the G4 Platinum in subjects with type 1 diabetes (n = 141) and subjects with type 2 diabetes (n = 21). In addition, we applied the PGS composite index to data from smaller feasibility studies in volunteer subjects without diabetes (n = 43). Data from the subjects with diabetes and the volunteer subjects without diabetes were used to characterize the variation in the PGS index observed in actual clinical data. We analyzed data as well from a smaller cohort of subject with diabetes (n = 5) for which data were available over 2 years of continued use of the device to test the time invariance of the method. Finally, the glycemic variability metric was applied to data obtained from a recently published study of artificial pancreas comparing results from open loop and from closed loop in adolescents (n = 32) and in adults (n = 20). 20
Results
Figure 2 shows the value of the PGS composite index values for the adult subjects (n = 204) from the feasibility, prepivotal, and pivotal studies of the original G4 Platinum and the modified G4 Platinum (software 505) continuous glucose monitoring system. These data have been separated into three cohorts: subjects without diabetes, subjects with type 2 diabetes, and subjects with type 1 diabetes. Glycemic control according to the PGS composite index was separated into four separate ranges based on interquartile analysis of PGS values in the subjects with type 1 diabetes. The mean PGS for the first quartile of subjects with type 1 diabetes was 14.4 (with a minimum of 7.8 and a maximum of 14.9). The first quartile of subjects with type 1 diabetes and the lowest range in the PGS categorization (<15) represents a high quality of glycemic control typical of patients without diabetes or patients with diabetes with excellent glycemic control. The next three ranges are associated with good, moderate, and poor quality of glycemic control.
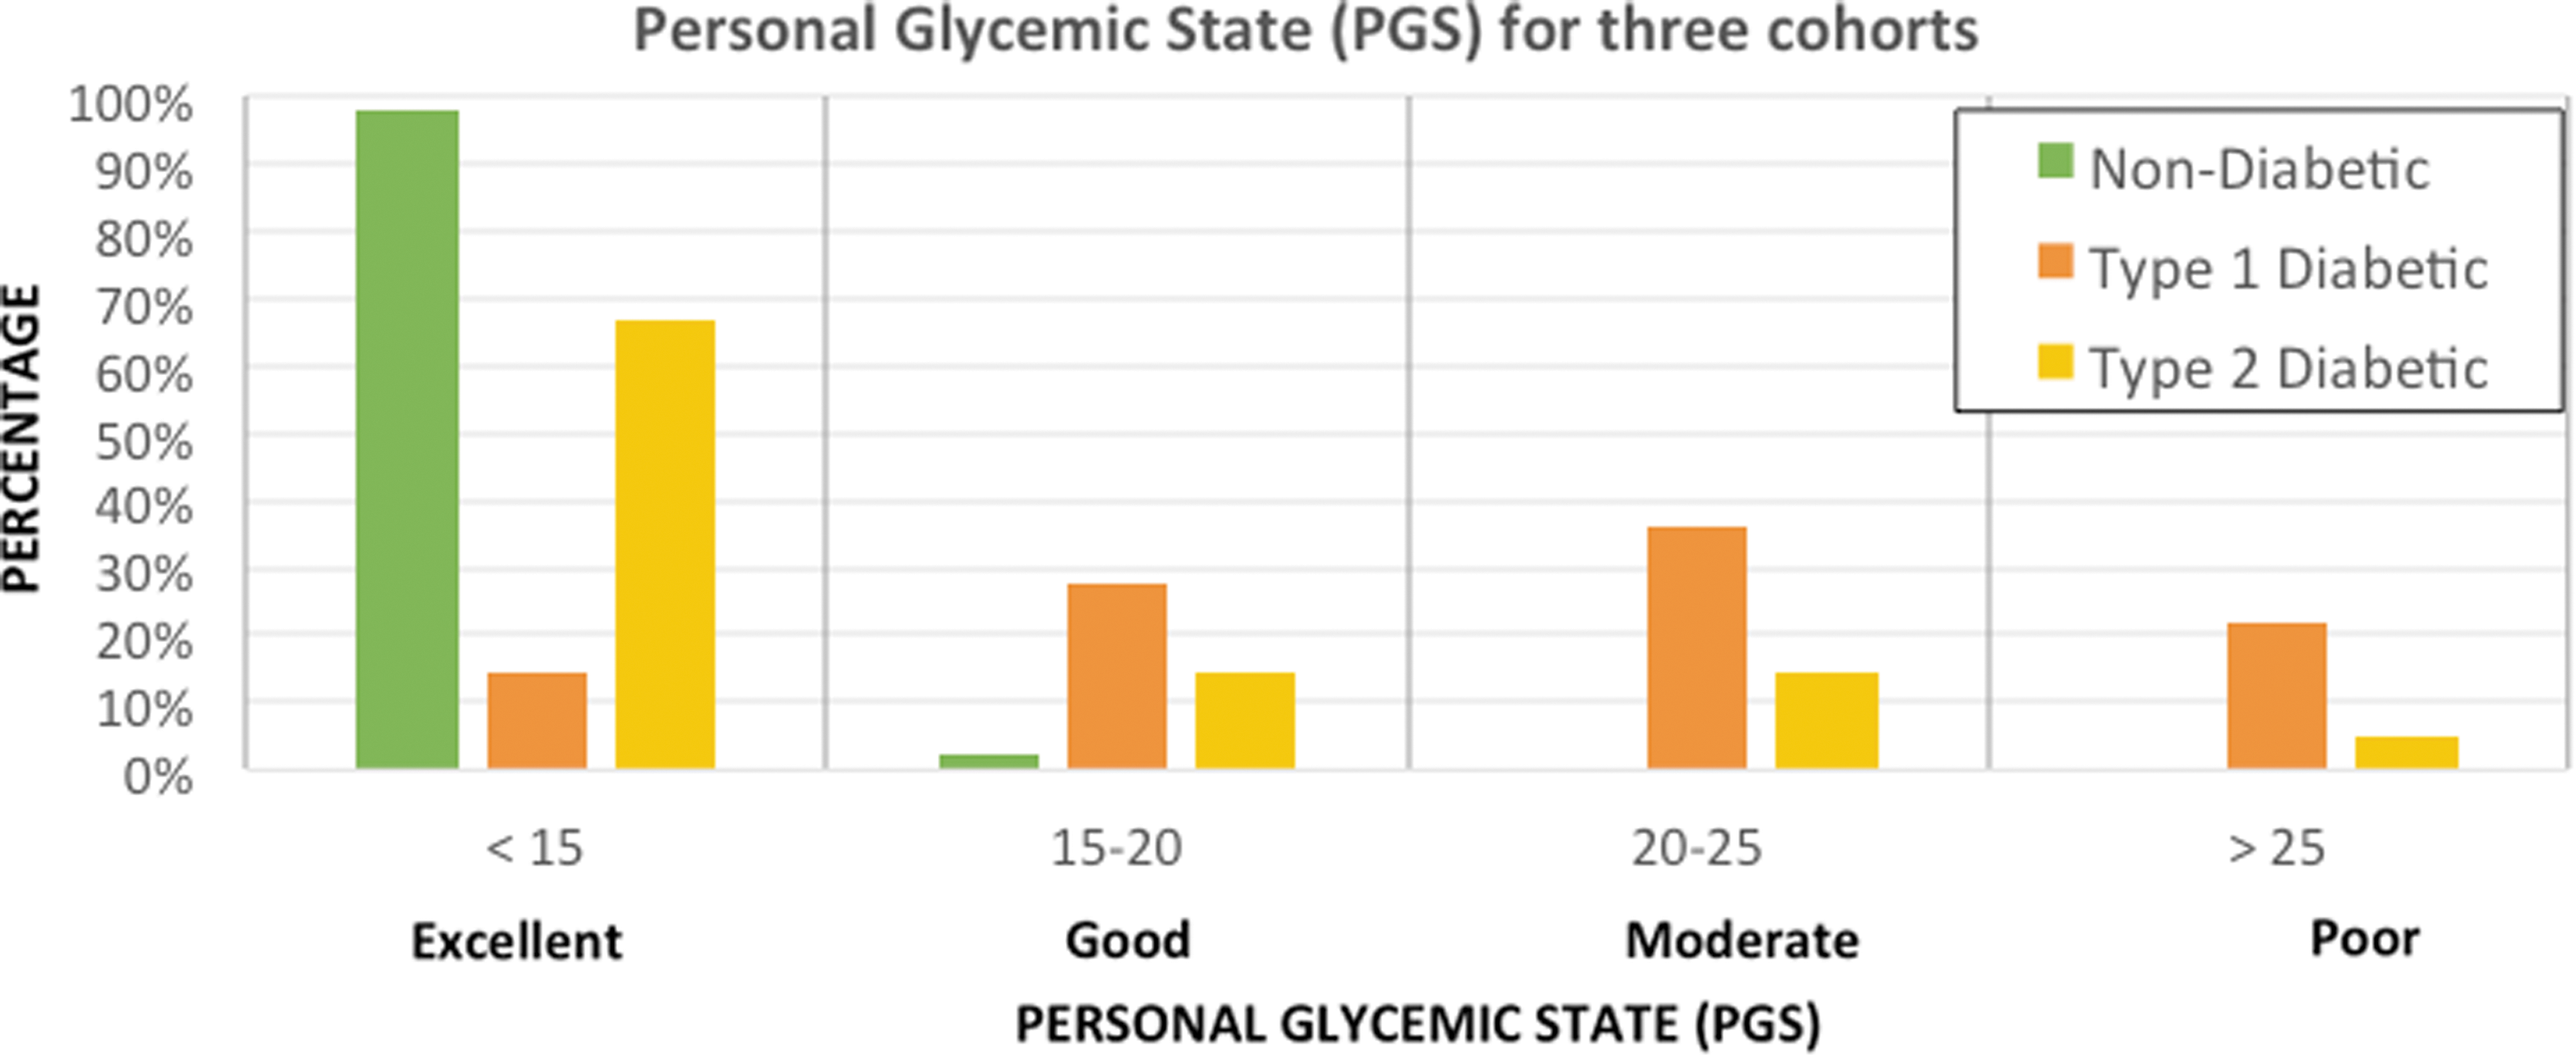
Graphical representation of the data in Figure 3 showing the distribution of PGS values of adult subjects without diabetes, with type 2 diabetes, and with type 1 into the four ranges of the composite index.
The values for the PGS composite index associated with these four ranges are shown in Figure 2 and given in Figure 3 below along with a color-coding. Green (PGS <15) is indicative of excellent glycemic control with a high percent time in range, mean glucose centered at 100 mg/dL, low glycemic variability, and no potentially clinically significant hypoglycemic events (≤54 mg/dL). Yellow (15 ≤PGS <20) is indicative of good glycemic control with one or more components of glycemic control needing some additional optimization. Orange (20 ≤ PGS <25) is indicative of moderate glycemic control with two or more areas needing significant additional optimization. Red (PGS >25) is indicative of poor glycemic control with multiple areas needing optimization and at least one or more areas of high concern needing immediate clinical attention.
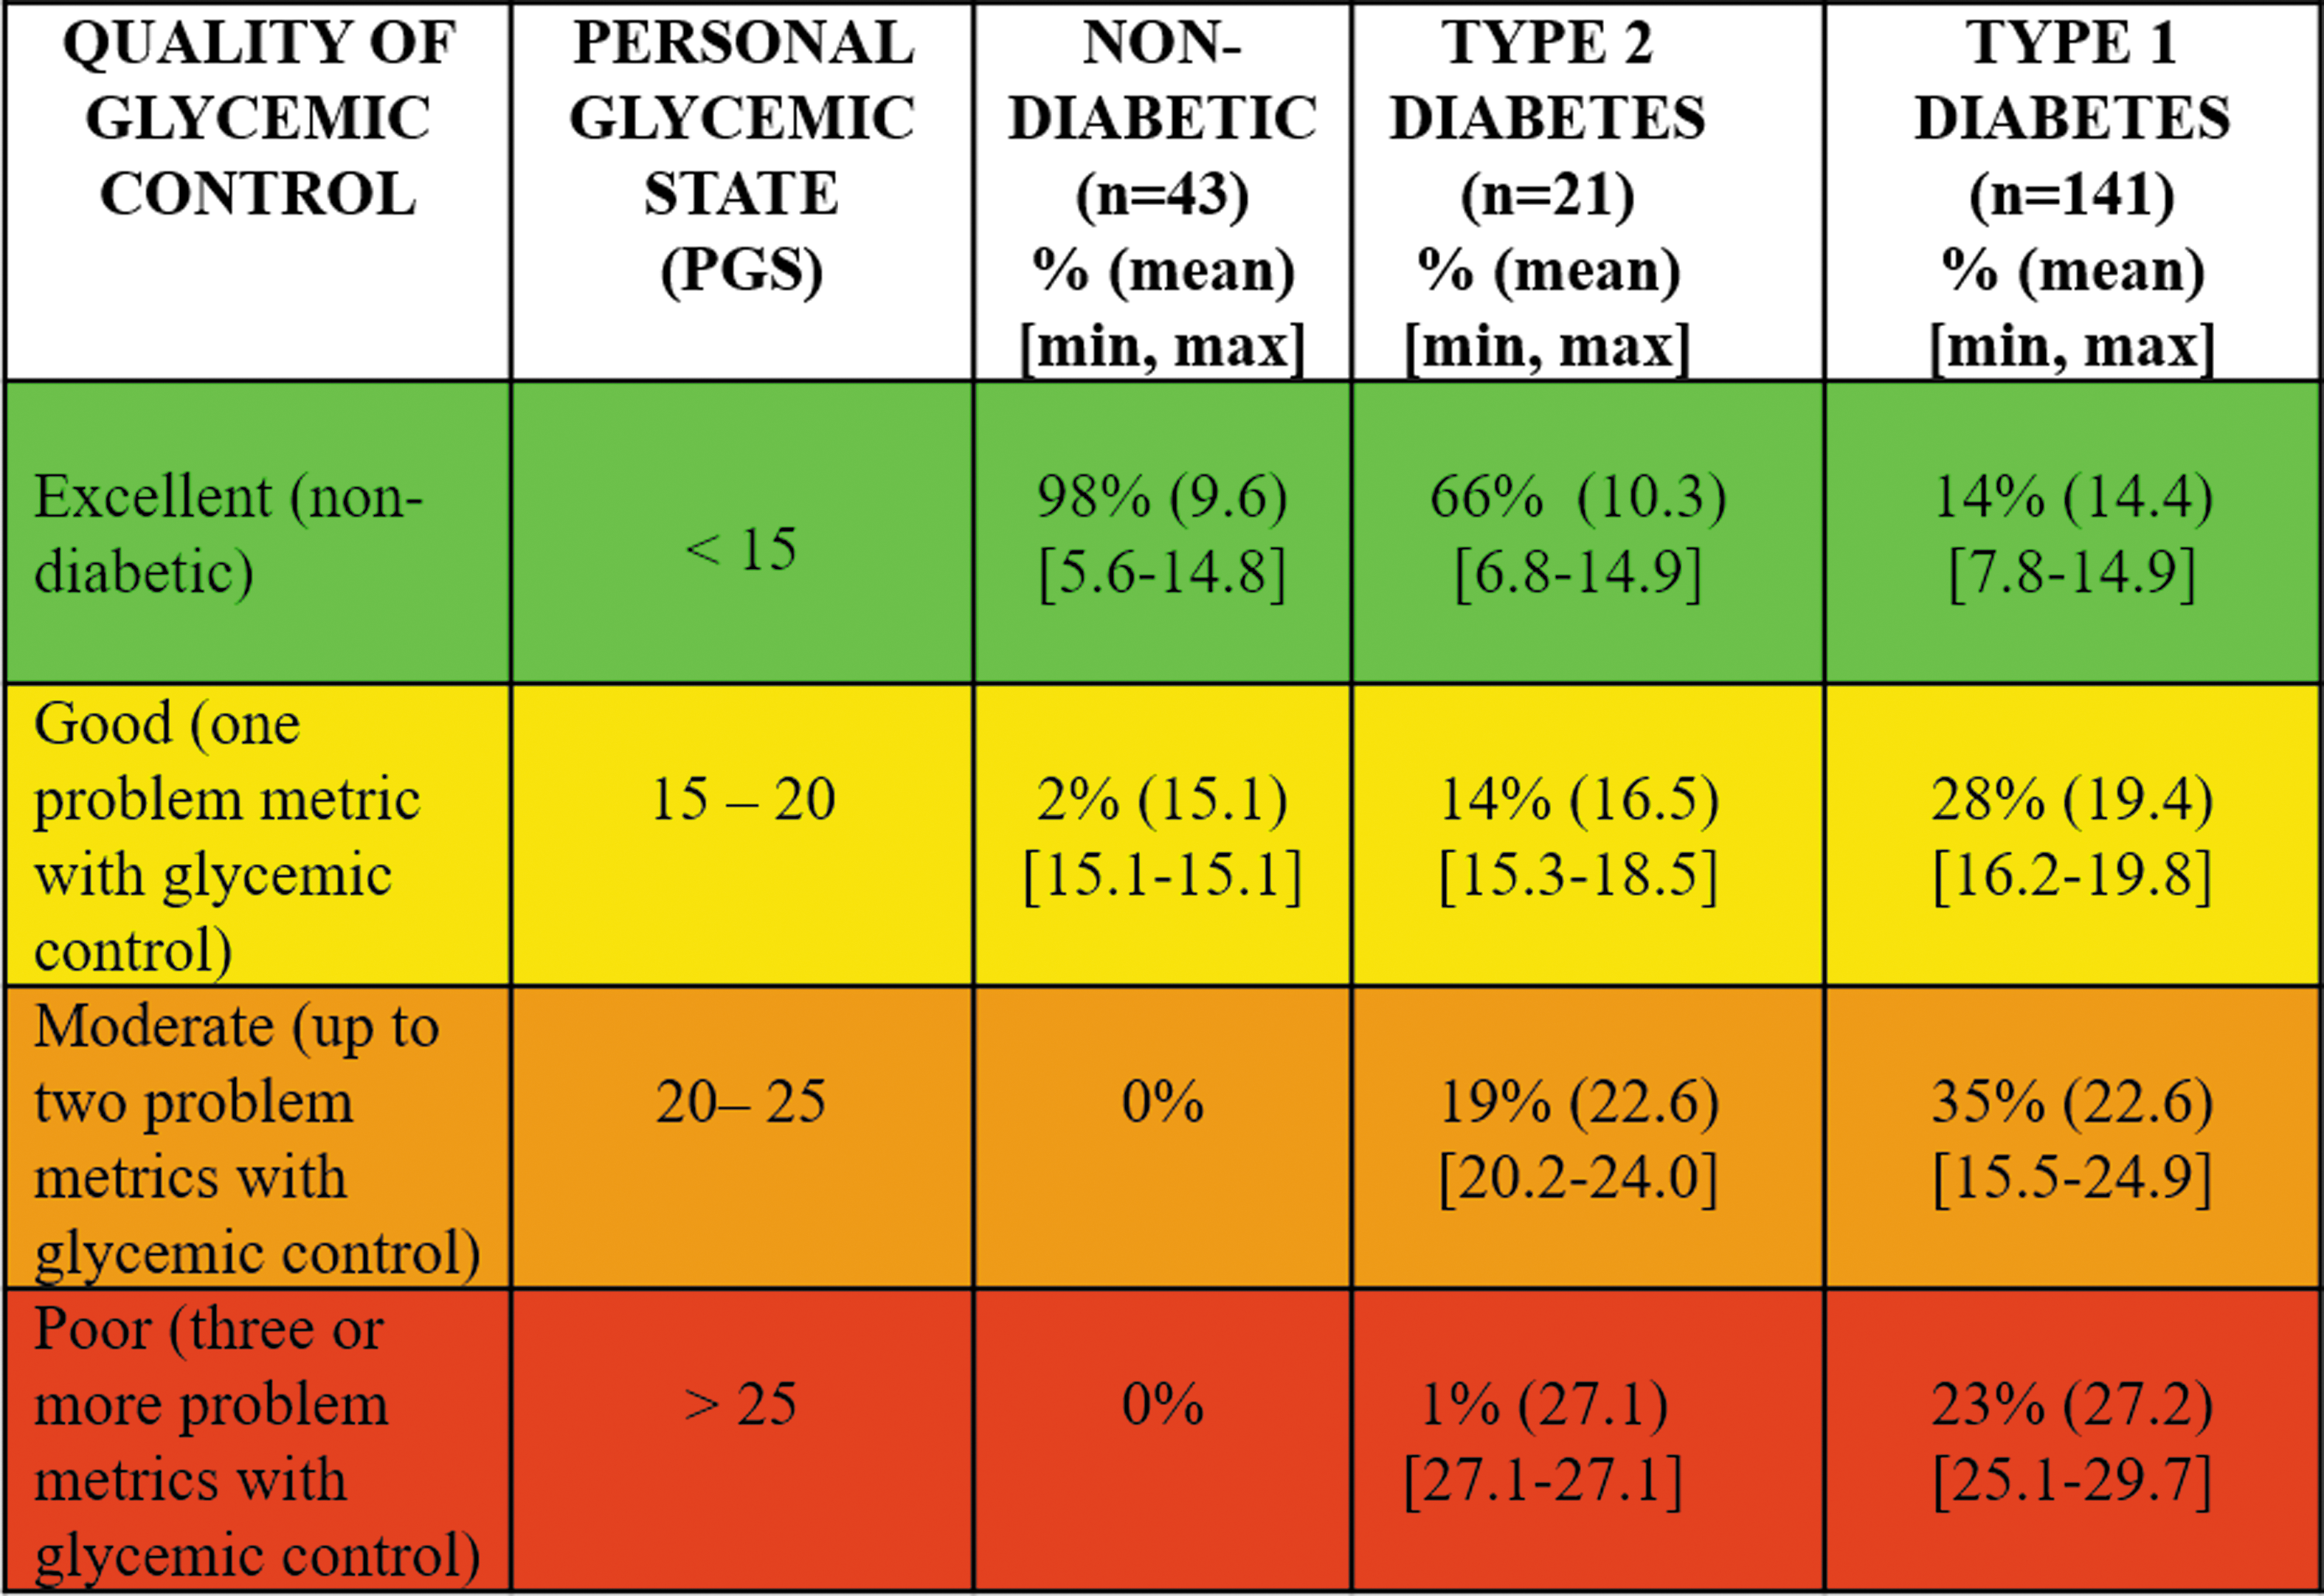
Classification of PGS into four ranges based on interquartile analysis of mean PGS in subjects with type 1 diabetes. First quartile is indicative of excellent glycemic control (equivalent to nondiabetic), second quartile is indicative of good glycemic control, third quartile is indicative of moderate glycemic control, and the fourth quartile is indicative of poor glycemic control based on the metrics of mean glucose, GVP, percent time in range and the incidence of hypoglycemia defined in two ranges (one ≤54 mg/dL and the other <70 and ≥55 mg/dL per week).
The mean of the PGS composite index for the volunteer subjects without diabetes was 9.8 (range 5.6–15.1) and the standard deviation was 3.1. The mean of the PGS composite index for the study subjects with type 2 diabetes was 13.8 (range 6.8–27.1) and the standard deviation was 5.9. The mean of the PGS composite index for the study subjects with type 1 diabetes was 20.8 (range 7.8–29.7) and the standard deviation was 4.9.
Figure 4 shows the application of the PGS metric to the temporal traces from 1 week of continuous glucose monitoring data from three subjects with type 1 diabetes. In the top graph, Figure 4A, the subject has a relatively low glycemic variability percentage of 30.5% or F(GVP) = 2.4, a low mean glucose of 127 mg/dL of F(MG) = 1.7, and a high percent of time in range of 84% or F(PTIR) = 1.7. At first glance, the overall glycemic control appears good. However, the subject experienced seven episodes of hypoglycemic events under 54 mg/dL and one additional episode of hypoglycemia above 54 mg/dL but below 70 mg/dL giving F(H) = 6.2; hence, the value of the PGS composite index is PGS = 12.0 indicative of an excellent quality of glycemic control. However, the component analysis would show that while there were three low scores for percent time in range, mean glucose, and glycemic variability, there was one score for hypoglycemia indicating the need for further attention.
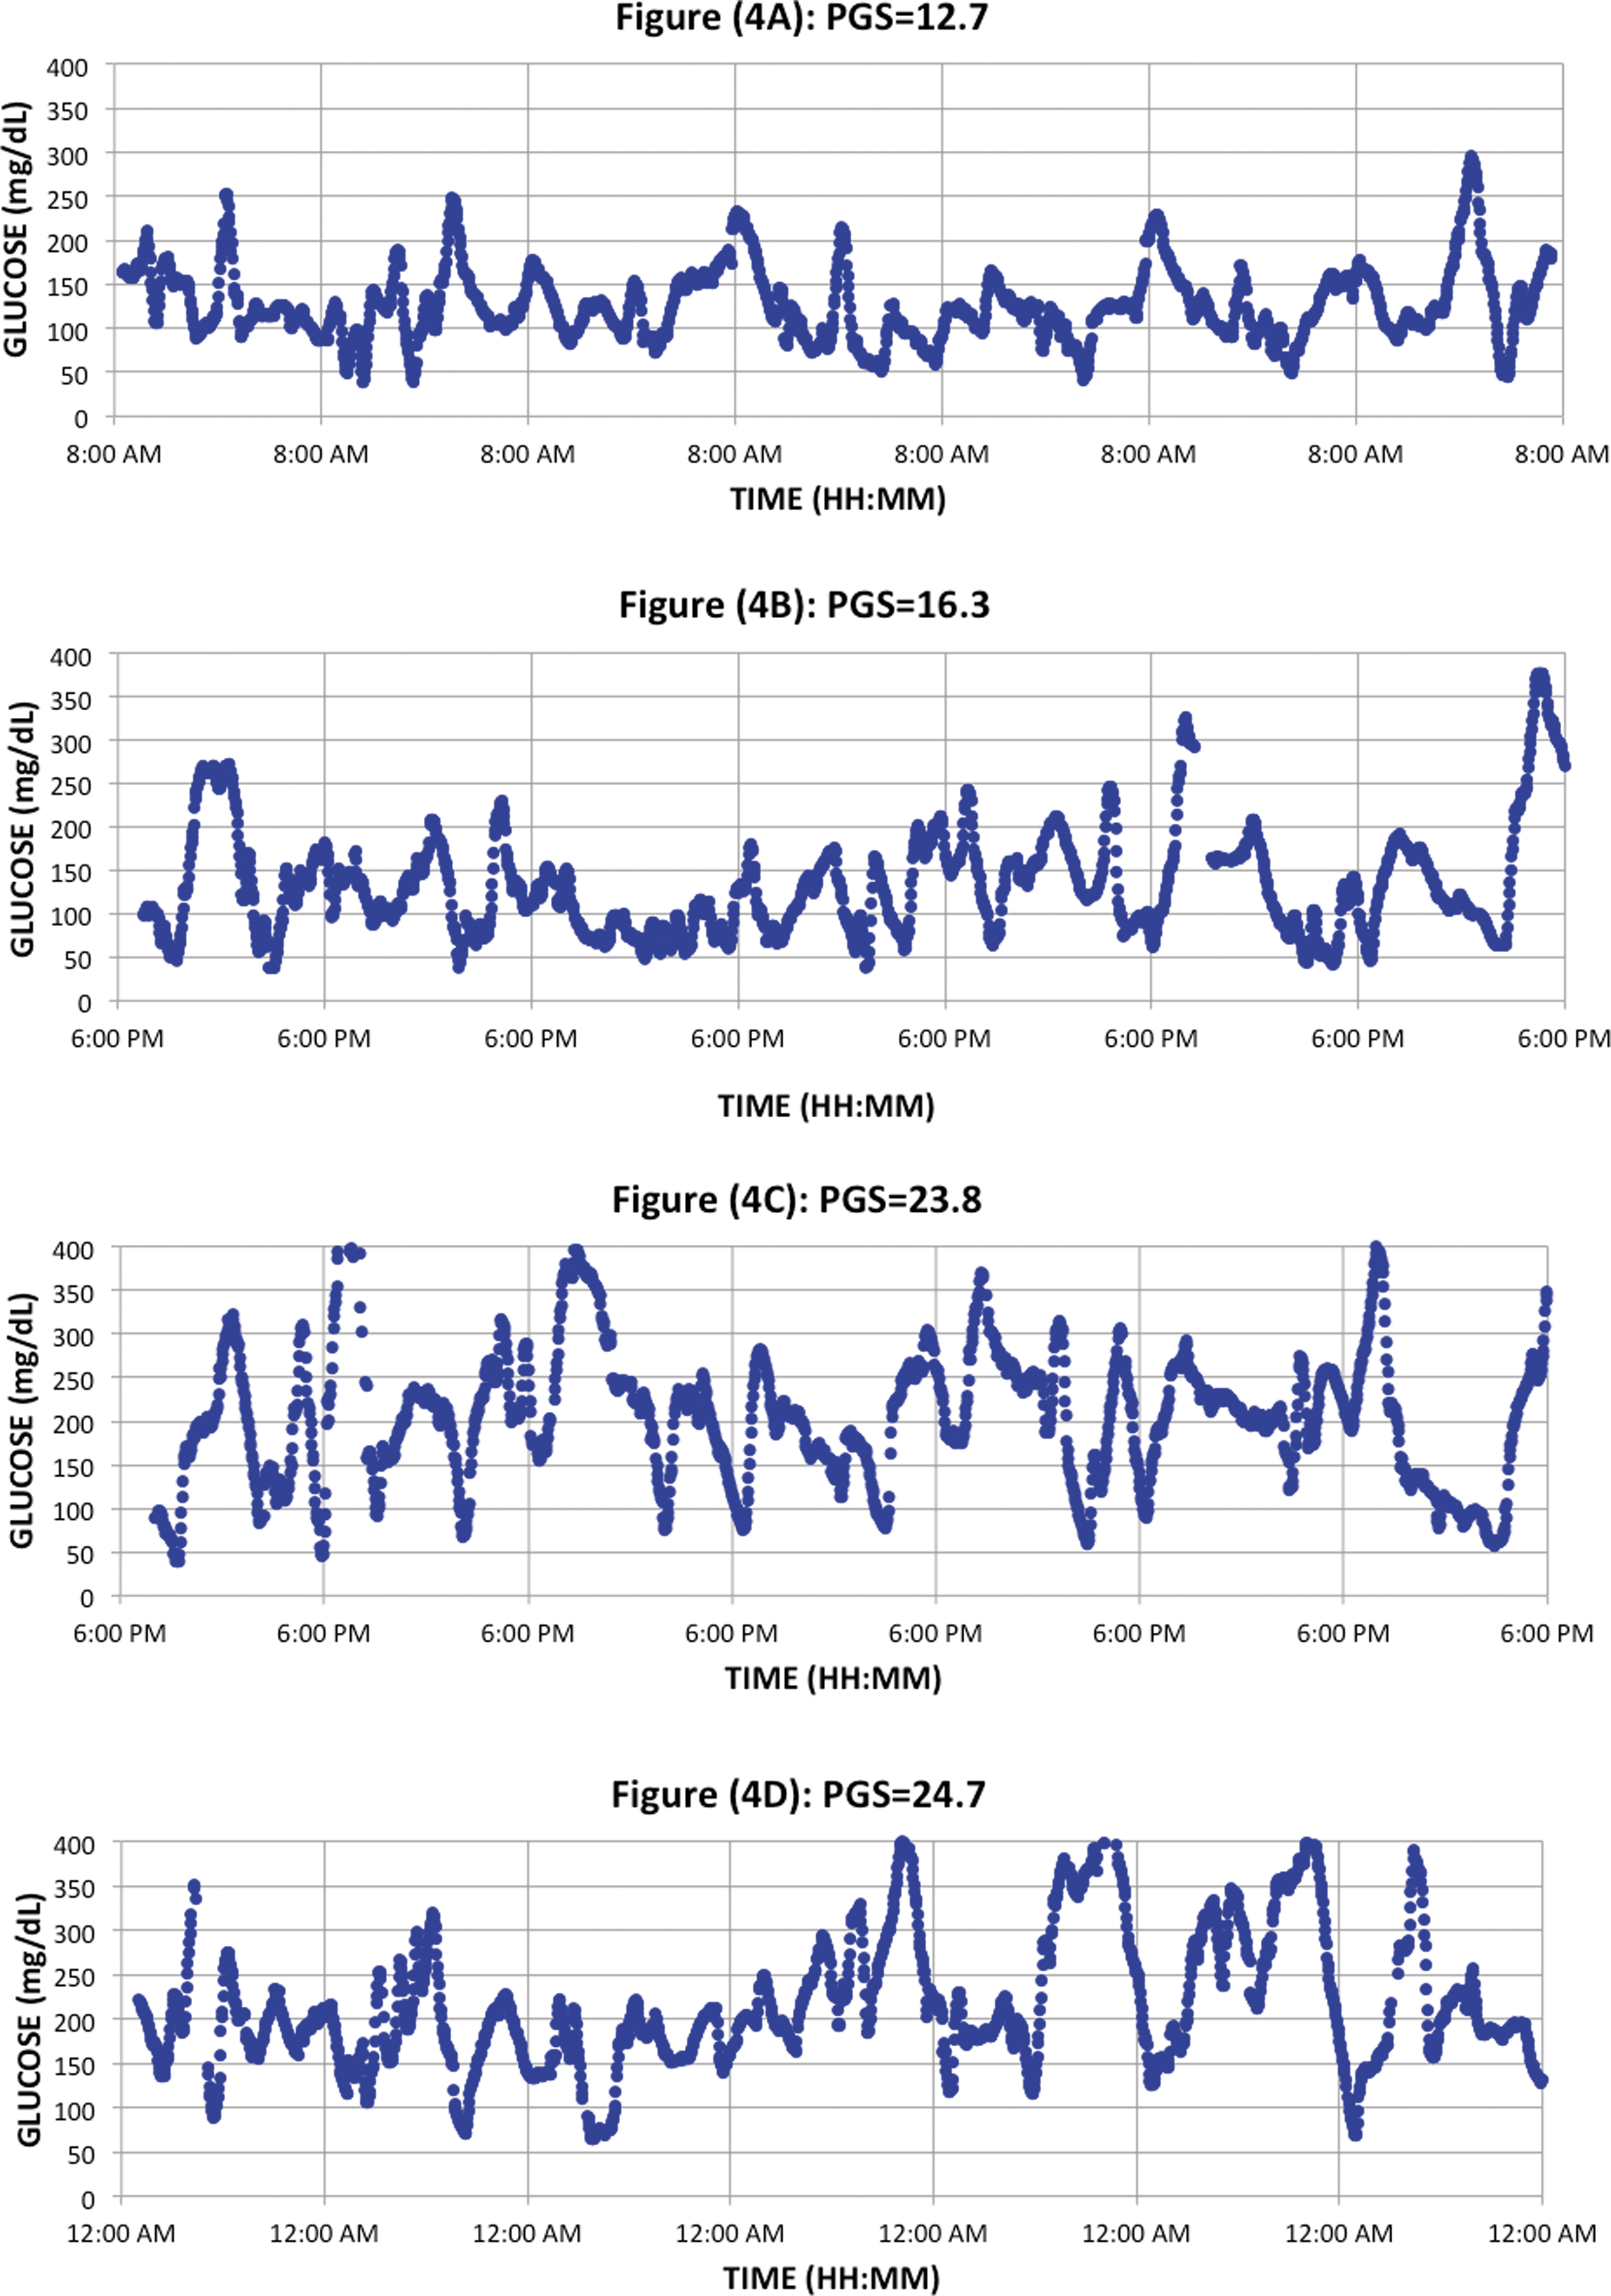
Four temporal traces indicating different values of the composite index, the PGS, for patients with different mean glucose, glycemic variability, time in range, and frequency of hypoglycemic events below 54 and 70 mg/dL threshold values. Figure (4A) is the CGM data for seven days in a subject with excellent glycemic control (PGS = 12.7). Figure (4B) is data from a subject with good glycemic control (PGS = 16.3). Figures (4C) and (4D) are from subjects with moderate glycemic control (PGS = 23.8 and 24.7).
In the second graph, Figure 4B, the subject has moderate glycemic variability of 37% giving F(GVP) = 2.8, a low mean glucose of 134 mg/dL giving F(MG) = 2.2 and a high percentage of time in range of 71.6% giving F(PTIR) = 2.8 but 8 episodes of hypoglycemia below 54 mg/dL (averaged over 7 days) and 14 additional episode of hypoglycemia above 54 mg/dL but below 70 mg/dL giving F(H) = 9.9. The value for the composite metric PGS for all four components is PGS = 17.7 indicative of moderate quality of glycemic control with one or more problems warranting further attention. In the third graph, Figure 4C, the subject has moderate glycemic variability 52.9% giving F(GVP) = 4.2, moderate mean glucose of 158 mg/dL giving F(MG) = 5.2, and a moderate percentage of time in range of 54.8% giving F(PTIR) = 5.5. However, the subject had 12 episodes of hypoglycemia below 54 mg/dL and 2 additional episodes of hypoglycemia above 54 mg/dL but below 70 mg/dL giving F(H) = 6.8; hence, the value of the PGS composite index is PGS = 21.7 indicative of a moderate quality of glycemic control with two or more problems warranting further attention.
In the fourth graph, Figure 4D, the subject has a high mean glucose of 214 mg/dL giving F(MG) = 9.9, a low percentage of time in range of 34% giving F(PTIR) = 8.7 and a moderate level of glycemic variability 47% giving F(GVP) = 3.6. In this subject, there was only one episode of hypoglycemia below 70 mg/dL and no episodes of hypoglycemia below 54 mg/dL resulting in a low F(H) = 1.7. The value of the PGS composite index is high PGS = 23.9 indicative of a moderate quality of glycemic control with two or more problems warranting further attention, specifically the high mean glucose and the low percent time in range.
Data in Figure 4A have a value for the PGS metric denoting good overall glycemic control (PGS = 12.7). However, analysis of the component elements in Figure 4A immediately indicates to the healthcare provider a potential risk to the patient from high frequency of hypoglycemic events. The subject in Figure 4A might be encouraged to strive for a slightly higher mean glucose, which could preserve the high percent time in range but reduce the incidence of hypoglycemia. The mean glucose in Figure 4B is low, but the PGS metric indicates a moderate quality of glycemic control (PGS = 16.7) due to the high number of hypoglycemic events. The subject in Figure 4B might be encouraged to focus on reducing the incidence of hypoglycemic events by setting a higher threshold value for the hypoglycemic alert on the continuous glucose monitor and reducing basal rates during the affected times of day.
There are multiple problems with glycemic control shown for the subject in Figure 4C below (PGS = 23.8). In this case, the mean glucose of 157 mg/dL might be associated with an A1c value of ∼7%, but there are clearly issues with the quality of the subject's glycemic control. The most productive approach clinically for this subject might be to attempt to address the causes of the glycemic variability and the hypoglycemic events such as elevated basal rates or mistuned insulin-to-carbohydrate ratios. Finally, the subject shown in Figure 4D has problems across multiple domains of glycemic control (PGS = 24.7) driven primarily by the high mean glucose of 214 mg/dL, which is strongly correlated with the low percent time in range (34%). In addition, the data for this subject show moderate levels of glycemic variability (46.5%). In this subject, the most productive clinical course might be to focus on gradually reducing the mean glucose toward target while also attempting to reduce glycemic variability.
Data for these four subjects are summarized in Figure 5. Interestingly, three of the four subjects might have A1c values at or below the recommended ADA targets based on their mean glucose alone. However, the PGS composite index is able to identify specific components of the subject's glycemic control that could be optimized further. The data could be presented to the healthcare provider as shown in Figure 5 below with green denoting excellent glycemic control, yellow good glycemic control, orange moderate glycemic control, and red poor glycemic control. Simultaneous display of color-coded values for the composite metric (PGS) and the component elements (glycemic variability, mean glucose, percent time in range, and incidence of hypoglycemia) is designed to enable rapid identification of clinical domains that needed additional attention and optimization.
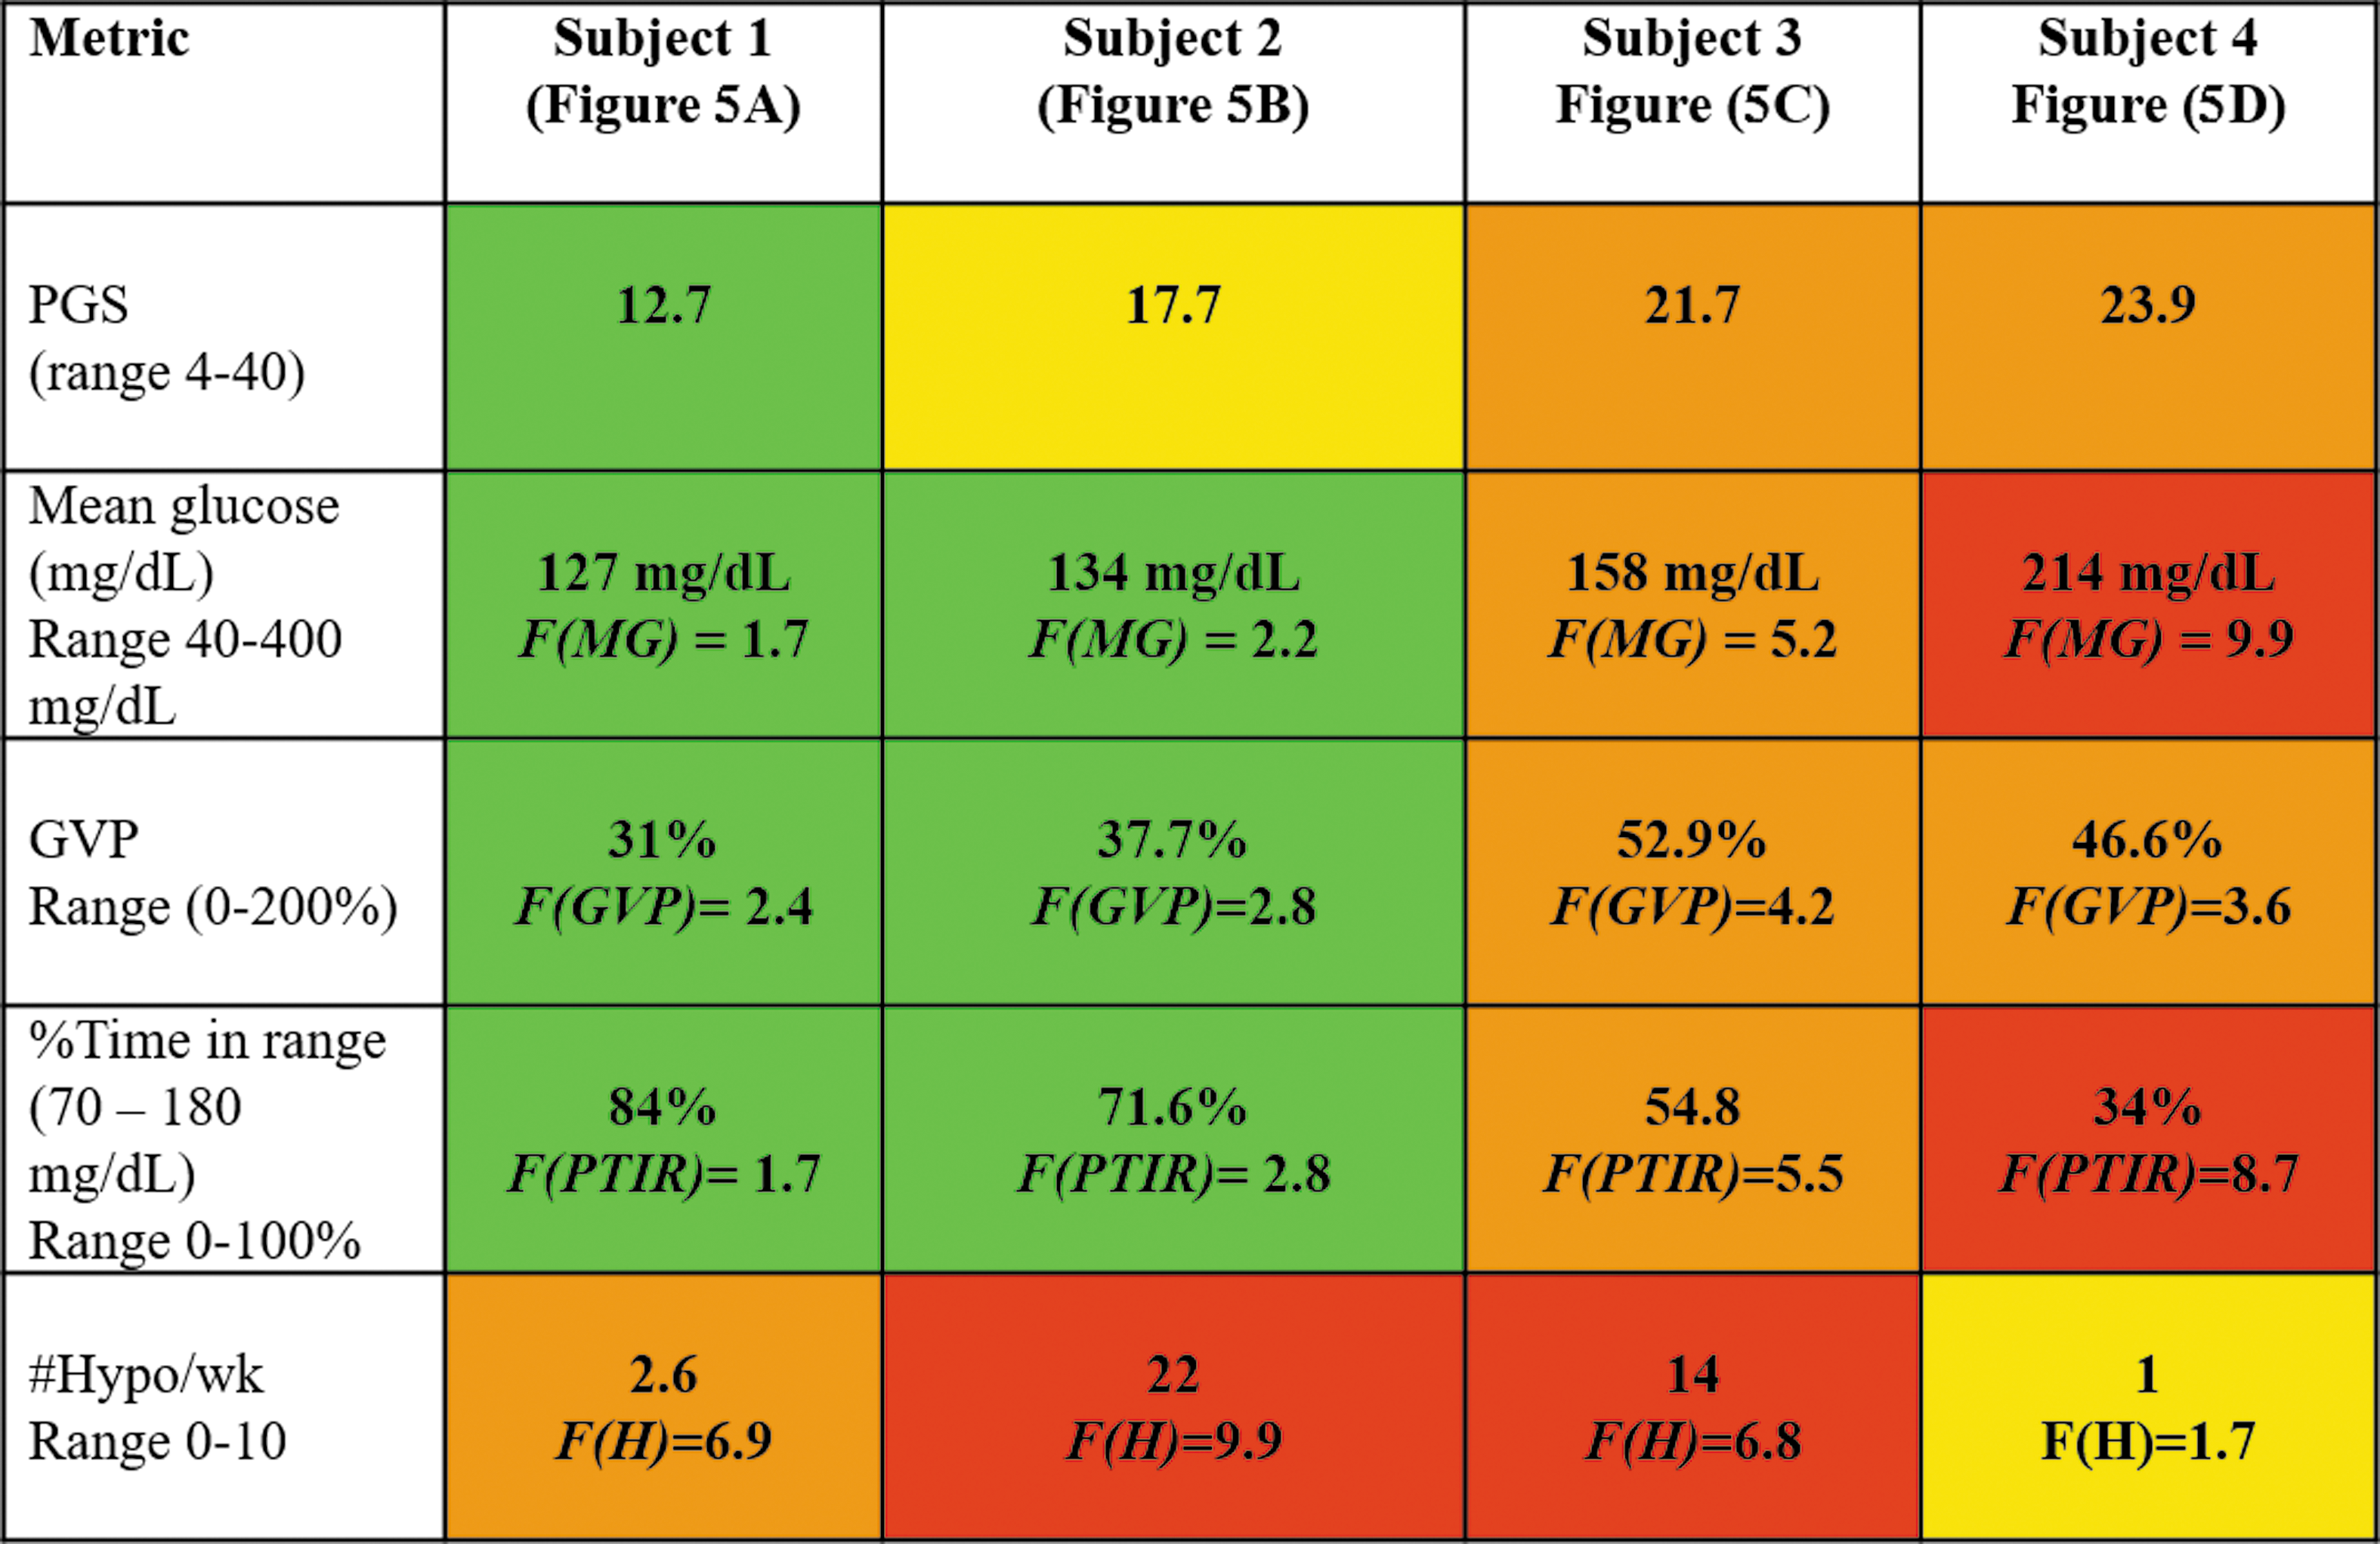
The PGS composite index and values of component elements for four subjects shown in Figure 3. Green indicates excellent glycemic control, yellow good glycemic control, orange moderate glycemic control, and red poor glycemic control.
In addition, we analyzed data from a small cohort of subjects (n = 5) for which there were weekly data downloads for up to 2 years. The purpose of this analysis was to assess the degree to which the value of the PGS composite index might depend on the time duration of the data set used in the analysis. Neylon et al. suggested that there could be a minimum duration over which glycemic variability measurements would be valid. 21 We found no difference in the PGS composite index studied at 6 months after initiation of continuous glucose monitoring use whether we considered a period of 1 week, 1 month, 3 months, or 6 months duration.
Finally, we applied the PGS composite index to open loop and closed loop control data from a recently published study on the bionic pancreas. 20 Figure 6 shows the change in the distribution of the PGS composite index values from the open loop arm of the study to the closed loop arm. The percentage of subjects with excellent glycemic control equivalent to patients without diabetes (PGS ≤ 15) increased from 13.5% in open loop to 44.2% in closed loop. Similarly, the percentage of subjects with good glycemic control (15 < PGS ≤ 20) increased from 38.5% in open loop to 42.2% in closed loop. The percentage of subjects with moderate glycemic control (20 < PGS ≤ 25) decreased from 34.5% in open loop to 9.6% in closed loop. In the open loop arm, 13.5% of subjects were in poor control (PGS > 25) whereas only 3.8% subjects were in that range for the closed loop arm. Analysis of the data using the PGS composite index shows the dramatic improvement in glycemic control achieved by approximately three-quarters of the subjects, but also highlights the need for further reducing the glycemic variability and occurrence of hypoglycemic events in the remaining one-quarter of subjects in the closed loop arm.
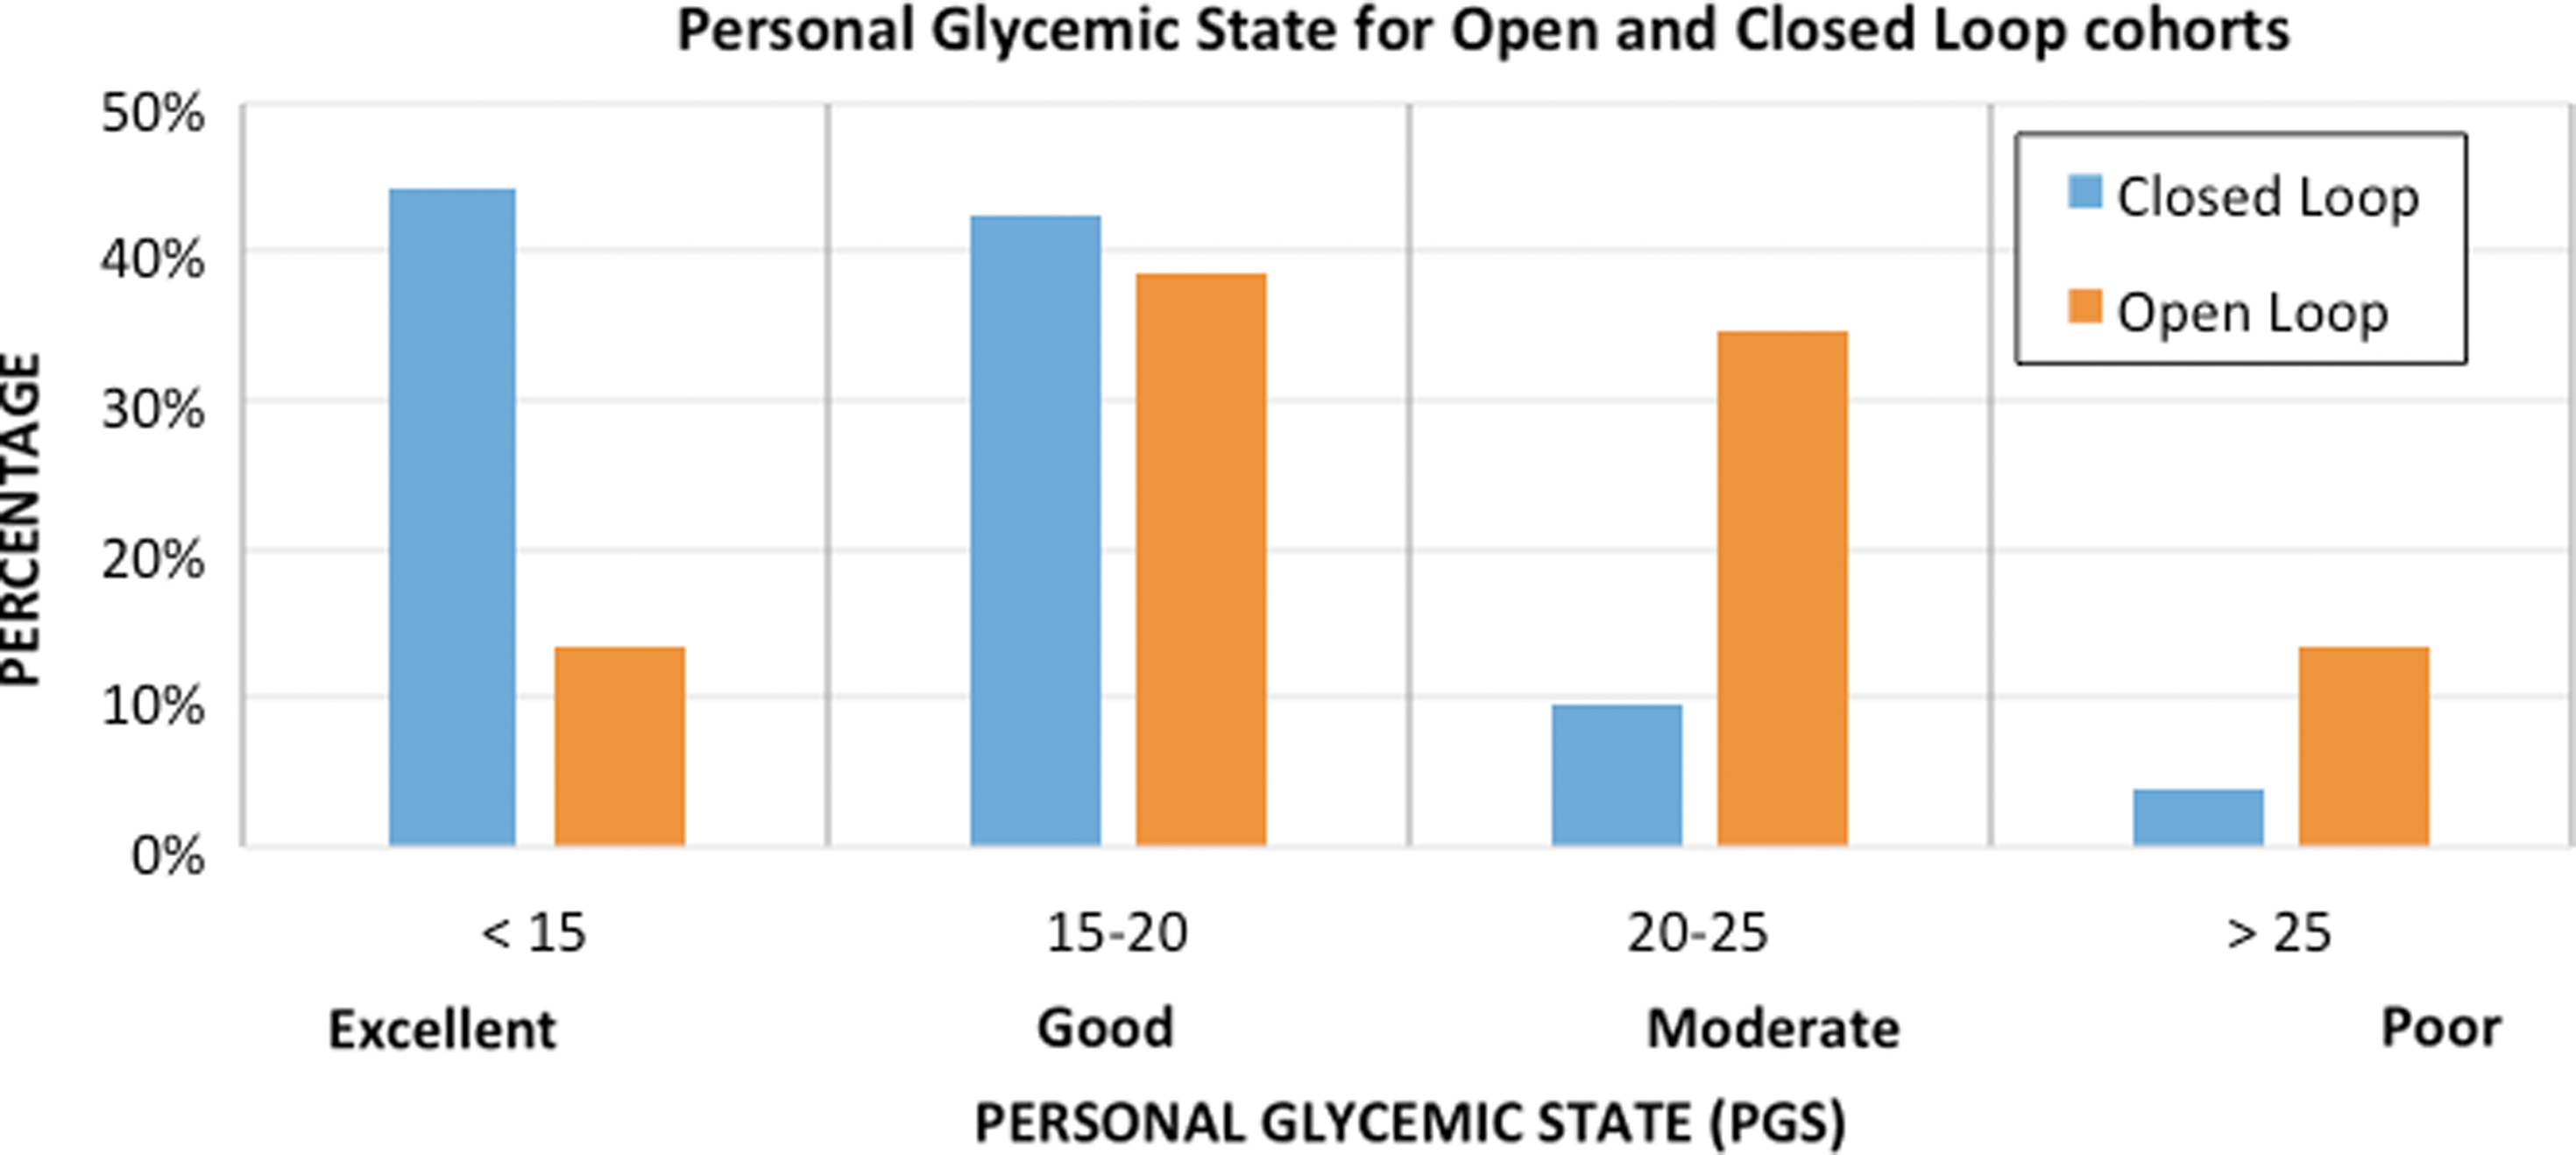
Change in the distribution of the PGS metric from open loop to closed loop in published bionic pancreas study. 20
Figure 7 shows the shows two representative temporal glycemic traces from a subject in the open loop arm of the study (top) and the closed loop arm of the study (bottom). In this example, the composite PGS index was PGS = 20.8 in the open loop data and PGS = 17.2 in the closed loop. The mean glucose was 150.3 mg/dL in the open loop control and 120.2 mg/dL in the closed loop. The percent time in range was 64.3% in open loop and 76.5% in closed loop. However, the glycemic variability was GVP of 61.3% in open loop compared with 67% in closed loop indicating continued levels of high glycemic variability in both phases of the study. In the open loop data, there were eight hypoglycemic episodes ≤54 mg/dL and four additional episodes <70 mg/dL. In the closed loop example, there were 13 hypoglycemic episodes ≤54 mg/dL and 4 additional episodes <70 mg/dL indicating unresolved issues with hypoglycemia.
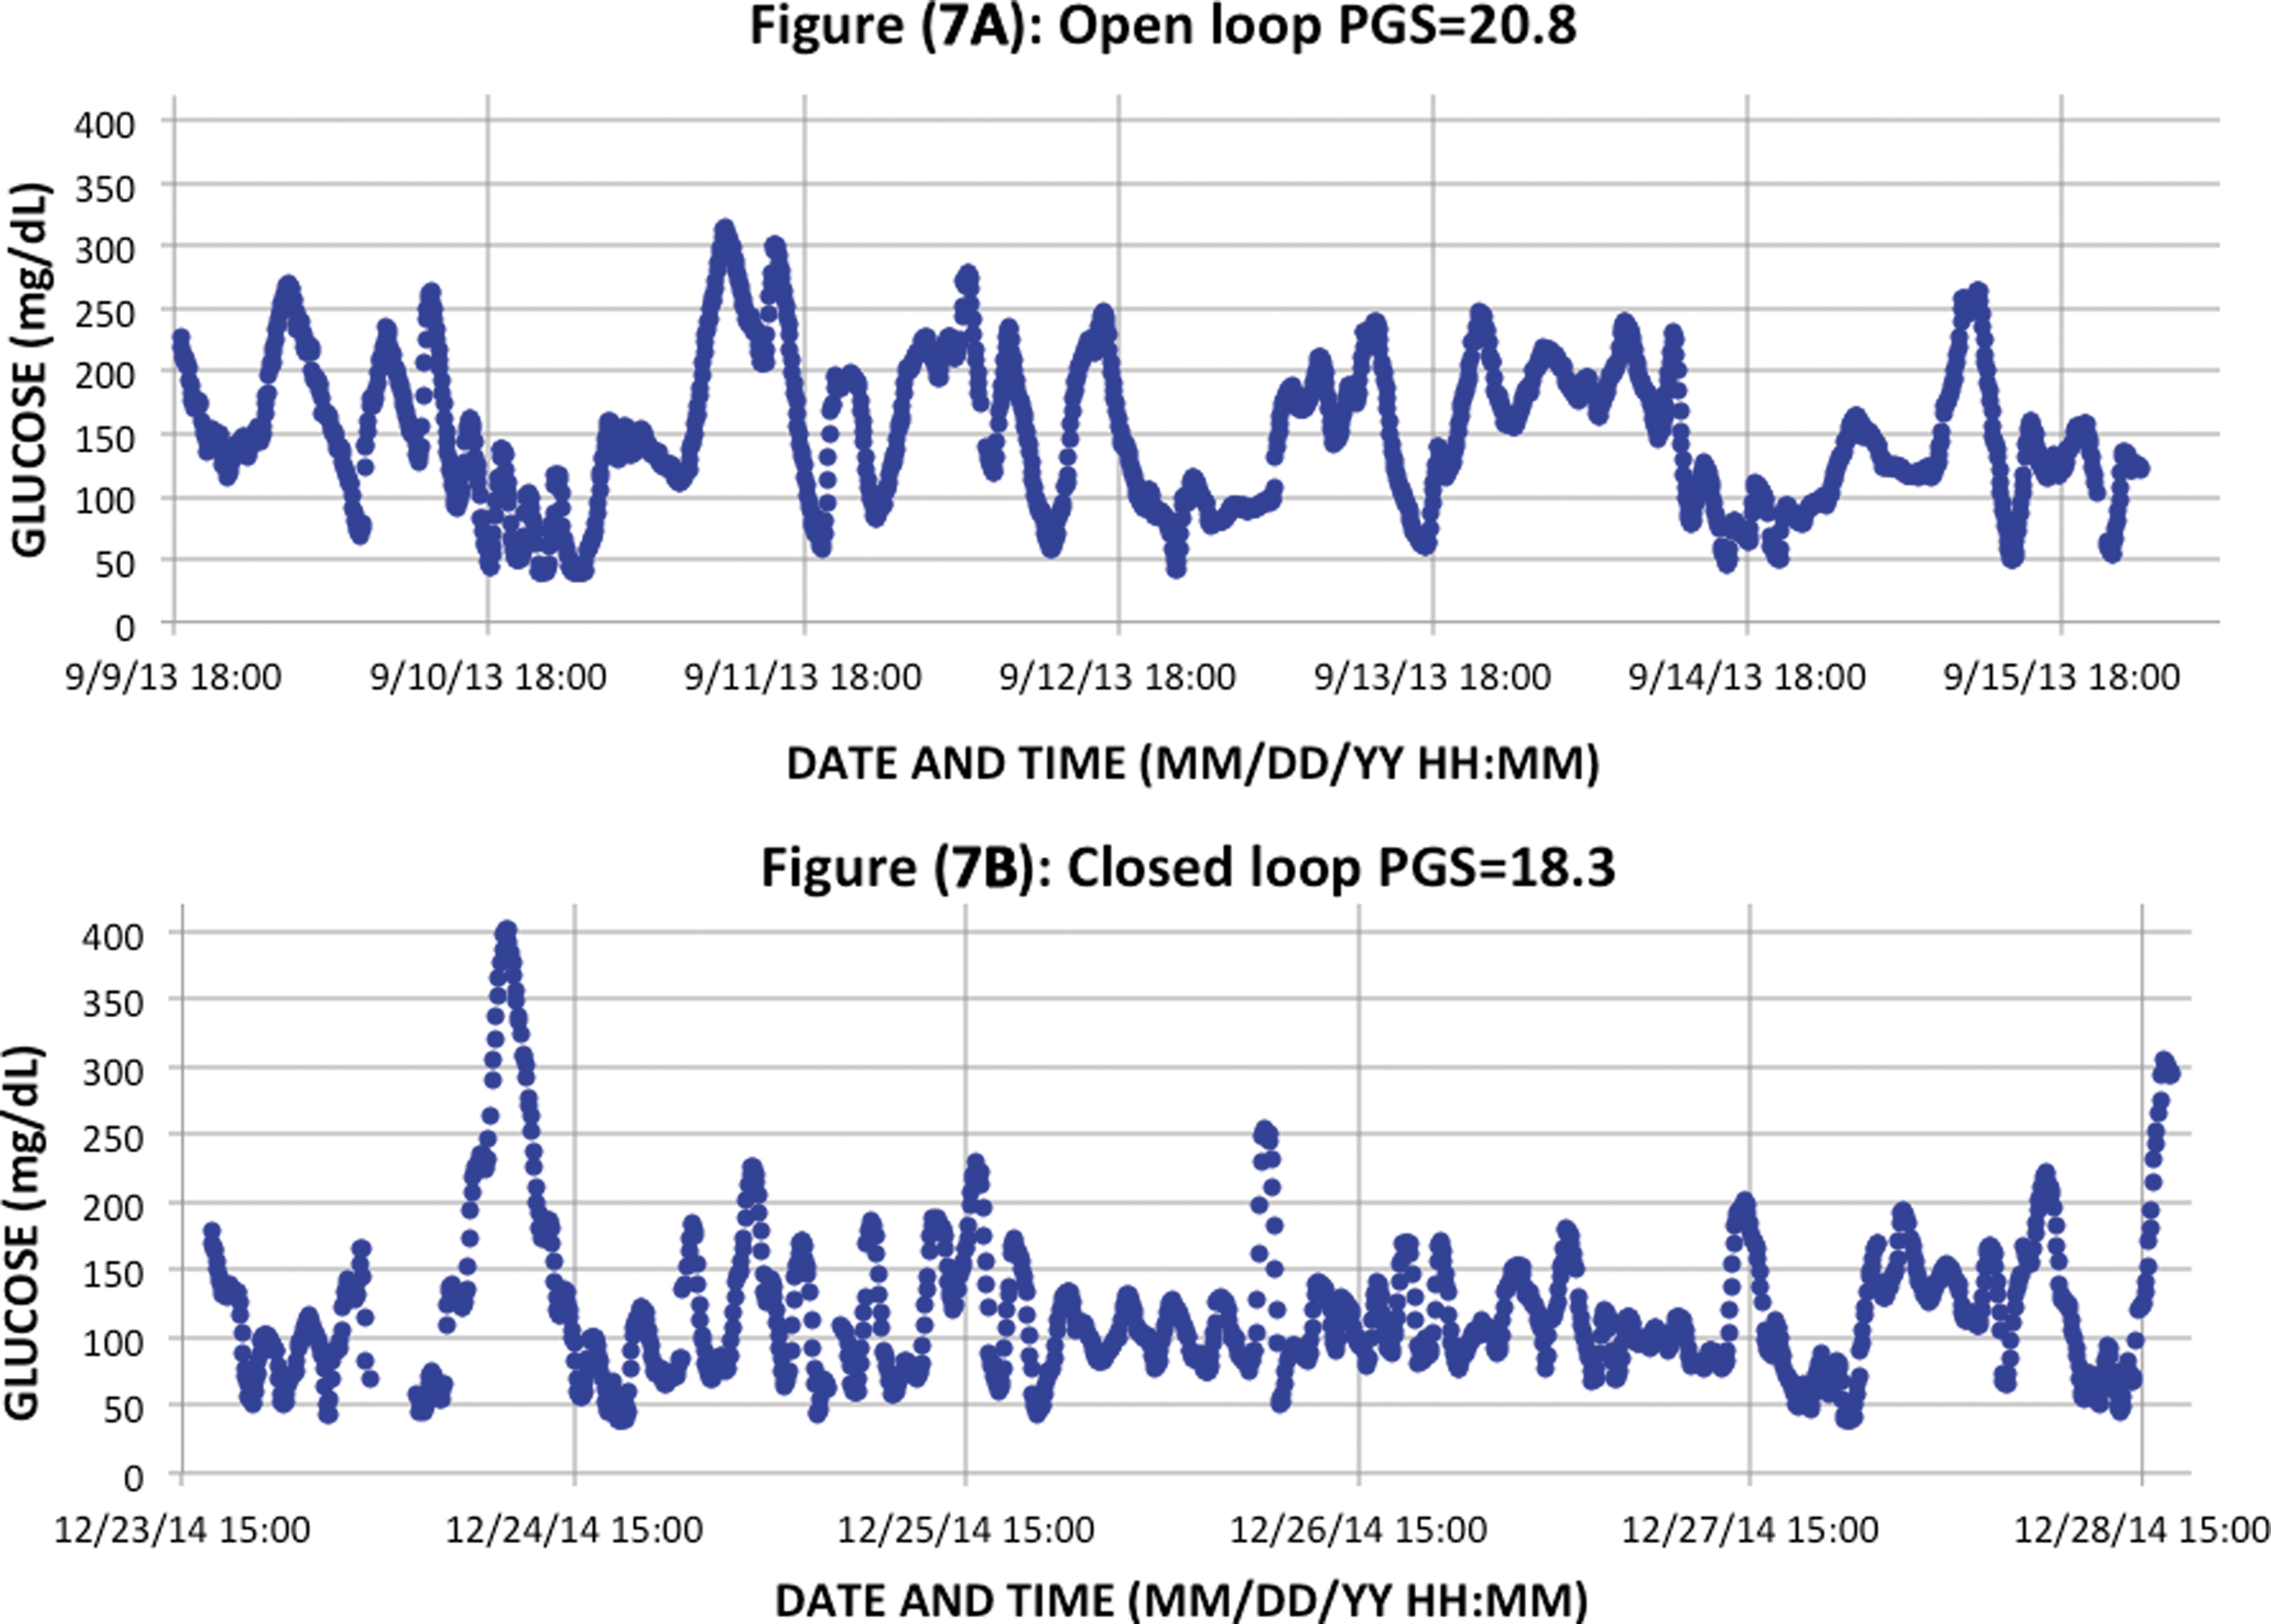
Temporal traces from open loop (top) and closed loop (bottom) control from a recently published study on the bionic pancreas. 20 Although the mean glucose was 150.3 mg/dL in open loop (Figure (7A)) and 120.2 mg/dL in closed loop (Figure (7B)), the overall quality of glycemic control between these two cases remained in the moderate zone and decreased only slightly from PGS = 20.8 in open loop to PGS = 18.3 in closed loop due to continued high levels of glycemic variability and a high incidence of marked hypoglycemic episodes <54 mg/dL per week.
Although there were significant reductions in PGS values overall in the closed loop cohort, there were particular subjects with PGS values remaining in the moderate quality of glycemic control range. Component analysis of the PGS metric suggests that many of these subjects would benefit from efforts to reduce glycemic variability and the incidence of hypoglycemic events below 54 mg/dL. This could be achieved by varying input parameters to the closed loop algorithm or might indicate the need for further improvement of the algorithm itself.
Discussion
Analysis of the data sets from volunteer subjects without diabetes and subjects with diabetes using the PGS composite index as a measure of overall glycemic control shows the difference in multiple dimensions in control between the two groups. Subjects without diabetes have lower mean glucose, lower glycemic variability, increased time in range and fewer (if any) hypoglycemic events below 70 mg/dL and fewer still below 54 mg/dL. In patients with type 1 diabetes, there is a large range of mean glucose, glycemic variability, time in range, and instances of hypoglycemic events below 70 mg/dL and below 54 mg/dL. Use of the PGS composite index in subjects with diabetes can help readily identify areas requiring further attention by the healthcare provider and by the patient (or caregiver) to further improve clinical outcomes. A healthcare provider could use an elevated value of the PGS composite index to identify which element or elements are responsible for the elevated PGS value. In many patients with low mean glucose and A1c values, frequent hypoglycemic events below 70 mg/dL or certainly below 54 mg/dL pose a significant risk for acute clinical complications.
While we found no dependence of the PGS composite index on the duration of data included in the metric, we recommend a minimum of 1 week of sensor data to give an appropriately representative data sample. We also recommend that when longer data sets are used, such as 3 or 6 months, that the healthcare provider focus separately on the most recent 2 weeks or 1 month to provide the most relevant assistance to the patient.
A major goal of artificial pancreas clinical studies has been the reduction of mean glucose. Numerous groups have published data showing such reductions using a wide range of different algorithms. 22,23 As discussed by Russell et al. subjects in the closed loop arm of a bionic pancreas study had lower mean glucose and significantly improved overall glycemic control than subjects in the open loop arm. 20 Analysis with the PGS composite metric shows over two-fifths of study subjects achieved a quality of glycemic control characteristic of patients without diabetes. Both the PGS composite index and its component elements may be helpful as an additional tool analyzing artificial pancreas clinical data and leading to still further improvements in the quality of glycemic control with artificial pancreas devices.
Conclusions
The purpose of all therapies in diabetes is to improve glycemic control. In the aftermath of the results of the landmark Diabetes Control and Complications Trial (DCCT) study in 1993, the quality of glycemic control has been reported largely in terms of A1c, which is associated physiologically with mean glucose. In 2008, Nathan et al. proposed a simple mathematical equation relating A1c to mean glucose. 24 However, in 2011 Kuenen et al. suggested there was an effect from glycemic variability on measurement of A1c. 25 We believe that continuous glucose monitoring data can be used to shed light on the multiple dimensions associated with glycemic control independent of A1c. An approach characterized as the “Glucose Pentagon” attempted to address this issue with a graphical system. 26 Rodbard reviewed previous attempts to develop an integrated metric for overall glycemic control and noted their limited use in clinical practice. 27
The composite index proposed here, the PGS, is similar in spirit to Rodbard's recommendation that a more useful metric could be derived by combining a number of factors. The PGS metric does not require graphical interpretation and may be better suited for the time-constraints of current clinical practice not as a definitive tool, but as an aid to helping healthcare providers identify problem areas in glycemic control. The composite metric proposed here may be helpful in assessing glycemic control both in routine clinical practice and in research studies involving trials of new pharmacologic interventions or the use of new devices such as the artificial pancreas.
Despite significant technical advances and numerous studies showing clinical benefit, continuous glucose monitoring devices are still used by only a small fraction of the patient population who could benefit from the technology. In December 2016, the U.S. Food and Drug Administration (FDA) approved the use of data from the G5 Mobile continuous glucose monitoring system (Dexcom, San Diego, CA) for insulin dosing decisions. 28 Given this expanded indication and likelihood of further improvements in continuous glucose monitoring technology from multiple manufacturers, larger number of patients can be expected to utilize this technology in the future. However, the majority of these patients will likely receive their care from primary care physicians rather than endocrinologists with expertise in diabetes technology. A simple composite index such as the PGS may be helpful to those patients and practitioners in the coming years. The PGS is not intended to replace a review of a CGM download, but rather to allow for rapid assessment of the domains of glycemic control captured by the components of the metric. The PGS could allow a provider to assess what areas need to be addressed in a clinic visit, for example, hypoglycemia, glucose variability, percent time in range, and mean glucose. The PGS composite could also be used for rapid assessment of the quality of the patient's glycemic control from one clinic visit to the next. The overall PGS value and the component scores might assist a provider or patient to quickly identify opportunities for changes in the therapeutic regimen when looking at modal day reports and other CGM data displays. If the PGS was low indicative of good glycemic control, the visit could quickly move beyond evaluation of glucose values and focus on other issues in diabetes management that are often neglected such as lifestyle and psychological adjustment.
In September 2016, the FDA approved the first artificial pancreas device system, the 670G (Medtronic MiniMed, Northridge, CA). 29 Artificial pancreas or automated glucose control systems may also become widely adopted in the next 5 to 10 years. These devices are likely to reduce mean glucose, but improved glycemic control involves more than simply reducing the mean glucose. The PGS composite index for glycemic control may be helpful in understanding data from future closed loop clinical studies, in identifying differences between competing algorithms and products in addition to potential areas for improvement in such algorithms.
Footnotes
Author Disclosure Statement
I.B.H. is a consultant for Abbott Diabetes Care, Roche, Intarcia, and Valeritas. A.K.B., K.S., and A.G. are employees of Dexcom. B.A.B. has received research support from and has consulted for Dexcom, Medtronic, Tandem, and Bigfoot Medical. T.A.P. is an employee of ModeAGC LLC and has consulted for Dexcom, Insulet, and Tandem.
References
Supplementary Material
Please find the following supplemental material available below.
For Open Access articles published under a Creative Commons License, all supplemental material carries the same license as the article it is associated with.
For non-Open Access articles published, all supplemental material carries a non-exclusive license, and permission requests for re-use of supplemental material or any part of supplemental material shall be sent directly to the copyright owner as specified in the copyright notice associated with the article.