
Abstract
Background:
Users of continuous glucose monitoring (CGM) systems are concerned with the frequency of inserting and calibrating new sensors, with sensor accuracy and reliability throughout the sensor's functional life, and with the risks associated with inaccurate sensor readings.
Methods:
A sensor for our next-generation CGM system was tested for accuracy by comparison with self-monitored blood glucose (SMBG) values throughout 10 days of wear. Fifty subjects (49 with type 1 diabetes, 1 with type 2 diabetes, 20 male, mean ± standard deviation [SD] age 32.5 ± 18.7 years) enrolled. Subjects wore one sensor each, calibrated it once per day, and obtained multiple daily SMBG values for comparison. A total of 2739 paired CGM-SMBG values were analyzed to arrive at standard accuracy statistics and plotted on the surveillance error grid (SEG) to estimate the risk of SMBG-CGM discrepancies.
Results:
The overall mean and median absolute relative difference (ARD) values were 9.6% and 7.2%, respectively. The median ARD values ranged from 8.9% on Day 1 to 6.5% on Day 10. SEG analysis categorized 2727 points (99.6%) as “no” or “slight” risk and 12 points (0.4%) as “moderate” or “great” risk. Thirty-nine (79.6%) of the 49 systems worked through the end of Day 10. Sensors and adhesives were well tolerated, with minimal erythema and induration.
Conclusions:
This new CGM system's accuracy throughout its 10-day functional life, the convenience associated with once-daily calibrations, and the high proportion of measurements in the “no risk” zone of the SEG support its nonadjunctive use in diabetes management and closed-loop insulin delivery systems.
Introduction
A
In response to concerns that inaccurate blood glucose measurements could lead to inappropriate diabetes treatment decisions, the surveillance error grid (SEG) was developed using an advanced mathematical interpretation of questionnaire responses from 206 clinicians. 3 In contrast to the Clarke and Parkes Error Grids, the SEG provides asymmetric, nonlinear boundaries between risk categories and allows for a more granular assessment of the risk associated with inaccurate glucose measurements.
The SEG was designed to be used as a tool for postmarket surveillance of blood glucose meters, but it has recently been used to characterize the performance of a flash glucose monitoring system 4 and a marketed CGM system. 5 We conducted a clinical trial to evaluate the safety, accuracy, reliability, and risks of an investigational CGM sensor calibrated once per day over the course of 10 days.
Materials and Methods
A next-generation Dexcom® CGM system includes a novel subcutaneous glucose sensor and algorithm. Patients of ages 6 years and older who had been diagnosed with type 1 or type 2 diabetes were eligible for inclusion. Each subject wore a sensor for 10 days, during which they were asked to calibrate the sensor with self-monitored blood glucose (SMBG) values from the Contour™ Next glucose meter (Ascensia Diabetes Care, Parsippany, NJ) once per day and to obtain four or more SMBG readings per day to provide values for comparison with CGM values and to inform diabetes management decisions. Pairs in which the SMBG value was used for calibrating the sensors were excluded from the accuracy analysis. Pairs in which the CGM value was outside the system display range, that is, <40 or >400 mg/dL (displayed as “LOW” or “HIGH,” respectively), were also excluded from the accuracy analysis. Written informed consent was obtained from each adult subject and from a parent or legal guardian of each subject younger than 18 years. Subjects younger than 18 years provided assent. The paired SMBG-CGM points were mapped to the SEG and the proportion of points in various risk categories was obtained by using the Excel macro as described. 6
Results
Fifty subjects (49 with type 1 diabetes, 1 with type 2 diabetes, 20 male, mean ± standard deviation [SD] age 32.5 ± 18.7 years) enrolled and one subject withdrew before providing sensor data. Thirty-one of the 2770 matched pairs were excluded from complete analysis because the CGM estimate was <40 or >400 mg/dL, leaving 2739 matched pairs for accuracy analysis. Of the 14 excluded pairs with CGM values <40 mg/dL, the corresponding SMBG values ranged from 45 to 92 mg/dL, and of the 17 pairs with CGM values >400 mg/dL, the corresponding SMBG values ranged from 373 to 561 mg/dL; three of these were <400 mg/dL. Table 1 shows the number of matched pairs obtained during each day of sensor wear and corresponding mean absolute relative difference (ARD) values. The overall mean (±SD) ARD was 9.6% ± 10.1% and the overall median ARD was 7.2%. The overall bias was −3.4 mg/dL. The percentage of CGM values within 15% of paired SMBG values (or within 15 mg/dL for paired SMBG values ≤100 mg/dL) was 82.4%; the analogous within-20% agreement rate was 90.9%. Figure 1 shows the median ARD for each day of sensor wear and the corresponding interquartile range. The median ARD ranged from 8.9% on Day 1 to 6.5% on Day 10. Thirty-nine (79.6%) of the 49 systems worked through the end of Day 10. Sensors and adhesives were well tolerated, with minimal erythema and induration.
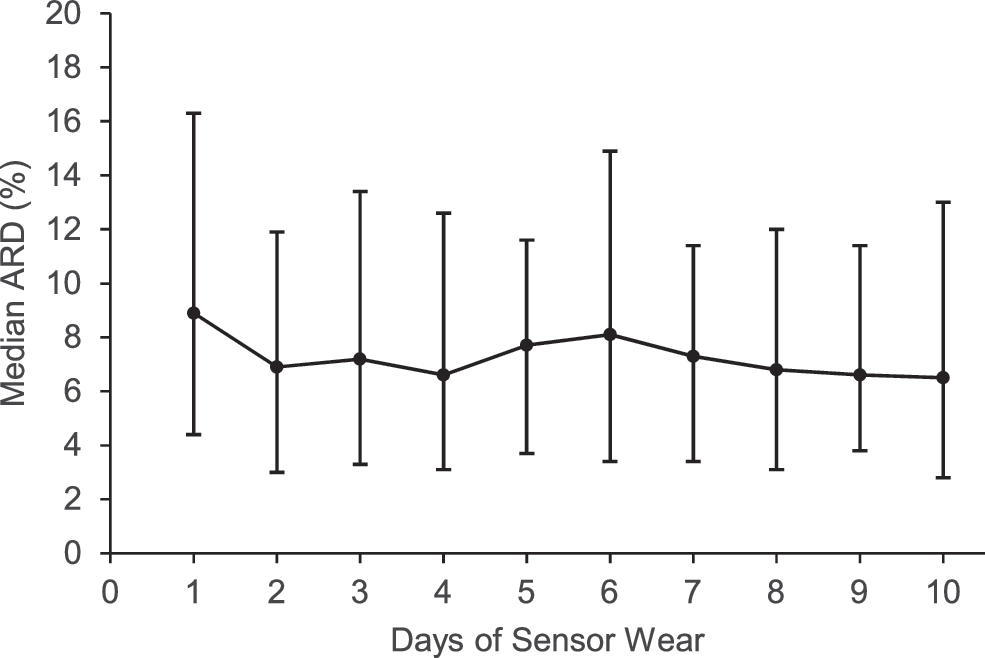
Median ARD between CGM and reference SMBG values on each day of sensor wear. Error bars show interquartile ranges. ARD, absolute relative difference; CGM, continuous glucose monitoring; SMBG, self-monitored blood glucose.
ARD, absolute relative difference.
Results of the SEG analysis are given in Figures 2 and 3. The overall risk presented by SMBG-CGM discrepancies is quite low, with 99.6% of recorded data pairs representing no or slight risk. Most of the points in the “moderate” risk zones were recorded on Days 6–10 of sensor wear, and two outlier points representing “great” risk were noted on Days 2 and 10.
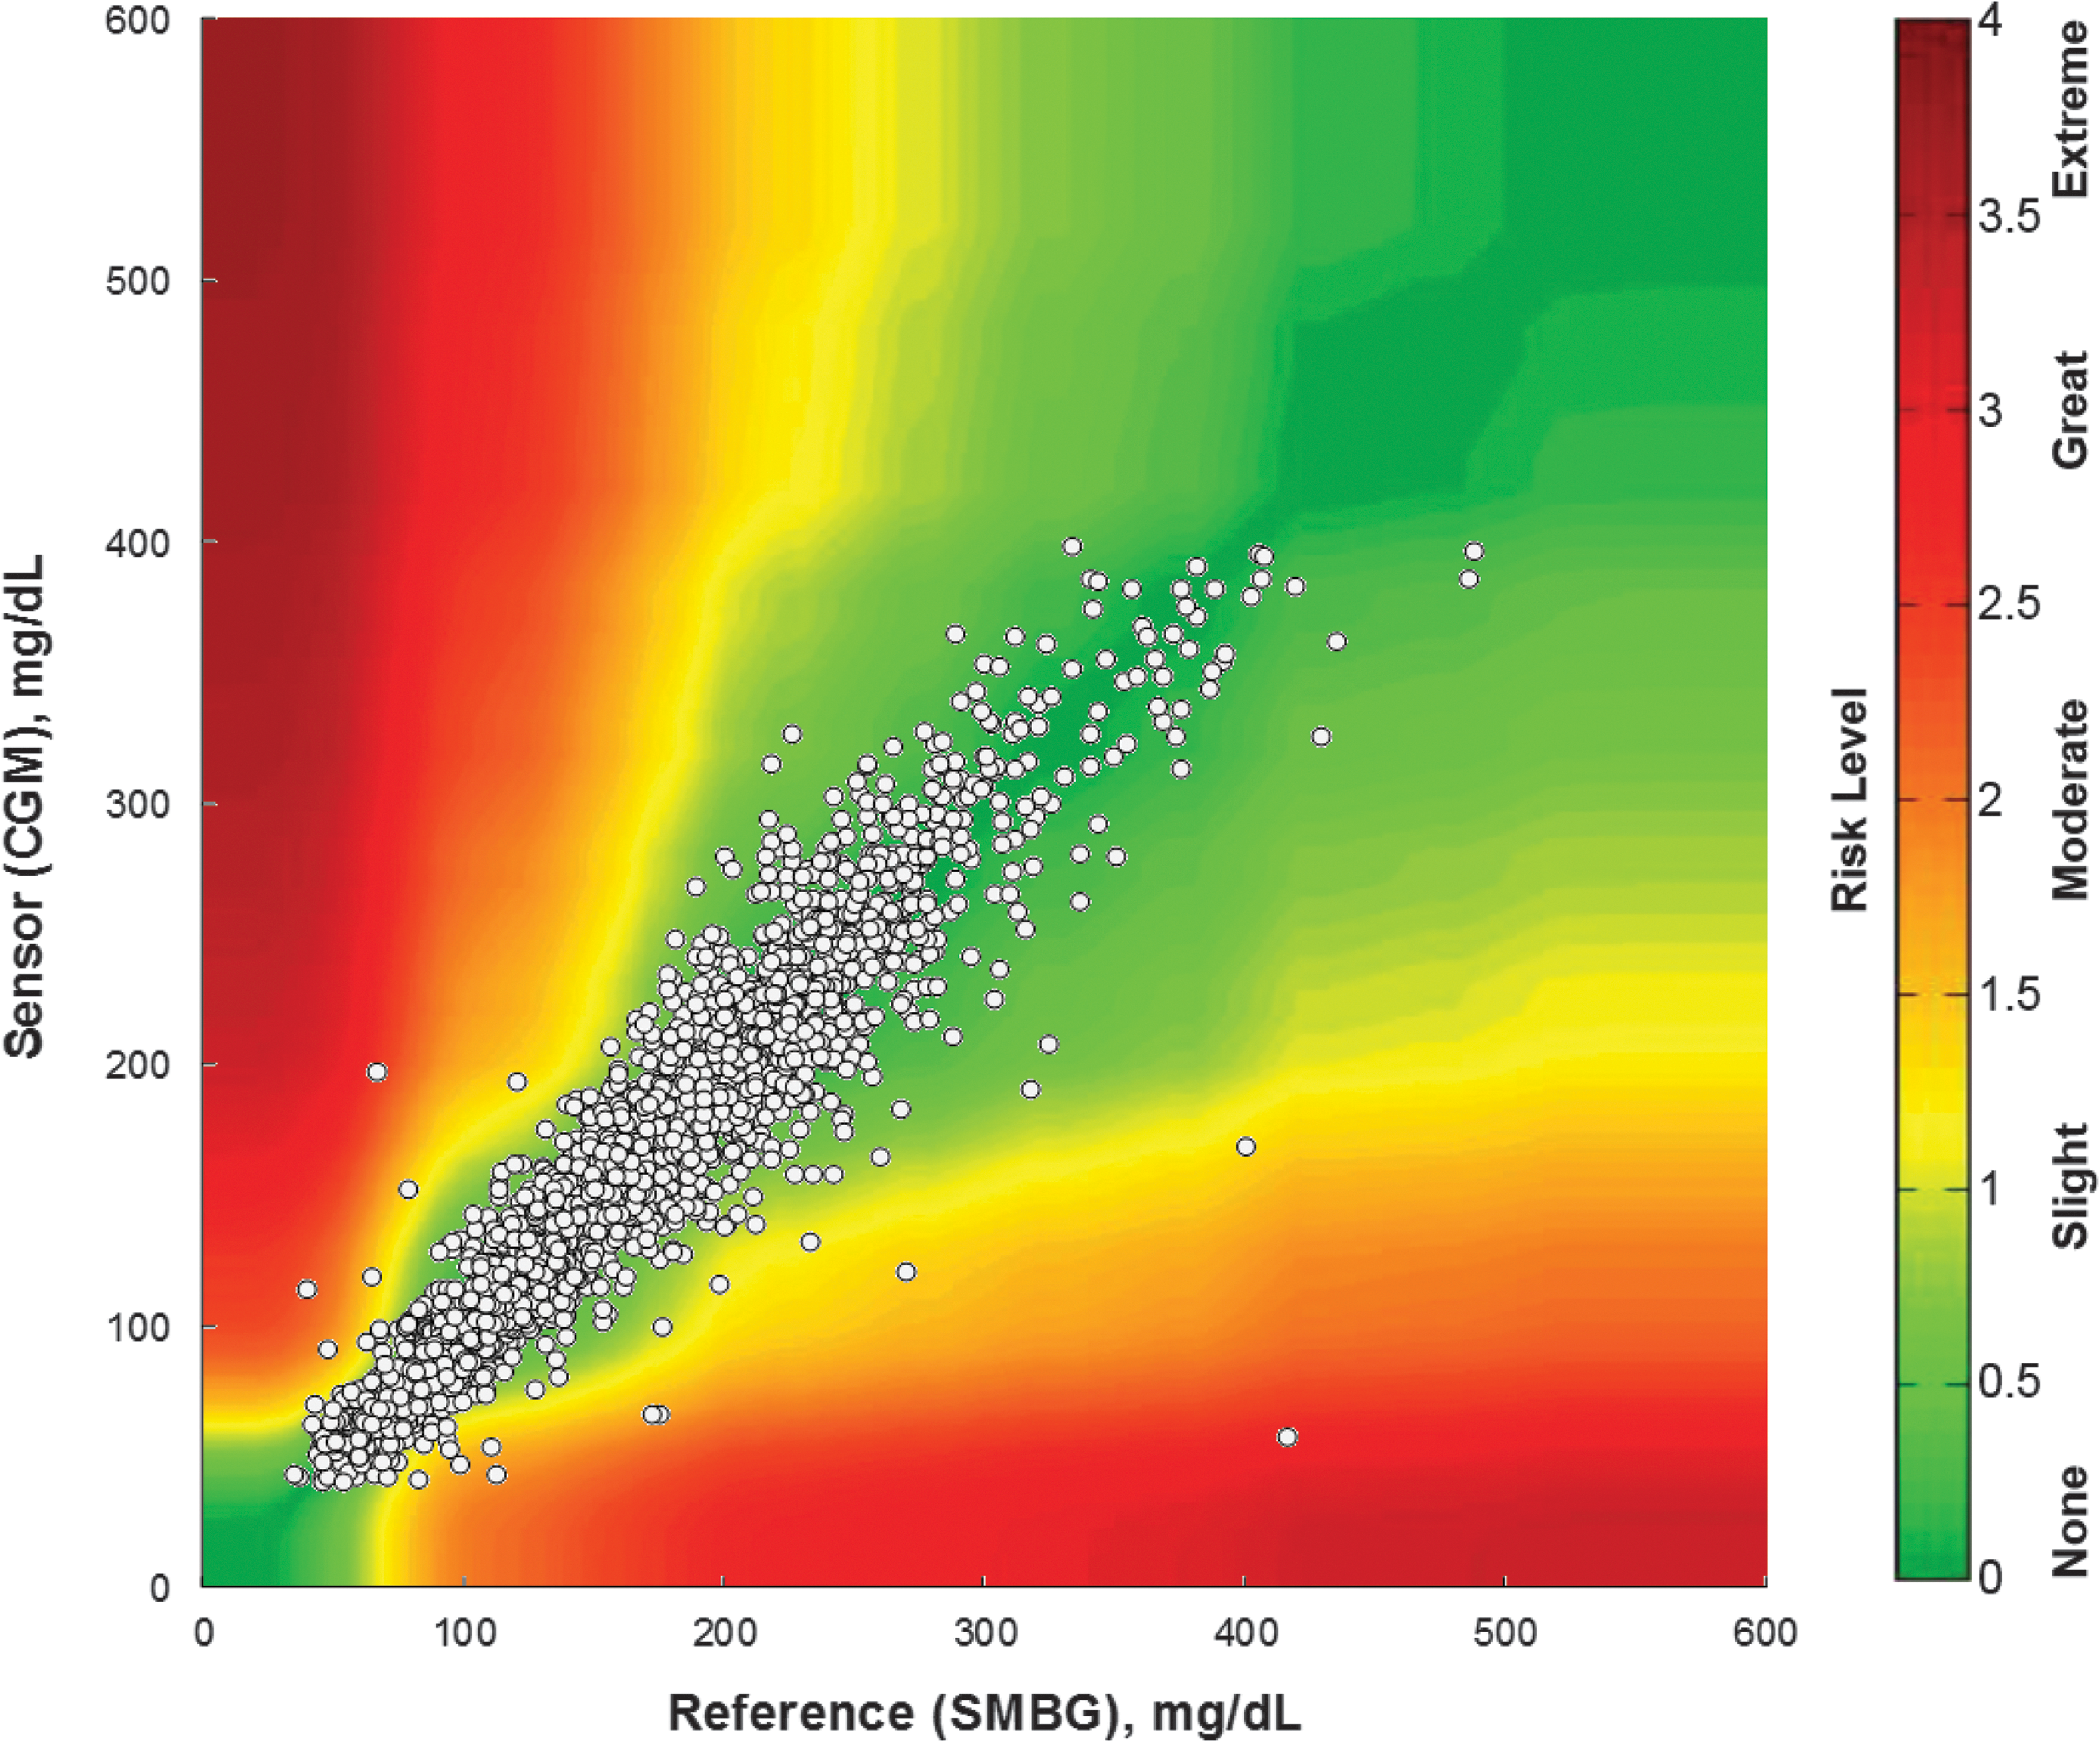
Surveillance error grid showing assigned risk levels of CGM-SMBG paired points.
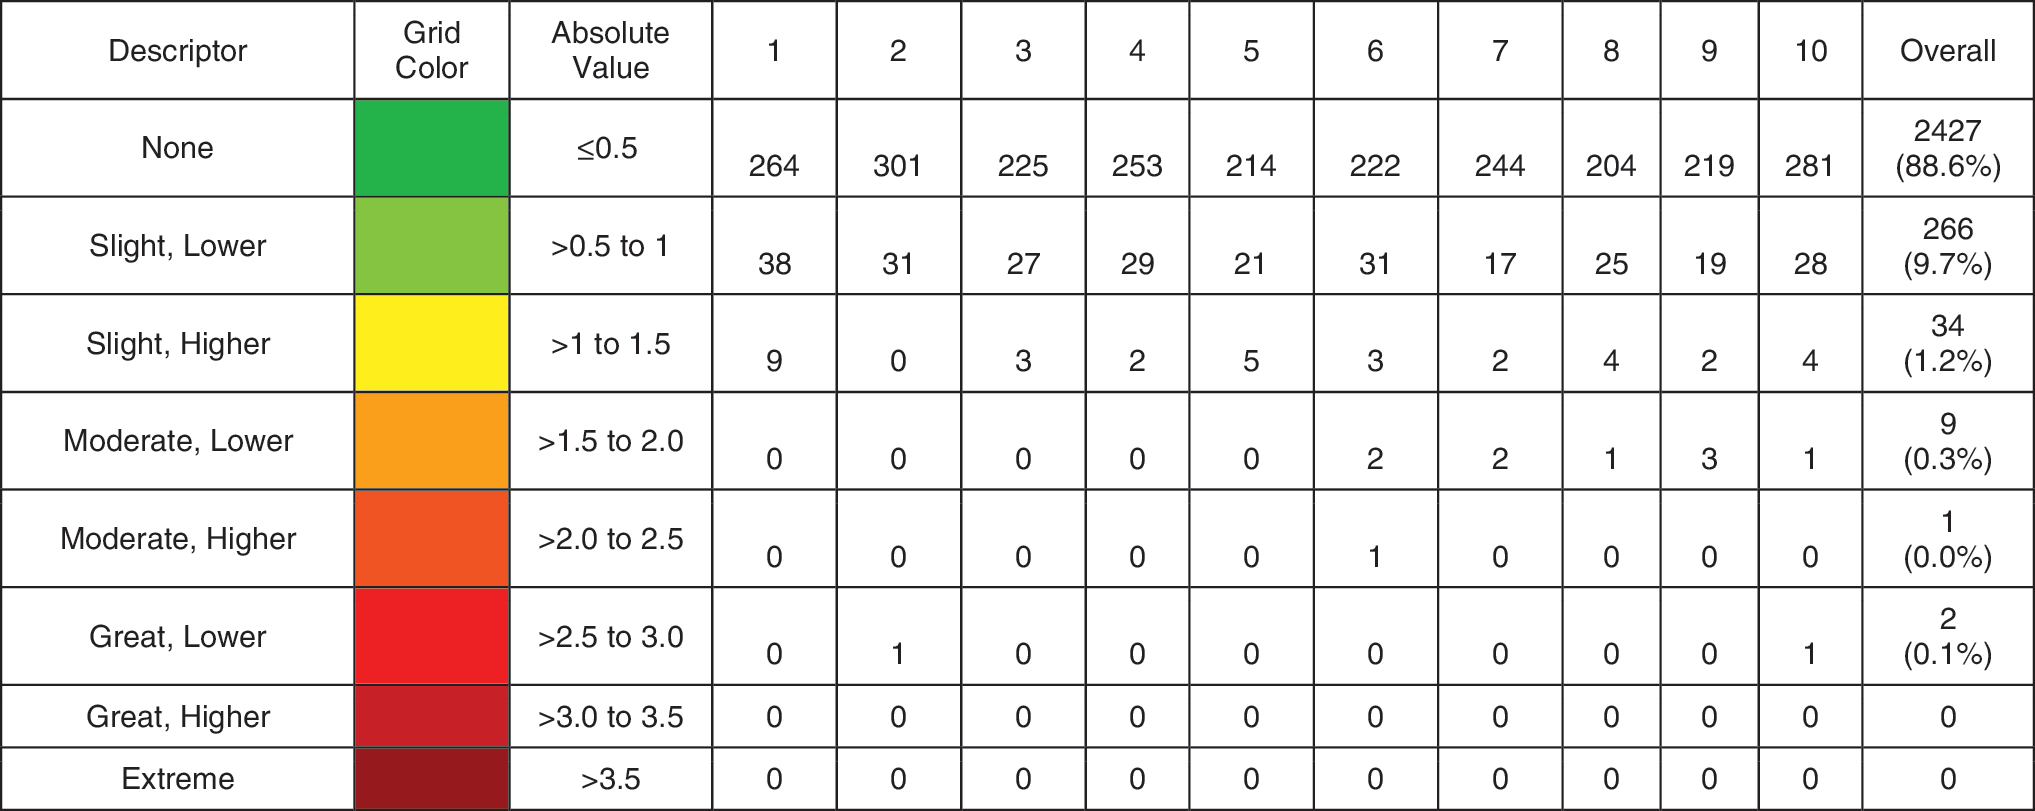
Number and percentage of points in various risk zones of the surveillance error grid.
Discussion
Dexcom's currently marketed G4® PLATINUM/G5® Mobile sensors are indicated for 7 days of use and require twice-daily calibrations. To address these limitations, recent studies have examined sensor survival and accuracy for 14 days of wear 7 or have retrospectively analyzed data with algorithms to simulate the expected accuracy with once-daily calibrations. 8 The next-generation sensor and its novel algorithm introduced here implement several design and manufacturing changes that are aimed at longer wear and less-frequent calibrations. The use of SMBG data as a CGM comparator is common, but definitive accuracy studies typically use a reference instrument to measure glucose concentrations in venous blood samples.
Large and potentially risky discrepancies between SMBG and CGM data, as seen in the SEG analysis, may be attributable to erroneous SMBG values, erroneous CGM values, or both. Some of the outliers seen in Figure 2 may be because of deviations from best handwashing practices, which are a common cause of pseudohyperglycemia. 9,10 The rare outliers with inaccurate CGM values highlight the need for patients to incorporate rate-of-change information and threshold alerts into their management strategies.
A recent FDA decision 11 allows use of data from the G5 Mobile CGM system for diabetes treatment decisions without confirmatory SMBG testing, a decision that aligns the United States with other jurisdictions and is expected to increase adoption and persistent use of the technology. The present system's performance suggests that its data can also be safely used in this manner. 12,13 When paired with appropriate fault detection, safety, and remote monitoring algorithms, CGM systems such as the one described here may also form an important component of closed-loop artificial pancreas systems. 14
Footnotes
Acknowledgment
This study was funded by Dexcom, Inc.
Author Disclosure Statement
The authors are employees of Dexcom, Inc.