
Abstract
Background:
Traditionally, insulin bolus calculations for managing postprandial glucose levels in individuals with type 1 diabetes rely solely on the carbohydrate content of a meal. However, recent studies have reported that other macronutrients in a meal can alter the insulin required for good postprandial control. Specifically, studies have shown that high-fat (HF) meals require more insulin than low-fat (LF) meals with identical carbohydrate content. Our objective was to assess the mechanisms underlying the higher insulin requirement observed in one of these studies.
Materials and Methods:
We used a combination of previously validated metabolic models to fit data from a study comparing HF and LF dinners with identical carbohydrate content in seven subjects with type 1 diabetes. For each subject and dinner type, we estimated the model parameters representing the time of peak meal-glucose appearance (τ m), insulin sensitivity (S I), the net hepatic glucose balance, and the glucose effect at zero insulin in four time windows (dinner, early night, late night, and breakfast) and assessed the differences in model parameters via paired Wilcoxon signed-rank tests.
Results:
During the HF meal, the τ m was significantly delayed (mean and standard error [SE]: 102 [14] min vs. 71 [4] min; P = 0.02), and S I was significantly lower (7.25 × 10⁻⁴ [1.29 × 10⁻⁴] mL/μU/min vs. 8.72 × 10⁻⁴ [1.08 × 10⁻⁴] mL/μU/min; P = 0.02).
Conclusions:
In addition to considering the putative delay in gastric emptying associated with HF meals, we suggest that clinicians reviewing patient records consider that the fat content of these meals may alter S I.
Introduction
C
Traditionally, high-fat (HF) meals have been thought to delay gastric emptying, 5 thus motivating the use of extended or dual-wave boluses to cover these meals. However, it is not commonly believed that HF content requires an increased amount of insulin. Nonetheless, a prospective randomized controlled trial (RCT) using an artificial pancreas system to control low-fat (LF) and HF dinner meals with identical carbohydrate content showed that even with 42% more insulin being delivered, the glucose levels during the HF meal remained elevated. 6
To better understand this finding and to possibly develop an improved method of adjusting the bolus recommendations covering HF meals, we sought to identify the mechanism responsible for the increased insulin requirement observed in the original RCT. 6 In this study, we hypothesized that in addition to the putative effect of fat to delay gastric emptying, it may also limit insulin's ability to increase glucose uptake into peripheral tissues and suppress endogenous glucose production. We tested this hypothesis by fitting the plasma insulin and glucose data obtained from the RCT study 6 to previously validated metabolic models describing the time of peak meal-glucose appearance (τ m) that represents the time constant of gastric emptying, 7 the pharmacokinetic profile of insulin following subcutaneous delivery, 8 the delay in the effect of insulin to enhance glucose uptake into cells, the S I of the cells, and the glucose effect at zero insulin (GEZI) to suppress endogenous glucose production and increase glucose uptake into cells. 9
Materials and Methods
Subject characteristics, meal composition, and study design of the RCT quantifying the increase in insulin required to cover HF versus LF meals are provided in the original publication 6 (for complete meal description, see comments made by Wolever 10 in a Letter to the Editor and the author's response 11 ).
In brief, seven adult subjects (five men and two women) 55 years of age (standard deviation [SD] = 12), with a diabetes duration of 42 years (SD = 6; range, 15–60), hemoglobin A1c of 7.2% (SD = 0.8), total daily insulin dose of 0.50 U/kg (SD = 0.14; range, 0.28–0.73), and body mass index of 26.3 kg/m2 (SD = 3.6; range, 21.5–30.6) were studied on two occasions, each lasting 18 h on consecutive days. During each occasion, subjects were admitted to a clinical research center on the afternoon of the first study day. At 6 p.m. on the day of admission, subjects consumed either an HF (60 g) or LF (10 g) dinner meal with identical carbohydrate (96.7 g [SD = 19.1]) and were monitored until noon on the following day. Breakfast (102.8 g [SD = 16.3] of carbohydrate), served at 8 a.m., was identical in all respects on both days. Beginning at 6 p.m. and ending at 12 p.m. (noon) the subsequent day, each subject's insulin requirement was obtained via a closed-loop artificial pancreas algorithm 12 together with blood samples obtained approximately every 15 min during meals and approximately every 60 min during the night. Blood samples were assessed for plasma glucose using a YSI 2300 glucose analyzer (YSI Life Sciences, Yellow Springs, OH) and for plasma insulin using a chemiluminescent immunoassay (Beckman Coulter, Fullerton, CA). During the night, supplementary meals consisting of juices with carbohydrate content between 7 g and 15 g were given to subjects with glucose levels nearing 70 mg/dL to avoid the risk of hypoglycemia (glucose <60 mg/dL).
Metabolic model parameter estimation
Using the data (carbohydrate [in g], insulin delivery rate [in U/h], plasma insulin concentration [in μU/mL], and plasma glucose concentration [in mg/dL]), we estimated the parameters of previously validated metabolic models that represent the τ m, 7 insulin clearance (C INS) and delays associated with insulin appearance in plasma following subcutaneous delivery (τ 1 and τ 2) and its subsequent effect (1/p 2) to increase glucose uptake in cells, 8 S I of the cells, net hepatic glucose balance at zero insulin and zero glucose (NHGB 0), the GEZI, and the ratio of the glucose distribution volume to the bioavailability of meal carbohydrate (V G /A G). 9 We provide the model equations in the Appendix.
As in previous studies assessing time-varying metabolic parameters, 13 we defined discrete time intervals in which we assumed the metabolic model parameters to be approximately constant: dinner interval (6 p.m.–11 p.m.), early nighttime interval with a transition time (T N) (11 p.m.–T N), late night/early morning (T N–8 a.m.), and breakfast (8 a.m.–12 p.m.). We incorporated a 20-min transition phase to allow a piecewise smooth transition in parameter values from one interval to the next and identified T N separately for each subject. We estimated the pharmacodynamic model parameters S I, GEZI, and NHGB 0 separately in each interval, allowing the values to differ between HF and LF meal glucose profiles. We estimated τm separately for the LF dinner, HF dinner, breakfast, and all supplementary meals. Pharmacokinetic model parameters describing insulin transport within the body (subcutaneous depot [C INS and τ 1], plasma [τ 2], and remote interstitial fluid surrounding insulin-sensitive tissue [p 2]) and V G /A G were assumed to be the same in each interval and to be unaffected by meal fat content. We assessed the quality of the estimated parameters by computing the fractional SD (FSD) of each parameter (details are provided in the Appendix).
We report plasma glucose and insulin concentrations and the associated model fits as mean and standard error (SE). Goodness of fit (R 2; coefficient of determination) 14 are reported as median and range. We report the estimated parameters as the mean and SE values and assess parameter differences during and following closed-loop LF and HF dinners using two-sided paired Wilcoxon signed-rank tests, 14 with P < 0.05 considered significant. We performed parameter identification, model simulations, and statistical comparisons using MATLAB version 7.14 software (The Mathworks Inc., Natick, MA).
Results
Plasma glucose (Fig. 1a) and insulin (Fig. 1b) were well fit by the model for both the LF dinner (median R 2 of 0.88 [range, 0.40–0.94] and 0.91 [range, 0.81–0.97] for plasma insulin and glucose, respectively) and the HF dinner (0.74 [range, 0.31–0.96] and 0.90 [range, 0.71–0.94] for plasma insulin and glucose, respectively).
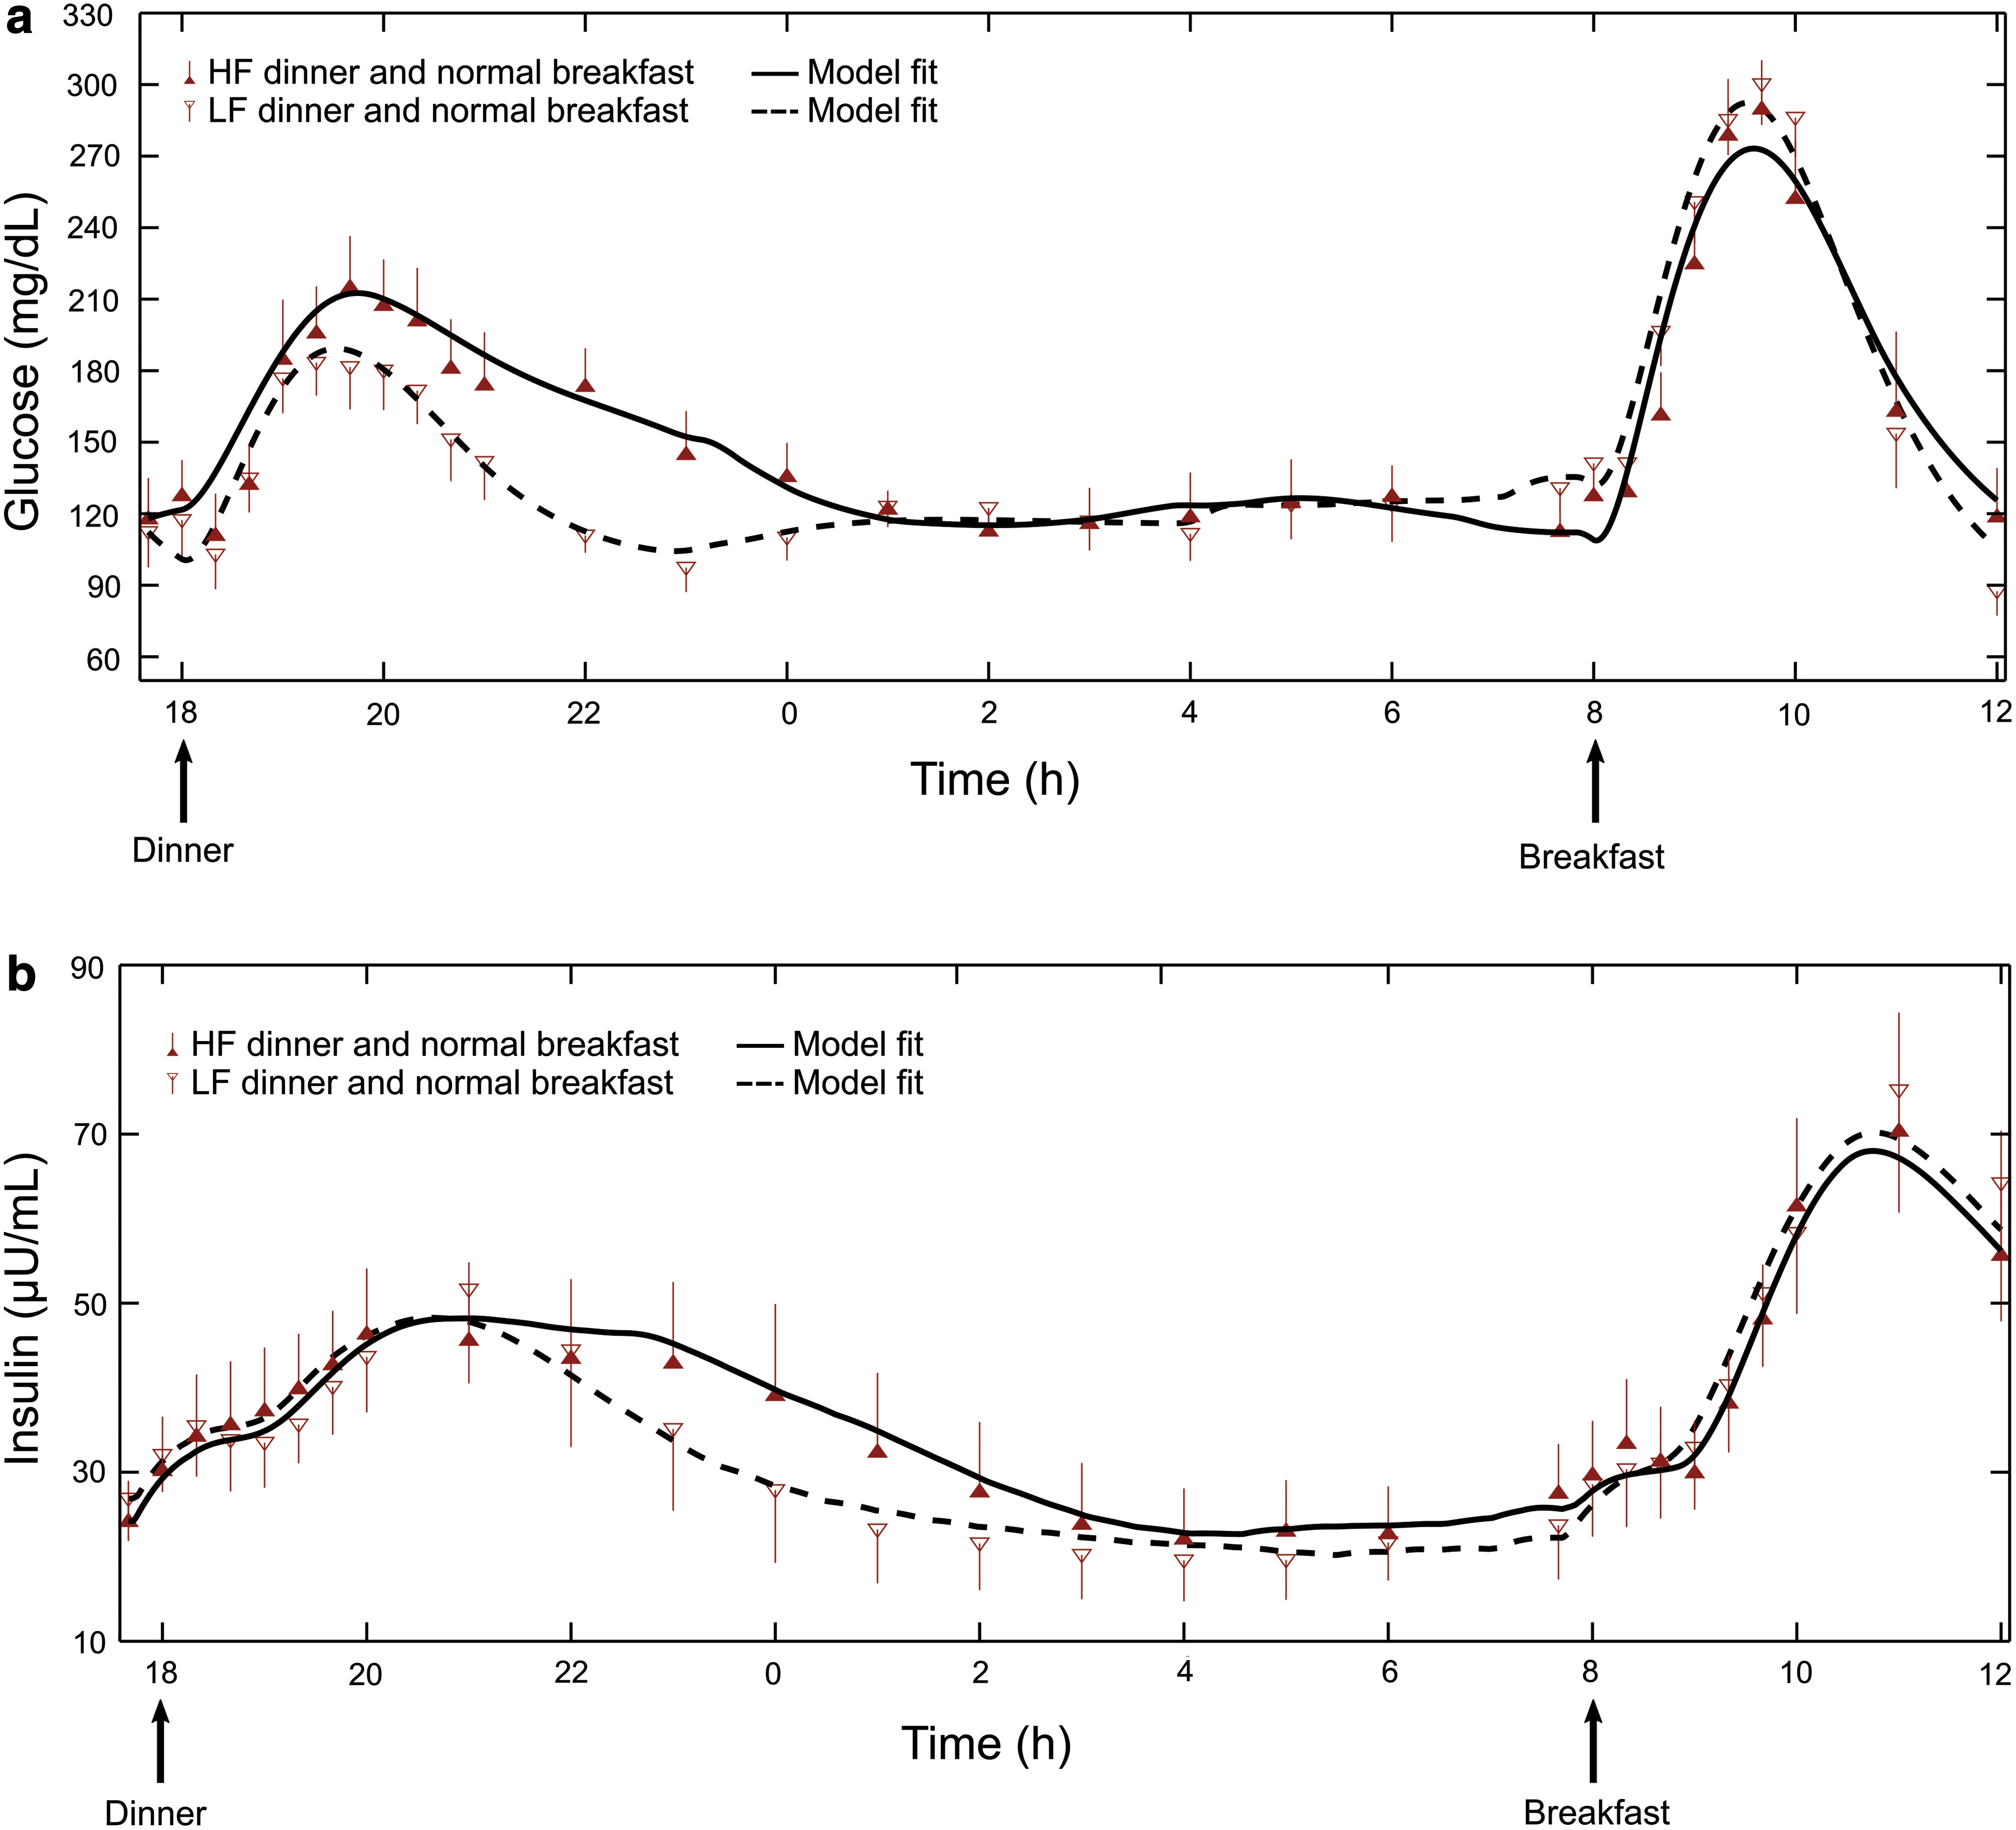
Plasma
Model parameters for all subjects were generally well estimated (e.g., median FSD for S
I = 17% [range, 11–37%] except for subject 4, whose FSD was 92% for the HF meal). Supplementary Tables S1–S4 (Supplementary Data are available online at
Average S I (Table 1) was significantly lower during the HF versus LF dinner (7.25 × 10⁻⁴ mL/μU/min [SE = 1.29 × 10⁻⁴] vs. 8.72 × 10⁻⁴ mL/μU/min [SE = 1.08 × 10⁻⁴]; P = 0.02), and average τ m was significantly delayed (102 min [SE = 14] vs. 71 min [SE = 4]; P = 0.02). We did not observe any statistically significant differences in NHGB 0 or GEZI during the LF and HF meals or during the two nighttime intervals (11 p.m.–approximately 4:34 a.m. and approximately 4:34 a.m.–8 a.m.) (Table 1). Parameters assumed not to be affected by dinner fat content or to vary during the day (C INS, V G /A G, τ 1, τ 2, and p 2) were estimated to be 894 mL/min (SE = 150), 133 dL (SE = 19), 176 min (SE = 44), 51 min (SE = 12), and 0.016 min−1 (SE = 0.005), respectively. We noted that the parameter values for the LF meal condition were statistically similar to the parameter values reported by Kanderian et al. 13
Values in parentheses are SEs.
Indicates statistically significant differences between low-fat (LF) and high-fat (HF) values (P < 0.05).
τ m, time of peak meal-glucose appearance; GEZI, glucose effect at zero insulin; NHGB 0, net hepatic glucose balance at zero insulin and zero glucose; S I, insulin sensitivity; T N, transition time.
Discussion
Adjusting insulin doses for meal fat content remains controversial, with patients typically being advised that fat only affects the rate of gastric emptying and that they should consider using an extended or dual-wave bolus. 3 However, several studies have emerged challenging this belief. 5 Model analysis confirmed the well-established belief that HF meals are associated with delayed gastric emptying (here estimated to be approximately 30 min) but also pointed to a significant decrease in S I (here approximately 17%), and a possible decrease in GEZI later in the night, albeit this effect did not achieve statistical significance (P = 0.06).
Although the 17% decrease in S I identified here for the HF meal was statistically significant, it was not sufficient to explain the approximately 42% increase in the insulin requirement observed in the original study. 6 The observed decrease in S I is consistent with clamp studies showing that when levels of free fatty acids are prevented from falling by a concomitant infusion of intralipid heparin, S I is lower. 15 –17 However, in those studies the decrease was largely attributed to a decrease in insulin's ability to suppress endogenous glucose production.
In the present study, we did not observe differences in NHGB 0 (the hepatic glucose balance that would be expected at zero insulin), but this does not preclude the possibility that insulin's ability to alter the balance was impaired in the HF meal. Our analysis does not allow the time course of insulin's effect to alter NHGB 0 to be separated from the time course of its effect to increase peripheral glucose uptake, as this would require the use of glucose tracers. 18,19 It is also possible that the decrease in GEZI, observed later in the night, contributed to the increased insulin level, although this effect did not achieve statistical significance in this study (P = 0.06) and occurred at a time when plasma insulin levels and S I were well matched. Thus, we attribute the difference between the observed increase in insulin requirement (42%) and the amount that can be explained by the decrease in S I (17%) to the mismatch between the delay in insulin effect (1/p 2) and the peak meal absorption time τ m. In the present study, 1/p 2 was 62 min, whereas τ m was 102 min for the HF meal, as opposed to 71 min for the LF meal. Such a mismatch reduces insulin's ability to increase glucose disposal, thus increasing the insulin requirement.
The present study design included only one level of meal carbohydrate content (96 g) with two levels of meal fat content (10 g vs. 60 g) and is therefore not sufficient to infer the insulin dosing for a moderate amount of fat (10–20 g) or to determine if further increases in the amount of fat would increase the insulin requirement. Although the effect of fat on insulin requirement was possibly enhanced due to the substantially increased meal-fat content in this study (60 g), other controlled studies have found this effect for meal-fat content ranging from 6.6 to 52.0 g. 5 In particular, at least one study showed that 35 g of meal-fat content increased postprandial glucose concentrations by approximately 40 mg/dL at 5 h. 20 Thus, there is an emerging body of evidence suggesting that meal-fat content alters the dose of insulin required for those meals.
However, whether the insulin dosing should be obtained via an adjustment to the carbohydrate-to-insulin ratio (consistent with fat decreasing insulin's ability to dispose of carbohydrate) or via an additional factor proportional to the grams of fat per se (consistent with carbohydrate and fat having independent effects) is unclear. Equally unclear is how to factor the effects of the amount of protein or the glycemic index of a meal into the insulin dosing calculation. Nonetheless, our results showing a metabolic model to be capable of fitting observed glucose profiles for a specific meal, be it LF or HF (Fig. 1), suggests that model analysis could potentially be used to calculate the optimal insulin dosing and delivery pattern (dose amount and duration) for any meal.
The metabolic model used in the present study was composed entirely of submodels developed and validated by other investigators for reasons unrelated to the characterization of meal responses in subjects with type 1 diabetes. The pharmacokinetic/pharmacodynamic models are identical to those proposed by Sherwin et al. 8 in 1974. Model components describing the effects of insulin and glucose at zero insulin to increase glucose uptake and decrease endogenous glucose production are derived from the minimal model equations of Bergman et al. 9 and the model describing the rate of meal glucose appearance follows from work by Wilinska et al. 7 The combined model (Appendix, Eqs. 1 –5) has been used to characterize interday variability in metabolic parameters in adult subjects with type 1 diabetes studied under closed-loop control, 12 with the results subsequently used to predict closed-loop study results obtained in an independent population of pediatric subjects. 21 We note here that Eq. 3 of the combined model that describes the insulin effect on glucose was the same in the model reported by Sherwin et al. 8 and the minimal model of Bergman et al. 9
Independently, Schiavon et al. 22 have recently shown that the minimal model subcomponent can be used to derive an index of S I using only CGM data and subcutaneous insulin delivery and that this estimate is well correlated with the traditional oral minimal model estimate of S I. This suggests that plasma insulin concentration data per se are not needed when identifying the model. However, without these data S I can only be identified in combination with C INS (see Appendix). Having at least some insulin data also improves the precision (FSD) of the estimated parameters, which, while being generally acceptable (FSD <37% in 13 of the 14 estimates of S I obtained in this study), was higher than desired in some cases (e.g., Supplementary Table S1, 92% in subject 4 for HF meal). Furthermore, although the models used in the present analysis are well established, with reports on their use dating back more than 40 years, 8 the ability to fit or characterize a specific meal at a specific point in time, as previously shown 13 and reconfirmed here (Fig. 1), or to predict average results that could be obtained in a population of subjects not used to derive the model 21 does not imply that the model will be able to predict the response to a different meal consumed on the same day or the same meal consumed on a different day by a subject. Factors affecting inter- and intraday changes in metabolic parameters remain unknown.
In summary, the results of the present study suggest that previously validated models can be combined to describe complex meal response profiles. The ability to model these responses may ultimately serve to improve existing open-loop bolus estimators and possibly optimize a closed-loop, artificial pancreas system. The analysis presented in this study adds to the findings reported in the original study, 6 showing that HF meals require more insulin than LF meals with identical carbohydrate content. Specifically, parameters identified here indicate that increased insulin requirement was due to both delayed gastric emptying and an effect of fat to decrease S I. We suggest that clinicians and dieticians reviewing patient records consider the fat content of meals with unexpectedly high glucose levels when considering the insulin requirements for those meals.
Footnotes
Acknowledgments
The study was supported by U.S. Department of Defense grant W81XWH-11-1-0421 to G.M.S. and by the Military Operational Medicine Research Area Directorate of the U.S. Army Medical Research and Materiel Command, Fort Detrick, MD, to S.L. and J.R.
Author Disclosure Statement
No competing financial interests exist.
Appendix
References
Supplementary Material
Please find the following supplemental material available below.
For Open Access articles published under a Creative Commons License, all supplemental material carries the same license as the article it is associated with.
For non-Open Access articles published, all supplemental material carries a non-exclusive license, and permission requests for re-use of supplemental material or any part of supplemental material shall be sent directly to the copyright owner as specified in the copyright notice associated with the article.