
Abstract
Background:
ASPIRE In-Home randomized 247 subjects with type 1 diabetes to sensor-augmented pump therapy with or without the Threshold Suspend (TS) feature, which interrupts insulin delivery at a preset sensor glucose value. We studied the effects of TS on nocturnal hypoglycemia (NH) in relation to baseline hemoglobin A1c (A1C) and change in A1C during the study.
Materials and Methods:
NH event rates and mean area under curve (AUC) of NH events were evaluated at different levels of baseline A1C (<7%, 7–8%, and >8%) and at different levels of changes in A1C (less than −0.3% [decreased], −0.3% to 0.3% [stable], and >0.3% [increased]), in the TS Group compared with the Control Group (sensor-augmented pump only).
Results:
In the TS Group, 27.9% of the NH events were accompanied by a confirmatory blood glucose value, compared with 39.3% in the Control Group. Among subjects with baseline A1C levels of <7% or 7–8%, those in the TS Group had significantly lower NH event rates than those in the Control Group (P=0.001 and P=0.004, respectively). Among subjects with decreased or stable A1C levels, those in the TS Group had significantly lower NH event rates, and the events had lower AUCs (P≤0.001 for each). Among subjects with increased A1C levels, those in the TS Group had NH events with significantly lower AUCs (P<0.001).
Conclusions:
Use of the TS feature was associated with decreases in the rate and severity (as measured by AUC) of NH events in many subjects, including those with low baseline A1C levels and those whose A1C values decreased during the study period. Use of the TS feature can help protect against hypoglycemia in those wishing to intensify diabetes management to achieve target glucose levels.
Introduction
N
One strategy to mitigate hypoglycemia in users of sensor-augmented pump therapy is to stop insulin delivery at a predetermined sensor glucose (SG) level; the strategy is implemented as Threshold Suspend (TS) in the United States as part of the 530G system and as Low Glucose Suspend elsewhere as part of the Veo™ system (both from Medtronic plc, Northridge, CA). The strategy has been shown to reduce the duration and severity of hypoglycemic events without compromising glycemic control in an inpatient setting of exercise-induced hypoglycemia, 7 in several outpatient studies, 8 –11 and in a retrospective analysis of anonymized data uploaded by patients as part of their routine care. 12 Even in the context of elevated blood glucose levels at the time of suspension, 2-h pump suspensions appear safe and do not lead to clinically significant ketonemia. 13
We wished to establish the extent of NH reduction associated with use of the TS feature in subjects who were stratified according to baseline hemoglobin A1c (A1C) and changes in A1C (ΔA1C) during the ASPIRE (Automation to Simulate Pancreatic Insulin REsponse) In-Home study. 8 A preliminary report of these results was presented in part at the 74th Scientific Sessions of the American Diabetes Association, held June 13–17, 2014. 14
Research Design and Methods
The ASPIRE In-Home study was a multicenter, randomized, parallel study of NH-prone subjects with type 1 diabetes. 15 The Control Group used sensor-augmented pump therapy, whereas the TS Group used sensor-augmented pump therapy with the addition of the TS feature. For the study, an episode of NH was defined as a sequence of SG values ≤65 mg/dL lasting >20 min and starting between 10:00 p.m. and 8:00 a.m. To qualify for the study, volunteers had to have demonstrated at least two episodes of NH in a 2-week run-in phase. The 3-month randomized study phase was designed to provide data for between-group comparisons with respect to ΔA1C and the mean area under the curve (AUC) of NH events. The main results of ASPIRE In-Home included a 37.5% reduction in the mean AUC of NH events and a 31.8% reduction in the weekly rate of NH events for subjects in the TS Group compared with the Control Group, with no apparent loss in overall glycemic control determined by ΔA1C. 8
In this secondary analysis of ASPIRE In-Home data, NH events were analyzed according to each subject's baseline A1C value (<7%, 7–8%, and >8%) and to each subject's ΔA1C value (less than −0.3% [decreased], −0.3% to 0.3% [stable], and >0.3% [increased]). Only data from the 240 subjects who provided both baseline and end-of-study A1C values were used; data from the seven subjects who withdrew early (five from the TS Group and two from the Control Group) were not used.
Statistical analysis
Secondary outcomes based on NH events were compared between groups, categorized by baseline A1C and ΔA1C. Event-based variables such as NH event AUC, AUC per night, nadir SG value, and duration were compared using a mixed effects model with random intercept to incorporate within-subject correlations among events. For subject-based variables, such as weekly event rate, mean SG values, mean SD values, and mean coefficients of variation (defined as the SD divided by the mean of a set of values) of SG values, the subject means on each variable were first calculated for each subject, and then a two-sample t test was performed on the subject means data. Analyses were conducted with SAS software (version 9.3; SAS Institute, Cary, NC). All reported P values are two-sided; P<0.05 was considered to indicate statistical significance for comparisons between groups.
Results
Of the 2,025 NH events in the TS Group, 564 (27.9%) were accompanied by a confirmatory blood glucose value, and of the 3,002 NH events in the Control Group, 1,179 (39.3%) were accompanied by a confirmatory blood glucose value. In addition, the NH events were verified for 41.1% (232 of 564) in the TS Group and 48.6% (573 of 1,179) in the Control Group.
Effects of TS in relation to baseline A1C
Table 1 shows that there was a significant inverse relationship between baseline A1C and NH rates in both the TS Group (P=0.005) and the Control Group (P<0.001), with the highest rate among subjects assigned to the Control Group who had baseline A1C values of <7% (2.7 per subject-week) and the lowest rate among subjects assigned to the TS Group who had baseline A1C values of >8% (1.1 per subject-week). The rate was significantly lower in the TS Group than in the Control Group for subjects with baseline A1C values of <7% (P=0.001) or 7–8% (P=0.004). The differences in rate were consistent throughout the study, as shown in Supplementary Figure S1 (Supplementary Data are available online at
Data are mean±SD values.
A1C, hemoglobin A1c; AUC, area under the curve; CV, coefficient of variation; N, number of subjects; n, number of events; NH, nocturnal hypoglycemia; SG, sensor glucose; TS, Threshold Suspend.
Effects of TS in relation to ΔA1C
Table 2 shows that the between-group differences for AUC were statistically significant in all of the ΔA1C categories (P<0.001 for each). The percentage difference was largest for subjects with A1C values that increased over the course of the study, in which the mean AUC was 46.3% lower for subjects in the TS Group compared with subjects in the Control Group. The between-group differences in NH rate were significant for subjects with A1C values that decreased or were stable over the course of the study; for those with a decrease in A1C, the mean rate was 37.5% lower for subjects in the TS Group compared with subjects in the Control Group (1.5 vs. 2.4 events per subject-week, respectively; P<0.001). In the Control Group, subjects with stable A1C values experienced NH events at a rate that was lower than Control Group subjects with decreased A1C values and higher than Control Group subjects with increased A1C values. In the TS Group, the NH rate averaged 1.5 per subject-week, regardless of ΔA1C category. The mean NH event duration was significantly shorter for subjects in the TS Group than for subjects in the Control Group, regardless of ΔA1C category (P<0.001 for each between-group comparison), as was the nadir SG. Among subjects with decreased or stable A1C values, glycemic variability (measured as coefficient of variation) was significantly lower among subjects in the TS Group than among subjects in the Control Group, although mean SG and SD were not different.
Data are mean±SD values.
ΔA1C, changes in hemoglobin A1c; AUC, area under the curve; CV, coefficient of variation; N, number of subjects; n, number of events; NH, nocturnal hypoglycemia; SG, sensor glucose; TS, Threshold Suspend.
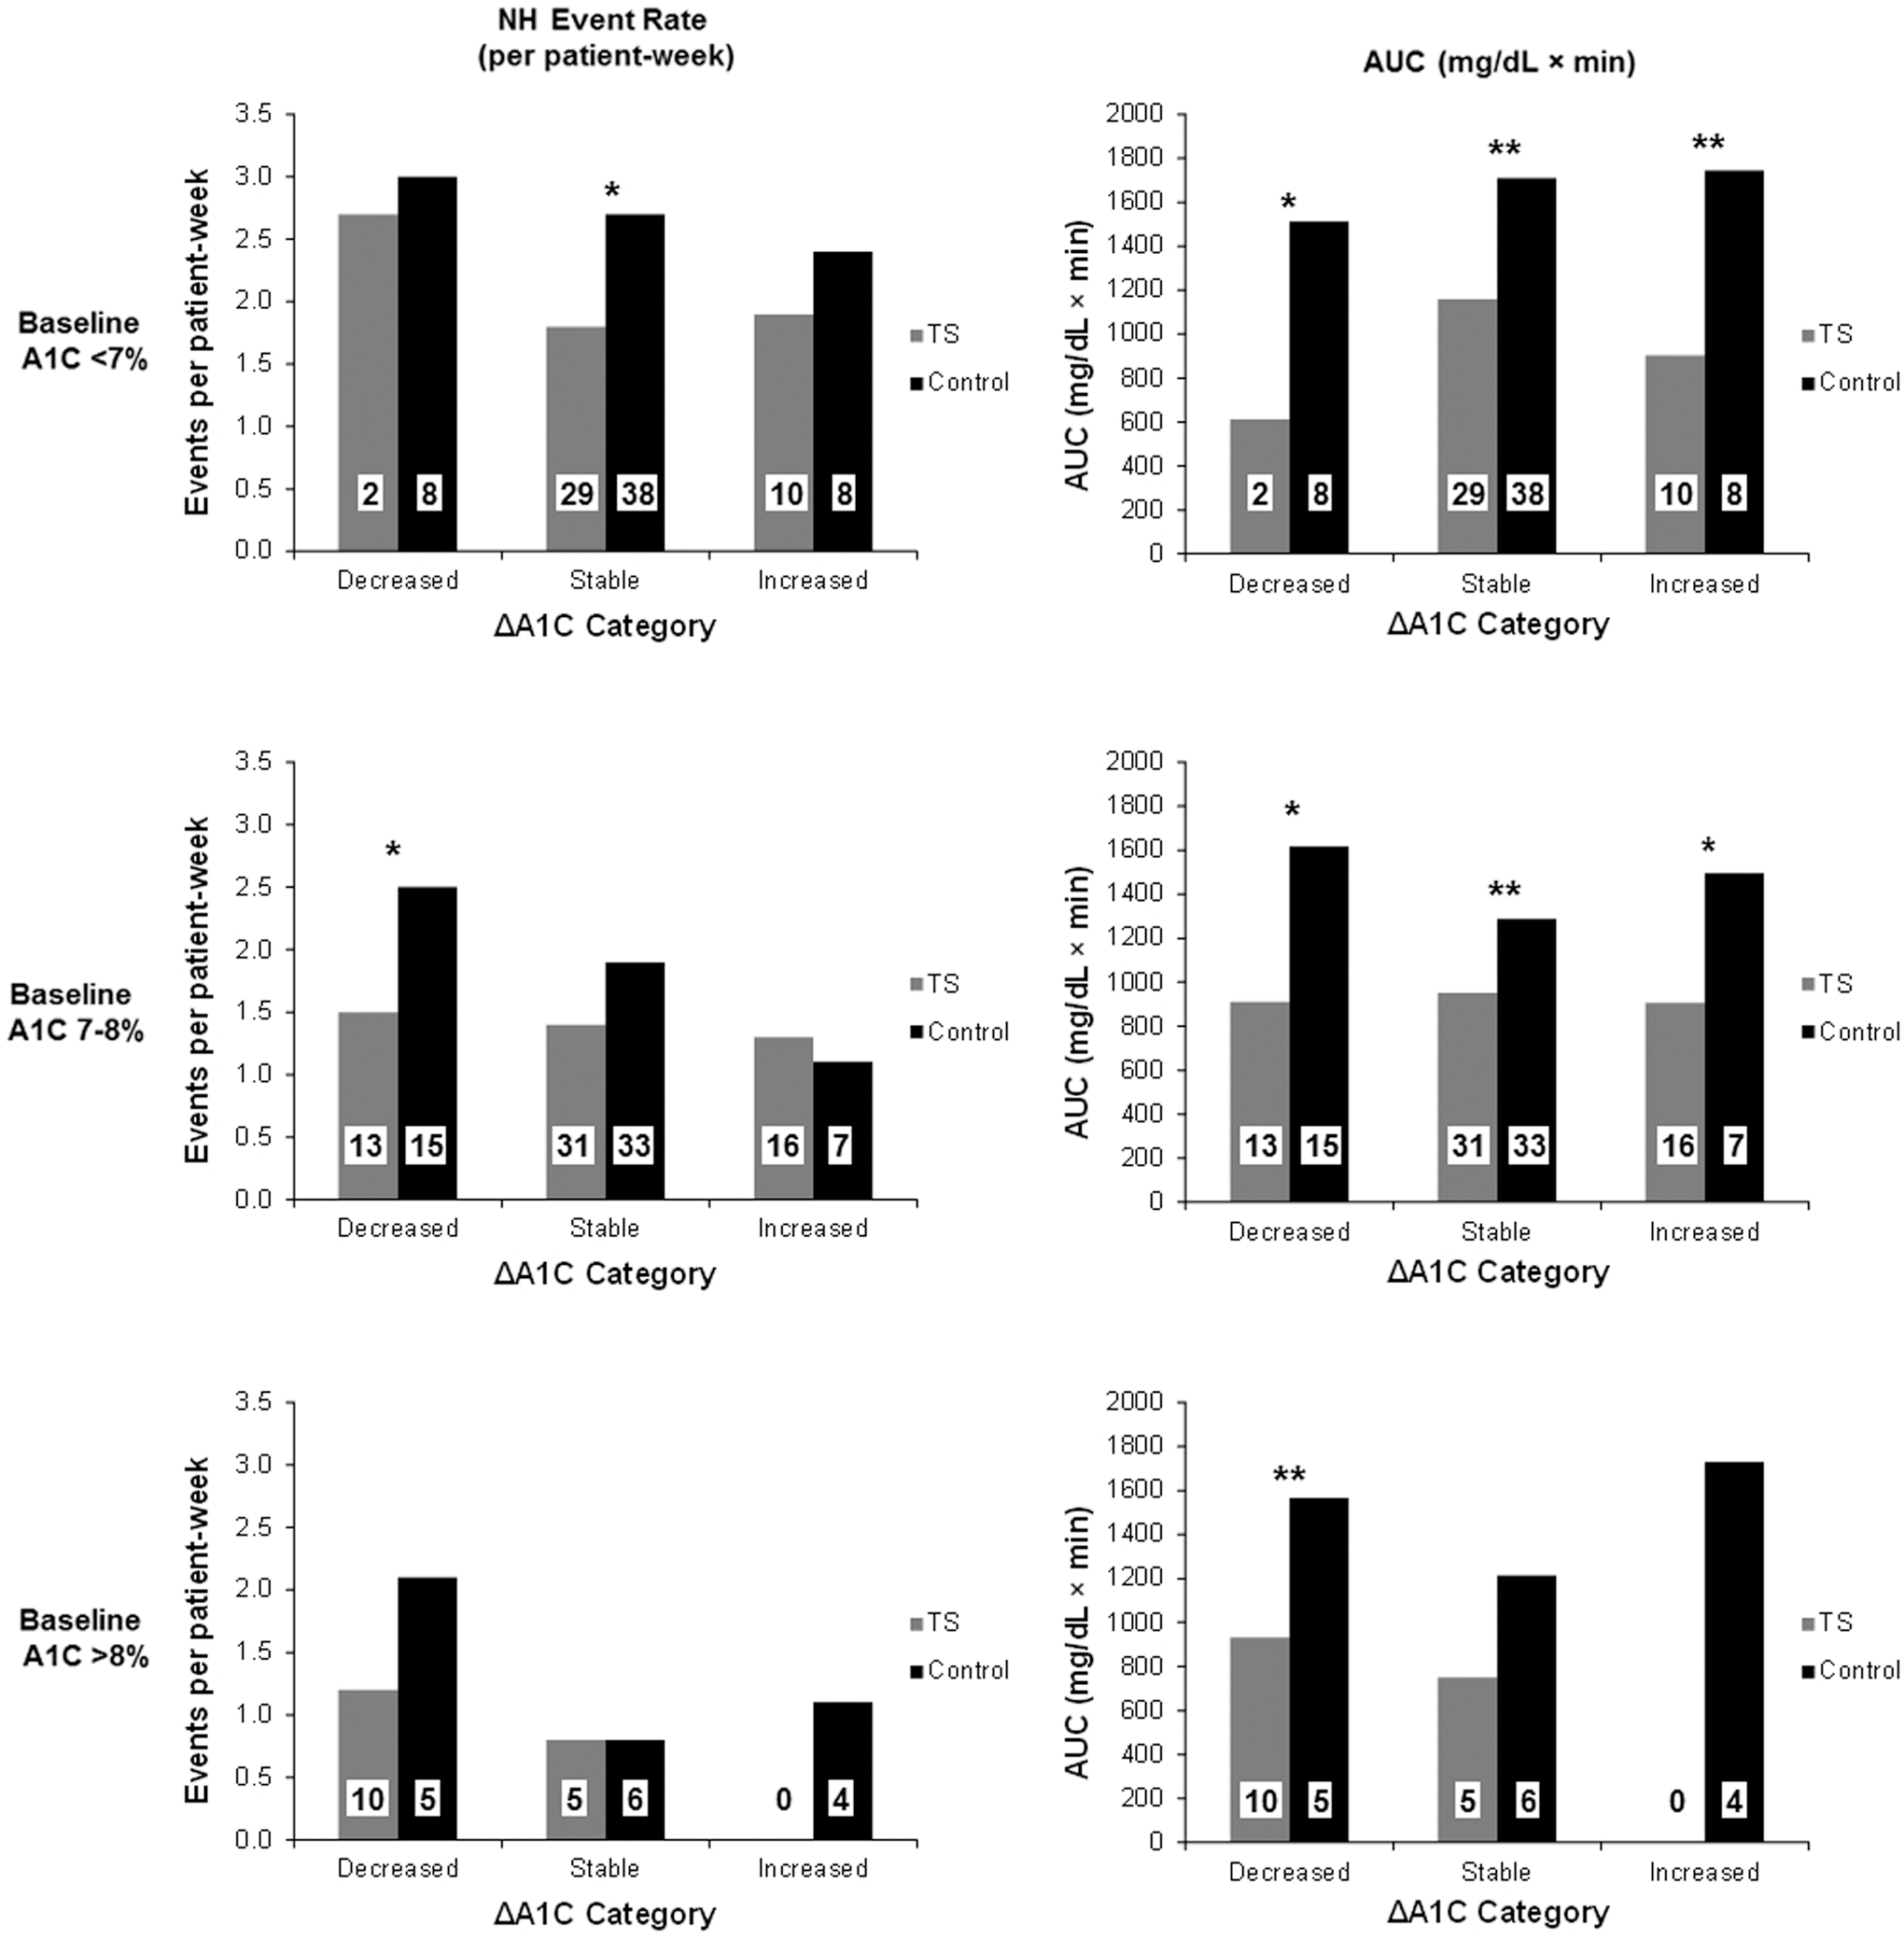
Effects of TS in relation to both baseline A1c and ΔA1C
Figure 1 shows NH event rates and AUCs among subjects stratified by both baseline and ΔA1C values. Reductions in NH event rate attributable to TS Group assignment were seen for subjects with baseline A1C of <7% who maintained stable A1C values and for subjects with baseline A1C of 7–8% whose A1C values decreased during the study. For subjects with baseline A1C of <7% or with baseline A1C of 7–8%, significant reductions in the AUC of NH events were seen among subjects assigned to the TS Group, regardless of ΔA1C category.
Discussion
The TS feature was designed to reduce the severity and duration of hypoglycemia by suspending insulin delivery upon detection of a predefined low SG value. In the ASPIRE In-Home study, the initial threshold for suspension of insulin was set to 70 mg/dL, and this value was maintained for 97.6% of the subject-hours of the study. Evidence from earlier observational 7,9,10 and randomized controlled 8,11 studies suggested that the TS feature significantly reduces the rate and severity of hypoglycemia as measured by SG values.
The Control Group appears to have a higher patient reaction rate to NH events. It is likely that the event rate in the TS Group was inflated more than in the Control Group, yet it was observed that the event rate in the TS Group was lower than that in the Control Group.
NH remains a critical barrier that limits treatment intensification in type 1 diabetes mellitus. 16 Many patients with type 1 diabetes mellitus experience NH frequently, with many events lasting longer than 120 min. 17 The ASPIRE In-Home Study showed that use of the TS feature reduced the mean and median duration of NH events by 39.4 and 11.9 min, respectively, 8 to values that are less than the reported time typically associated with the development of seizures. 5 These effects were mostly independent of the degree of metabolic control such as baseline A1C or ΔA1C from study beginning to end. In addition, no subjects in the TS Group had severe hypoglycemia, whereas four subjects in the Control Group had severe hypoglycemia during the 3-month study time period. 8
The effect of the regular use of the TS feature in subjects who lowered their A1C values during the course of the study is of interest, given the association between lower A1C values and higher rates of hypoglycemia. 18 Sensor-augmented pumps have been shown to allow A1C reduction without a significant effect on hypoglycemia rates. 19 Despite the fact that the aim of the ASPIRE In-Home study was to test safety and not to reduce A1C, there was a subgroup of patients who did, and many patients with initially low A1C values (<7%) were able to sustain this value throughout the study. Subjects who maintain or achieve excellent glycemic control can benefit through routine use of the TS feature.
The study had several limitations. First, SG values were used for all analyses without validation by a reference method. Second, because blood glucose values were not obtained during many of the NH events and because the timing and extent of carbohydrate intake were often not recorded, our ability to determine sensor accuracy around the time of NH events is limited. However, sensor accuracy is unlikely to depend on treatment group assignment and unlikely to have biased our conclusions. Third, the generalizability of the study results may be limited because only hypoglycemia-prone subjects were enrolled. The results may not be generalizable to sensors with different performance characteristics, and the reported rates of hypoglycemia are likely to be inflated (in both groups). Finally, the 3-month duration of the study may have been insufficient to demonstrate long-term benefits of the TS feature.
This analysis demonstrates the protective effects of the TS feature above and beyond NH prevention. NH occurred at lower rates among subjects in the TS Group throughout the study. When NH events did occur in the TS Group, they tended to be shorter and characterized by higher nadir SG values than events in the Control Group. Additional strategies will probably be needed to reduce the severity and rate of NH even further. This modality is the first automated insulin delivery module in practice and may pave the way for the ultimate goal—the closed-loop artificial pancreas. 20
The current analysis of ASPIRE In-Home data showed that overall rates, durations, and severities of NH events were lower among subjects who regularly used the TS feature than among those who did not. The benefits were mostly independent of baseline A1C levels and ΔA1C levels. In addition, this analysis showed that for those with an baseline A1C level of <7% who maintained glucose control and for those with a baseline A1C level of 7–8% who reduced their A1C during the 3-month study period, the TS feature allowed improving metabolic control safely by reducing rates of NH and AUC of hypoglycemic events.
Footnotes
Acknowledgments
The ASPIRE In-Home Study was funded by Medtronic, plc.
Author Disclosure Statement
R.W. is a consultant for Medtronic. J.B.W., K.A.S., and J.J.S. are employees of Medtronic, plc. Atlanta Diabetes Associates, the employer of B.W.B., has received research support from Medtronic. T.S.B. and A.J.A. have received research support from Medtronic, plc. S.K.G. has received speaking/advisory board consulting fees from Eisai, Medtronic, Novo Nordisk, Roche, the Jaeb Center, the National Institute of Diabetes and Digestive and Kidney Diseases, the JDRF, and Sanofi and research grants from Eli Lilly, Halozyme, Novo Nordisk, Merck, MannKind, Medtronic, the T1D Exchange, the National Institute of Diabetes and Digestive and Kidney Diseases, the JDRF, and Sanofi.
References
Supplementary Material
Please find the following supplemental material available below.
For Open Access articles published under a Creative Commons License, all supplemental material carries the same license as the article it is associated with.
For non-Open Access articles published, all supplemental material carries a non-exclusive license, and permission requests for re-use of supplemental material or any part of supplemental material shall be sent directly to the copyright owner as specified in the copyright notice associated with the article.