
Abstract
Background:
This study applied a pharmacodynamic model-based approach to evaluate the long-term durability and glycemic control of pioglitazone in comparison with other oral glucose-lowering drugs in Japanese type 2 diabetes mellitus (T2DM) patients.
Subjects and Methods:
Japanese T2DM patients were enrolled in a prospective, randomized, open-label, blinded-end point study and received pioglitazone with or without other oral glucose-lowering drugs (excluding another thiazolidinedione [TZD]) (n=293) or oral glucose-lowering drugs excluding TZD (n=294). Treatment was adjusted to achieve glycosylated hemoglobin (HbA1c) <6.9%, and samples for fasting plasma glucose (FPG) and HbA1c were collected over 2.5–4 years. A simultaneous cascading indirect response model structure was applied to describe the time course of FPG and HbA1c. HbA1c levels were described using both an FPG-dependent and an FPG-independent function. To account for titration, drug effects for both treatment groups were implemented using a time-dependent E max model.
Results:
Pioglitazone was superior in both time to maximum effect and the magnitude of reduction achieved in FPG and HbA1c. A greater reduction in median FPG (–21 mg/dL vs. −9 mg/dL) was observed with pioglitazone (P<0.05). Maximum drug effect for FPG was predicted to occur earlier (11 months) for pioglitazone than for the control group (14 months). The simulated additional reduction in FPG and HbA1c achieved with pioglitazone was predicted to be maintained beyond the currently observed study duration.
Conclusions:
Pioglitazone was found to result in improved glycemic control and durability compared with control treatment. This model-based approach enabled the quantification of differences in FPG and HbA1c for both treatment groups and simulation to evaluate longer-term durability on FPG and HbA1c.
Introduction
T
Current guidelines in Japan recommend achieving a target glycosylated hemoglobin (HbA1c) level of <7.0% to inhibit the progress of and prevent the onset of macrovascular disease. 6 There are seven groups of oral agents currently used in Japan: sulfonylurea drugs, fast-acting insulin secretion stimulators (glinides), biguanides, thiazolidines (TZD), α-glucosidase inhibitors, dipeptidyl peptidase-4 inhibitors, and sodium glucose cotransporter-2 inhibitors. 7 However, there are differences in the usage patterns compared with North America and Europe. 1 Furthermore, the underling pathology of T2DM was found to be different between Japanese and white subjects. 8,9 In comparison with whites, Japanese are unable to compensate for insulin resistance with increased insulin secretion to the same extent. A recent study identified body composition as the major determinant for these pathophysiological differences between Japanese and white T2DM subjects. 9 As a result of differences in the approach to therapeutic intervention and in the pathophysiological features of diabetes, treatment guidelines in Japan differ from those in Western countries. 7
T2DM is a slowly progressing disease, and glycemic deterioration is predominantly due to insulin resistance and β-cell failure. 10 Currently there are no available therapies that can completely stop the progressive loss of glycemic control, although different therapies can delay the extent of this loss by different degrees. 11 To evaluate this further, determination of a coefficient of failure (which is the slope obtained by performing regression analysis) was proposed as an approach to assess β-cell failure from any index of glycemia. 12 Further extension of this approach can be undertaken using pharmacokinetic–pharmacodynamic models developed to characterize the time course of drug effects. The advantage of implementing a model-based approach is the key characterization of the relationship between treatment and the physiology of the disease over time. 13 Traditional approaches such as last-observation-carried-forward result in a collapse in the time dimension of the data and therefore disregard the actual trajectory of change in disease status over time. 14 As a result of this, crucial information on disease progression over time is ignored, and short-term hypoglycemic effects of a treatment are combined with its longer-term effects on the disease.
In contrast, however, a model-based approach is applied to describe and explain changes in disease status as a function of time and drug therapy. In white T2DM patients these approaches have been widely applied to discriminate between standard of care and new therapies, assessing alternative treatment strategies and by using meta-analysis to evaluate the current competitive landscape for antidiabetes therapy. 15 –18 Furthermore, the regulatory authorities advocate the application of these model-based approaches with a particular focus on understanding exposure–response relationships. 19,20
Until now, no model-based approach in Japanese T2DM patients has been undertaken on mid- to long-term data. Therefore this analysis represents, to our knowledge, the first model-based approach to evaluate the drug-specific effects in Japanese T2DM patients for pioglitazone in combination with other oral glucose-lowering drugs compared with oral glucose-lowering drugs alone simultaneously on fasting plasma glucose (FPG) and HbA1c. The aim of this analysis is to further enhance our understanding of the treatment and time course effects on FPG and HbA1c, and the development of a model will enable the simulation for both groups to compare the longer-term glycemic durability.
Subjects and Methods
Subjects and data collection
The data used in this analysis are from a multicenter, prospective, randomized, open-label, blinded-end point study that was designed to assess the glycemic effects of pioglitazone and their impact on cardiovascular outcomes in Japanese patients with T2DM over a period of 2.5–4 years. Patients received pioglitazone and other oral glucose-lowering drugs (excluding another TZD) (n=293) or oral glucose-lowering drugs excluding TZD (n=294). Treatment was adjusted to achieve an HbA1c level of <6.9%. The primary results of this study including the safety and tolerability information have already been described in detail elsewhere. 21,22
Population data analysis
During the study HbA1c data were collected every 12 weeks, and FPG data were collected every 24 weeks. The baseline characteristics are described in Table 1. The changes in FPG and HbA1c levels over time were described using a simultaneous, cascading indirect response model structure, similar to the approach previously described in white patients. 14,23 HbA1c (%) data were collected using the Japanese Diabetes Society values and then converted to the National Glycohemoglobin Standardization Program values. 24 Treatment was adjusted to achieve an HbA1c level of <6.9% (National Glycohemoglobin Standardization Program), which is equivalent to an HbA1c level of <6.5% using Japanese Diabetes Society values.
Data are median (range).
BMI, body mass index; HbA1c, glycosylated hemoglobin; TZD, thiazolidinedione.
Disease progression submodel for FPG and HbA1c
The model was parameterized in terms of a zero-order production rate for FPG (K inG) and a first-order rate constant for the removal of FPG (K outG). Changes in HbA1c were initially modeled as secondary changes dependent on FPG, with a first-order rate constant (K inH) for production and a first-order HbA1c degradation rate constant, K outH, for disappearance. The description of HbA1c production also included the use of a power function on FPGγ. 15,25 Disease progression for FPG was implemented as a proportional increase in the FPG level with a slope (FPGDP), relative to the baseline at study start. Several different models for disease progression were explored, including exponential and log-linear; however, these were not found to be superior.
The overall model structure is described in Eqs. 1
–3:
During model development, it was noted that the changes in HbA1c over time could not be fully described by the changes observed in FPG alone. Furthermore, there were differences observed in the rate of change over time between FPG and HbA1c following graphical inspection of the data. This is consistent with previous reports and is likely to result from the co-contribution and input of nonfasting glucose because HbA1c is a measure of average glucose composed of both fasting and postprandial hyperglycemia.
26,27
A separate FPG-independent effect to describe the source of changes in HbA1c was therefore included and resulted in significantly improved model diagnostics and fit. This FPG-independent input was described using a zero-order rate constant (K
inZ) and a linear time-dependent parameter (DPind) included in the following equation:
Drug effect model
The drug effect (DEF) on FPG was incorporated using an E
max model driven by time, where E
max is the maximal effect of overall exposure to FPG-lowering drugs. ET
50 is the time required for titration to half of the maximal exposure. For both treatment groups DEF was implemented as a stimulatory effect on K
outG. The E
max model approach was applied to account for the titration of antidiabetes medication in the early phase of the study. This information could not be directly included in the analysis at the individual patient level because of the way in which time was recorded in the case report form for the titration schemes. To account for titration-related dose changes in both patient populations, the drug effect was described with the following approach:
ET 50 in the pioglitazone group was estimated with a value close to 0 and with low precision. This is likely to result from the maximum effect of titration being achieved for drugs in the pioglitazone group by the time of first FPG sample collection at 3 months. As a result, this parameter was fixed to 0 for all remaining model development without any loss in goodness-of-fit.
Subjects who entered the trial were already receiving antidiabetes medication, the details of which are shown in Table 1. However, the assumption was used that these subjects were indeed at steady state on their baseline medication when they entered the trial. Further refinements to the model to account for this additional background therapy at the individual patient level did not result in any improvements in model diagnostics.
Data analysis
All analyses were performed using the nonlinear mixed-effects modeling approach in NONMEM (version 7, release 1; Icon Development Solutions, Ellicott City, MD). The first-order conditional estimation method with interaction (ADVAN6, TOL=5) was used. Statistical analysis was performed in S-Plus (version 8.1 Professional; TIBCO Software Inc., Palo Alto, CA). Simulations of FPG and HbA1c were performed in Berkeley Madonna version 8.3.13 software (Macey and Oster, University of California, Berkeley, CA).
Inter-individual variability and residual error
Inter-individual variability (IIV) on FPG baseline and E max was explored assuming a log-normal distribution of the individual parameter estimates. However, IIV on the baseline for HbA1c was evaluated using a Box–Cox transformation model to account for skewness observed in the individual data, likely resulting from inclusion criteria based on an HbA1c level of >6.9%. 25,28 IIV on FPGDP was described by an additive random effect. Residual variability was included using a proportional model and the correlation between IIV on baselines was included using the OMEGA BLOCK option.
Covariate analysis
Potential covariates at baseline included age, sex, weight, body mass index, number of non-TZD medications, type of non-TZD medication, and baseline FPG and HbA1c. These were evaluated in the model using a forward inclusion and backward elimination procedure. 29 Before the covariate analysis was performed, the most appropriate distribution of the covariates was evaluated.
Model qualification
The visual predictive check was used to evaluate the ability of the final model to predict both the central tendency and the variability of FPG and HbA1c (median and 90th prediction interval). 30 The stability of the model was tested by using 100 bootstrap replicates of the original dataset. To further inform model validation shrinkage for the random effects was monitored. 31
Model selection
No further improvement in the model was considered by a decrease in objective function of less than 10.8 (P≤0.001) for each additional degree of freedom (=extra parameter). In addition, graphical analysis enabled assessment of bias, and the biological plausibility of the parameter estimates was evaluated.
Evaluation of the treatment effects on glycemic markers
Based on observed data, the percentage of subjects achieving an HbA1c level of <7.0% and the mean HbA1c values at 2.5 years (the minimum study duration for all subjects) were estimated and compared for both treatment groups.
Observed change from baseline in homeostasis model assessment for insulin resistance (HOMA-IR) was calculated, and a two-sample t test was used to compare the mean values of change from baseline in HOMA-IR at each visit between treatment groups. To further explore the predictability of the model, change from baseline in HOMA-IR was recalculated using the model-predicted FPG values.
To explore the influence of drug effects on the time course for pioglitazone and the control group, the median FPG and HbA1c time profiles were simulated.
Results
The results presented here were based on the simultaneous analysis of FPG and HbA1c data in 587 T2DM subjects with median treatment duration of 3.14 years (maximum, 3.9 years). Results of the visual predictive check are shown in Figure 1 and indicate adequate precision and accuracy of the model. The results for the model parameters are specified in Table 2 along with their bootstrap estimate. All model parameters could be obtained with adequate precision, and all parameters fall within the 95% confidence intervals. Estimated shrinkage for all random effect parameters was low (<21%). Additional diagnostics are provided in Supplementary Figures S1–S6 (Supplementary Data are available online at
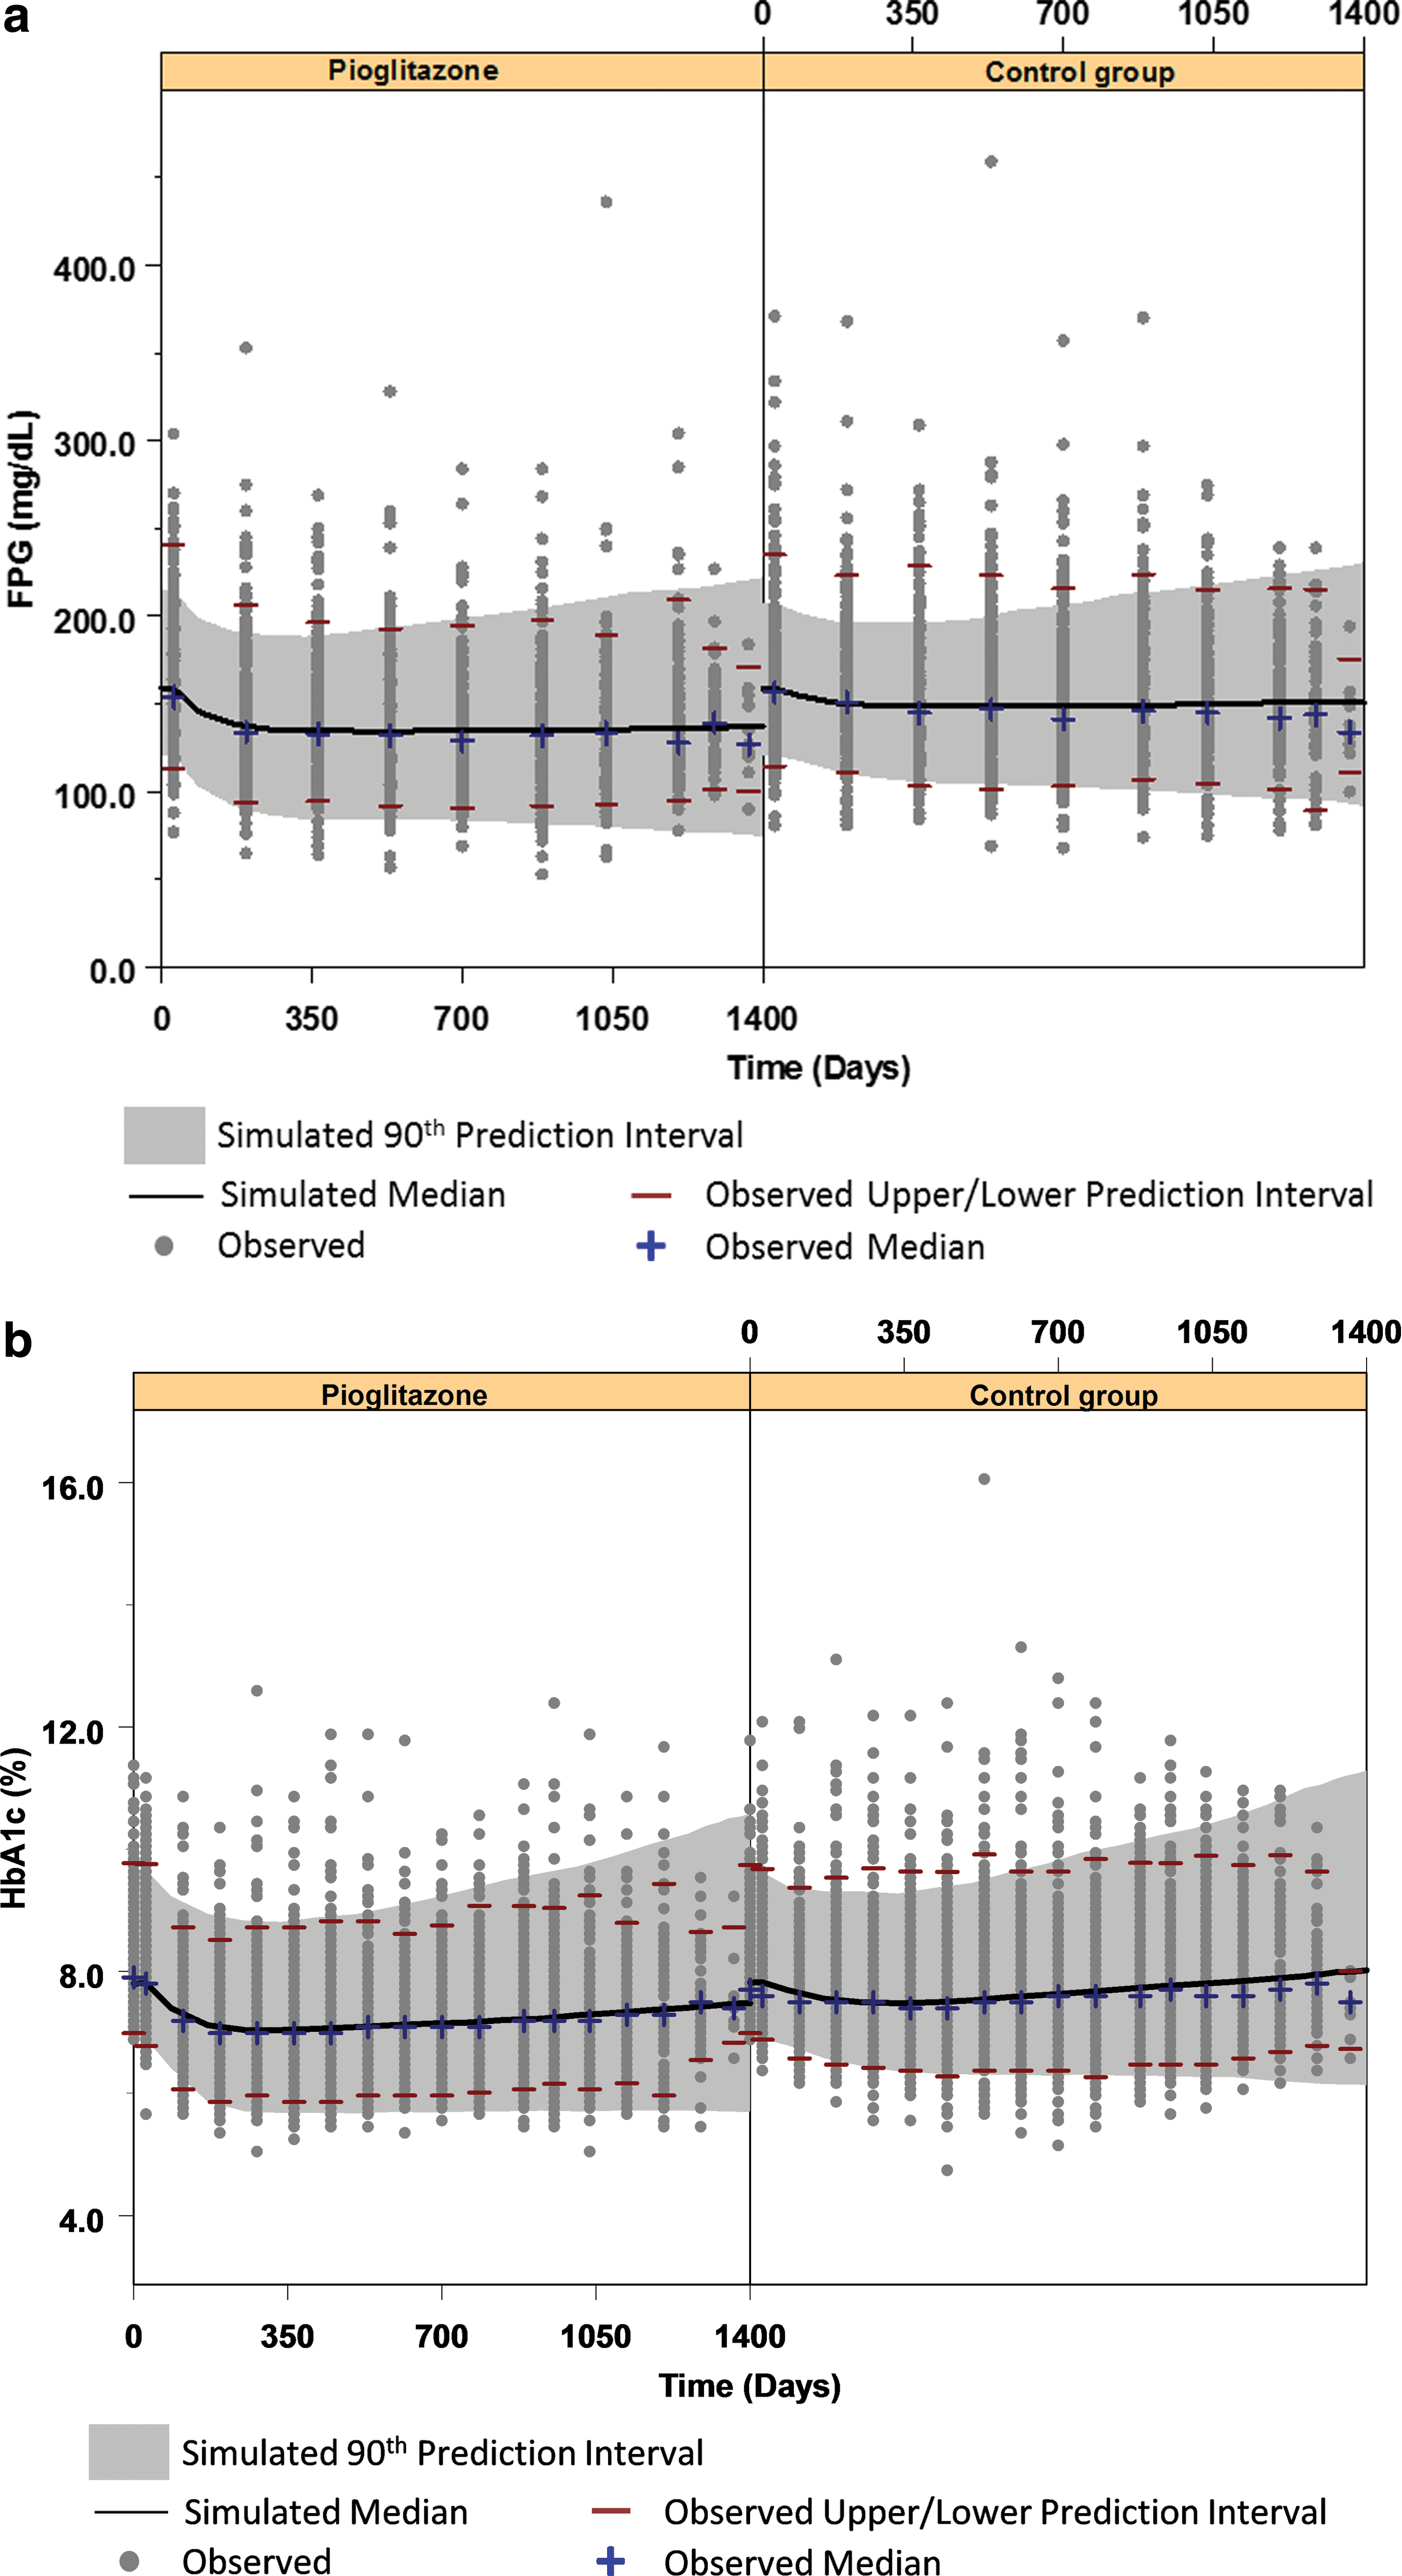
Visual predictive check for observed and predicted
During conduct of the bootstrap, 97.0% of runs minimized successfully.
BSL FPG, baseline for fasting plasma glucose; BSL HbA1c, baseline for glycosylated hemoglobin; CI, confidence interval; CV, coefficient of variation; E max, maximal effect of overall exposure to FPG-lowering drugs; ET 50, the time required for titration to half of the maximal exposure; FPG, fasting plasma glucose; HbA1c, glycosylated hemoglobin; K outG, first-order rate for fasting plasma glucose; K outH, first-order rate constant for glycosylated hemoglobin; FPGDP, disease progression rate for fasting plasma glucose; DPind, disease progression rate for fasting plasma glucose-independent input; K inZT, zero-order rate constant for fasting plasma glucose-independent input; ω2, interindividual variability.
During the study period (2.5–4 years), 90 subjects (9% pioglitazone, 6% control group) discontinued before 2.5 years. This was based on several criteria, including adverse event, voluntary withdrawal, or major protocol deviation. Patient discontinuation may possibly influence model parameters when caused by selective dropout of certain subpopulations of patients. This may be due to lack of efficacy, occurrence of side effects, and/or compliance. To exclude this, models were run using all the data and excluding the dropout subjects. All model parameters were compared by including and excluding these discontinued subjects. Only a slight difference was observed in the FPG disease progression rate parameter (FPGDP) of 0.017 year−1 (with all subjects) and 0.016 year−1 (excluding discontinued subjects). This result showed only a very minor influence of these subjects was observed on the FPG profile, and because of the low observed dropout in the study, further model development including dropout was not performed.
Drug effect model
Differences in the effect due to maximum drug exposure (E max) on FPG were observed between the two treatment groups. The model-derived E max values for pioglitazone and the control group were 17% and 8%, respectively, resulting in an approximately twofold greater reduction in FPG for pioglitazone compared with the control treatment (median maximum simulated change from baseline in FPG was −21 mg/dL compared with −9 mg/dL for pioglitazone and the control group, respectively; P<0.05). An ET 50 value of 49 days for the control group indicated that half the maximum exposure level of drugs affecting FPG was achieved in approximately 2 months. However, for the pioglitazone group, ET 50 was fixed at 0, indicating that apparent steady state for the titration of treatment for FPG occurs earlier than the control group. Based on simulation, the resulting maximum drug effect for FPG was achieved at approximately 14 and 11 months for the control and pioglitazone groups, respectively.
Disease progression was parameterized as a proportional increase over time relative to the FPG baseline. The model-predicted increases over time were estimated at approximately 2 mg/dL (95% confidence interval, 0.9–3.5)/per year for FPG and 0.2% (95% confidence interval, 0.15–0.25)/per year for HbA1c (Fig. 2a and b). A second contribution to HbA1c production was described using an additional FPG-independent input (DPind); this FPG-independent input was estimated to contribute an additional 0.03% to the increase in HbA1c per year. Simulated FPG and HbA1c median values over time for pioglitazone are shown simultaneously in Figure 2c. As shown in the simulation the additional FPG-independent input to HbA1c results in differences in the rate of change over time between FPG and HbA1c.
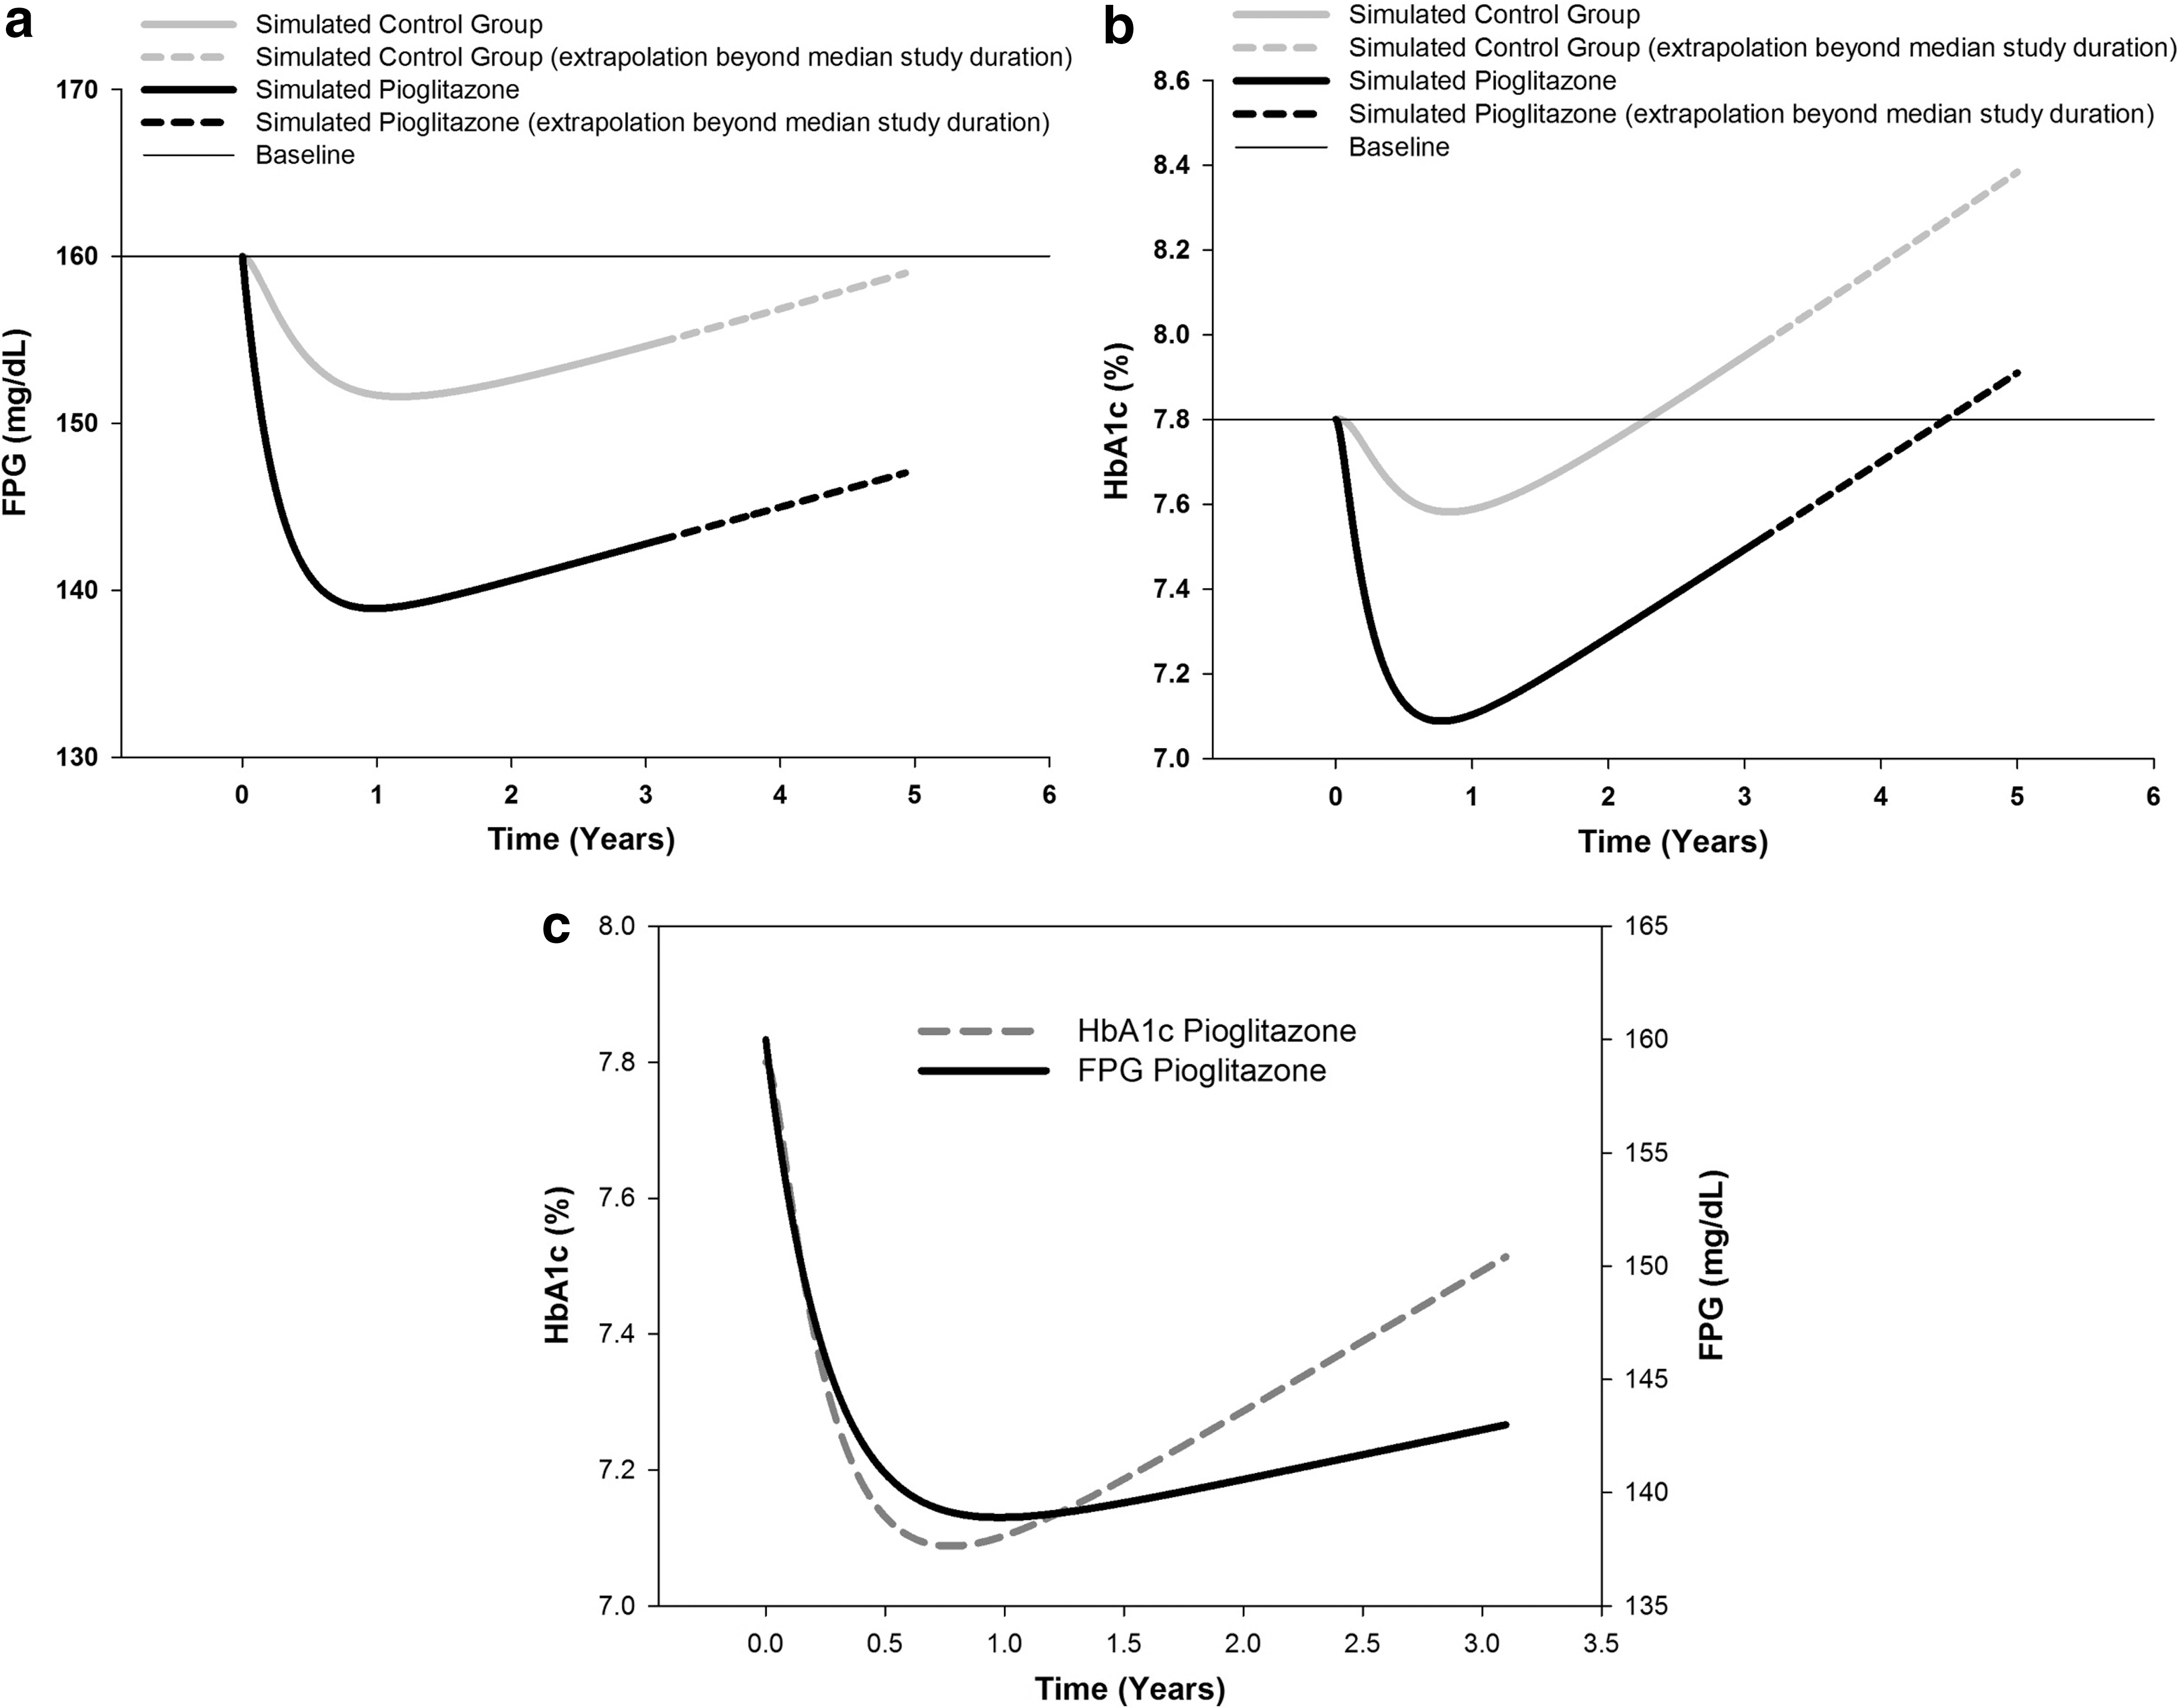
Simulated
No differences in the apparent disease progression rates (FPGDP or DPind) between treatments could be identified from the model-predicted post hoc parameters.
Evaluation of the treatment effects on glycemic markers
Model-based simulation results
Glycemic durability was evaluated using the model-optimized parameters to simulate the median FPG and HbA1c time profiles over a 5-year period (Fig. 2a and b). Median FPG in the control group was predicted to almost return to baseline levels (160 mg/dL) 5 years after starting treatment; however, at 5 years in the pioglitazone group predicted FPG levels were still considerably lower (147 mg/dL) (Fig. 2a). The duration of time required for median HbA1c levels to return to baseline (HbA1c=7.8%) was approximately 2.1 years in the control group and approximately 4.5 years for the pioglitazone group, for the typical patient in this population (Fig. 2b). The differences between pioglitazone and the control group in simulated FPG and HbA1c median values was approximately 13 mg/dL and 0.5%, respectively, at 5 years.
Observed data analysis
At 2.5 years (the minimum study duration for all subjects), 34% of the patients in the pioglitazone group had an observed HbA1c level of <7.0%, compared with only 18% in the control group. Mean observed HbA1c values at 2.5 years were 7.3% and 7.8% (P<0.001) for the pioglitazone and control groups, respectively.
This is comparable to data observed in whites when pioglitazone was added to metformin; at 2 years 31% of patients had an HbA1c<7.0%. 32
Figure 3 shows the observed and predicted change from baseline in HOMA-IR by treatment group. A statistically significant difference (P<0.05) from the control group for pioglitazone in observed HOMA-IR was maintained from 168 days until the last visit. The observed and predicted change from baseline HOMA-IR values are compared graphically (Fig. 3). Observed and predicted values are in close agreement, confirming the good predictability of the model.
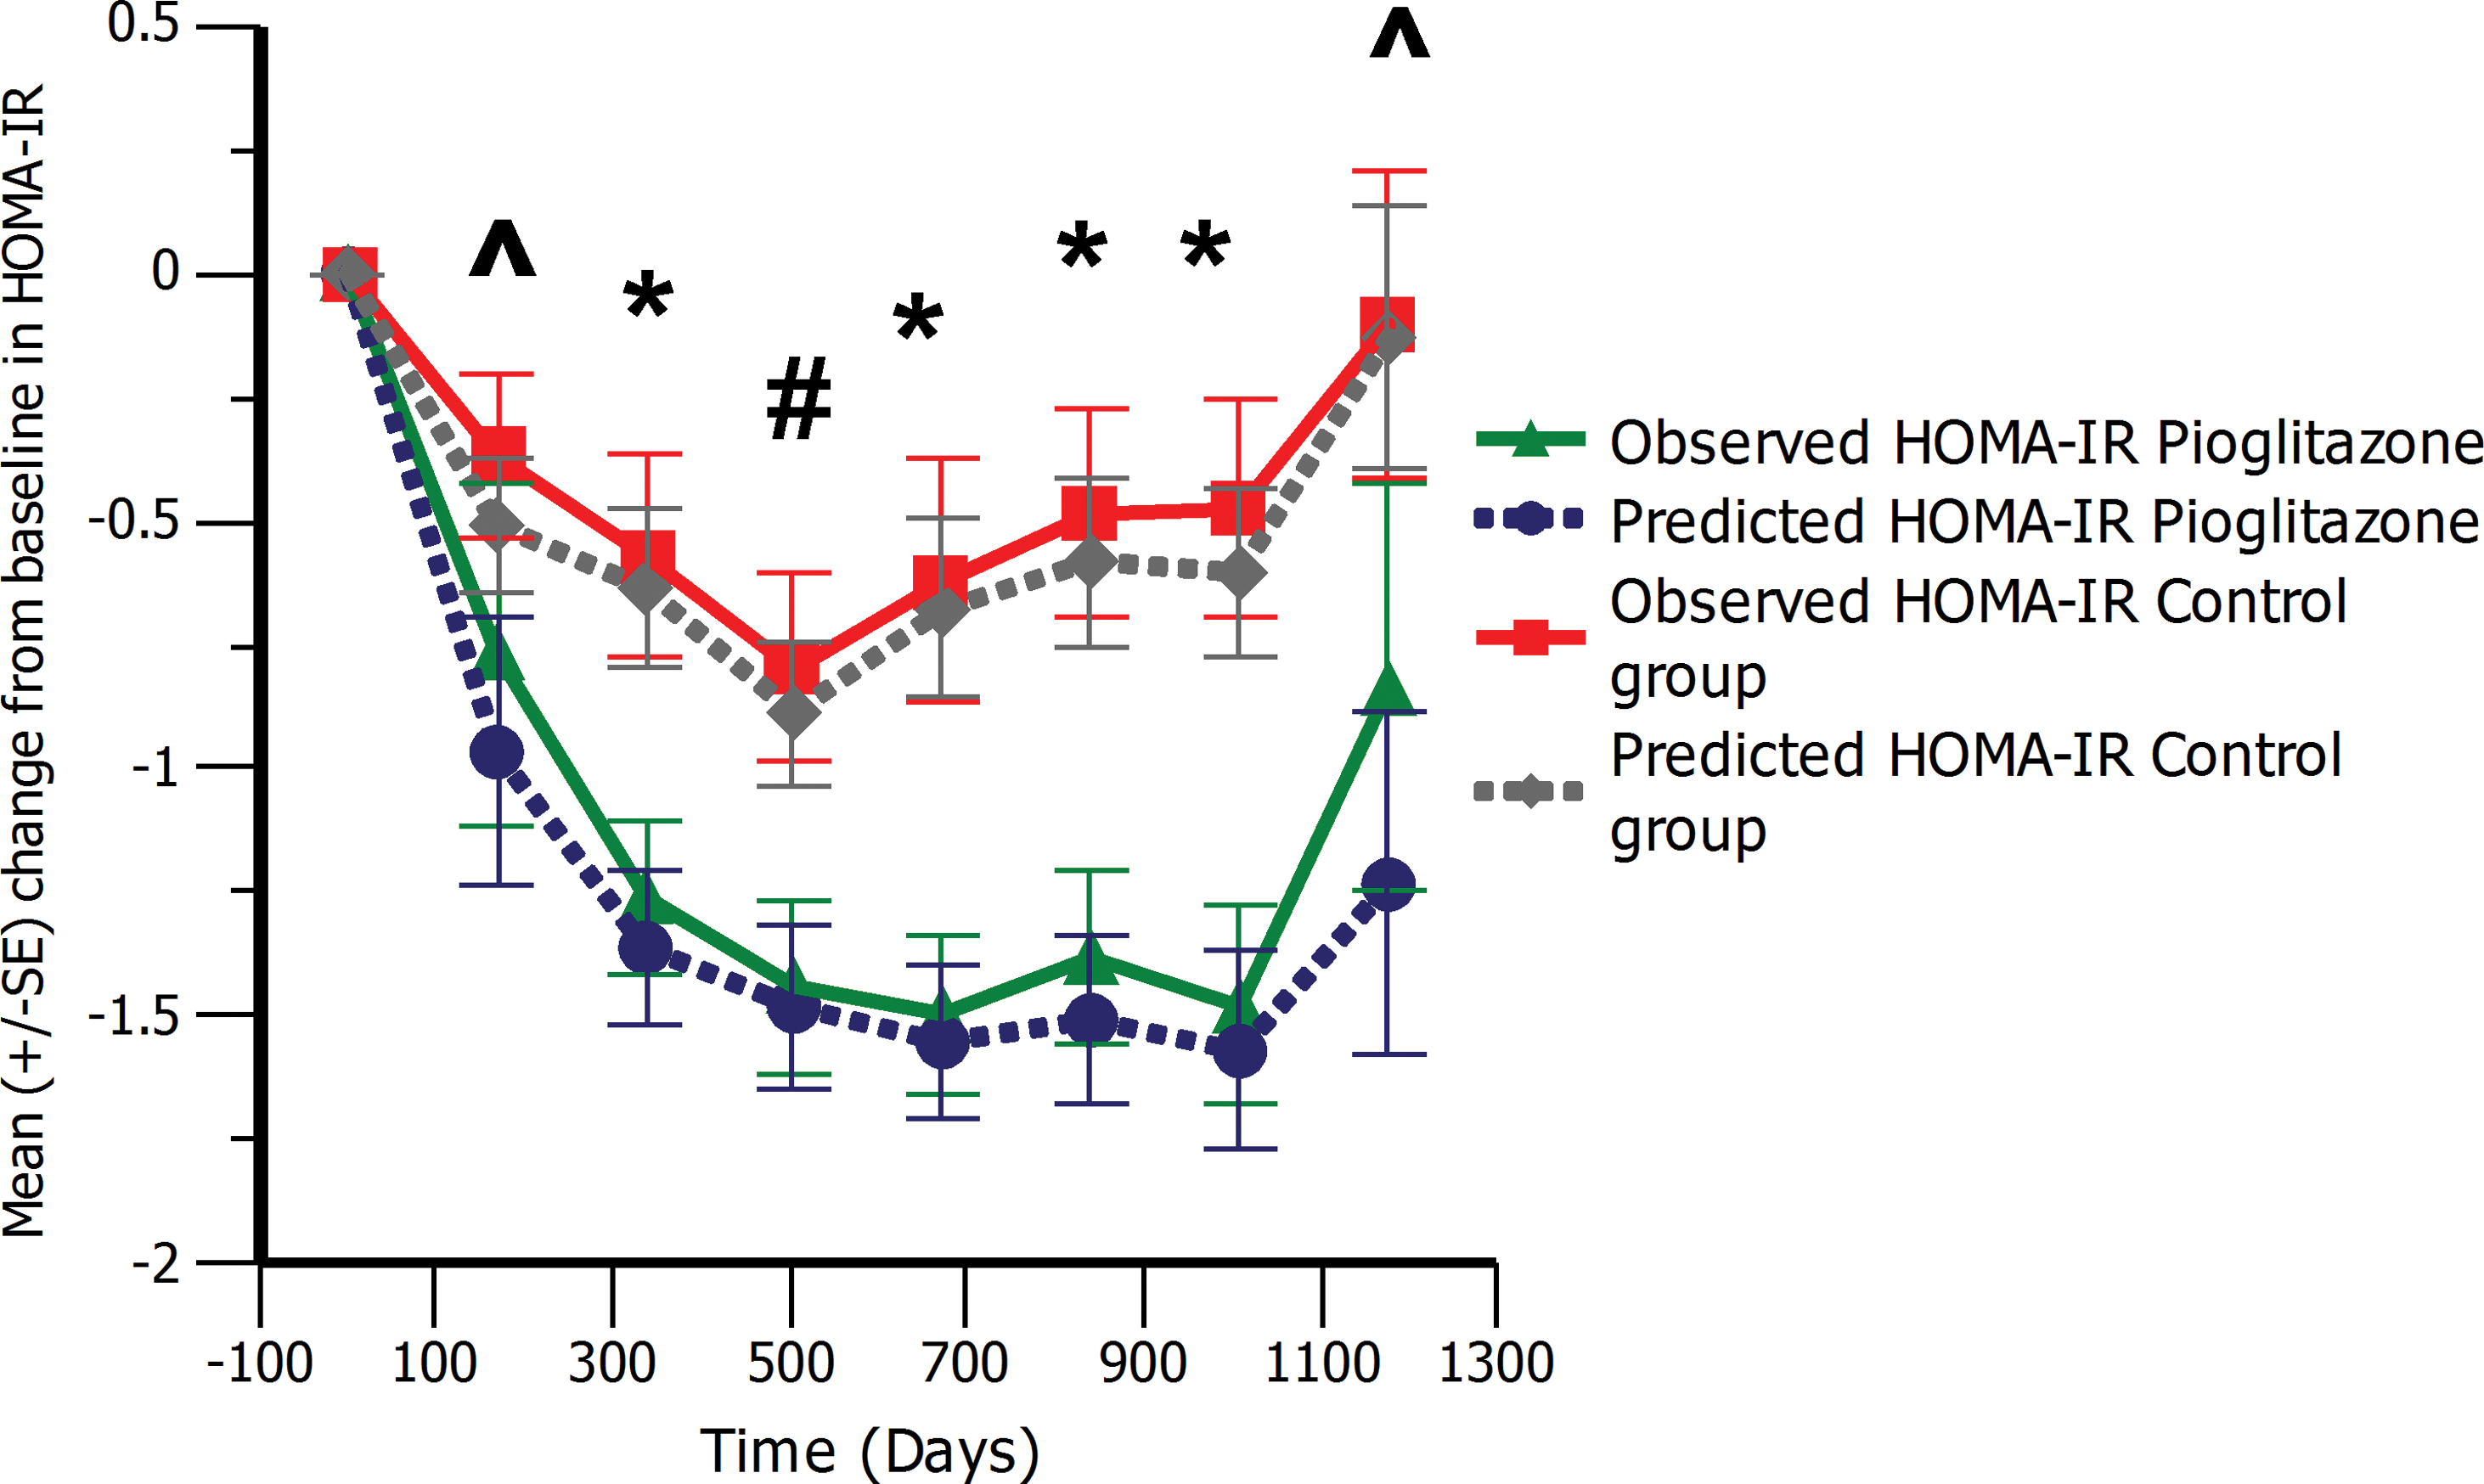
Observed and predicted change from baseline in homeostasis model of assessment for insulin resistance (HOMA-IR) over the study duration. #
P<0.05, *P<0.01. ^Difference not significant. Color graphics available at
Covariate analysis
Following the covariate analysis, only one relationship was identified as significant. Male subjects were found to have a slightly (5%) higher FPG baseline than female subjects. These differences in FPG levels by gender have been previously reported in Japanese subjects. 33
Discussion
Here we present the first application of a model-based approach to evaluate drug and disease effects in Japanese T2DM patients over a 2.5–4-year treatment period. Our analysis enabled the determination of disease progression rates in Japanese treatment-experienced T2DM patients for both FPG and HbA1c and a comparison of the drug effects between treatment groups. Stronger drug effects (twofold greater) could be identified for pioglitazone compared with the control group. Furthermore, these effects could be maintained over a longer period, indicating that pioglitazone in combination with other oral glucose-lowering drugs in Japanese T2DM patients can result in improved glycemic durability.
Greater reductions in both FPG and HbA1c data were observed in the pioglitazone group. Data in white subjects evaluating the treatment effects of pioglitazone in combination with other glucose-lowering drugs have also shown favorable glycemic results in both short- and long-term studies. 34 When comparing gliclazide or metformin alone with pioglitazone given as add-on therapy, improved and sustained glycemic control was maintained over a 2-year study period. 32 In a longer-term study, glycemic durability over 3.5 years in white subjects for pioglitazone in combination with metformin revealed significant benefits in glycemic control compared with glibenclamide. 35 Furthermore, reductions in HOMA-IR were also maintained out to 3.5 years in the same study. Indicating that pioglitazone through lowering the burden of insulin resistance could lead to increased protection of the β-cells. 35
A difference in the rate of change over time between FPG and HbA1c was identified. These differences were accounted for in the model using a separate FPG-independent and time-dependent effect on HbA1c. Studies have shown that mean plasma glucose (the arithmetic mean of FPG and postprandial glucose [PPG]) correlates better with HbA1c than FPG alone. 16,26 It is therefore hypothesized that the different rates of change observed between FPG and HbA1c are due primarily to the input related to PPG. To demonstrate the magnitude of this FPG-independent contribution, the HbA1c time profile is simulated with and without the hypothesized contribution of PPG (Fig. S7). An absolute difference of approximately 1% in HbA1c is observed between the HbA1c simulation dependent only on FPG and the simulation dependent on FPG and PPG. Recent publications have reported that PPG has an absolute contribution of approximately 1.3–1.6% to overall HbA1c levels. 36 Treatments that specifically target PPG have also shown reductions in HbA1c levels in the range of 1–1.5%. 36 Based on these studies the estimated absolute contribution of PPG to HbA1c is between 1% and 1.6%. This is consistent with our findings and therefore supports the hypothesis that PPG is the main driver for the differences we observed between the rate of change over time in FPG and HbA1c.
The model enabled the quantification and evaluation of apparent disease progression rates for FPG and HbA1c. Although no differences could be identified in the underlying disease progression rate that is estimated here in either FPG or HbA1c between groups, pioglitazone is shown to maintain glycemic control over a longer duration while reducing insulin resistance. As predicted from its mechanism of action, pioglitazone maintains a statistically significant decrease in HOMA-IR until the last visit compared with the control group (Fig. 3). A clinically meaningful difference in HbA1c level 37 between the two groups at 5 years was also predicted in the current study. The difference between pioglitazone and the control group in the simulated FPG and HbA1c median values was predicted as approximately 13 mg/dL and 0.5%, respectively, at 5 years. Apparent disease progression rates in this trial are lower than those reported in the United Kingdom Prospective Diabetes Study in white subjects determined using the coefficient of failure 12 ; however, comparison with other studies maybe confounded by baseline characteristics, the combination of different glycemic treatments and titration schemes, and ethnic background. Therefore, a model-based approach that combines glycemic data from white and Japanese T2DM patients simultaneously should be performed to elucidate any differences in disease progression rates while considering the other covariates affecting clinical response.
There are several limitations of our current model analysis. Because of study limitations no individual dose titration data could be included in the analysis, and no pharmacokinetic data were collected for any of the treatments. In addition, any long-term simulation is based only on trial data with a median duration of 3.1 years. Each of these factors contributes a certain degree of uncertainty in our extrapolations beyond the actual study duration.
Conclusions
The application of a model-based approach quantified differences in FPG and HbA1c for both treatment groups and enabled simulation to evaluate the longer-term durability on FPG and HbA1c data for both pioglitazone and the control group. Based on this result pioglitazone when given in combination with other oral glucose-lowering drugs in Japanese T2DM patients was found to result in improved glycemic control and durability compared with oral glucose-lowering treatment alone.
Footnotes
Acknowledgments
The authors would like to thank Kumi Matsuno, Hiroyuki Okamoto, and Nobuo Funao for assistance in preparing the datasets.
Author Disclosure Statement
F.S. was an employee of Takeda Pharmaceutical Company during the conduct of the analysis. K.E. and E.K. are employees of Takeda Pharmaceutical Company. J.D. and M.D. are employees of LAP&P Consultants BV and of Leiden-Academic Centre for Drug Research. K.K. has received research funding, consultancy fees, or lecture fees from AstraZeneca, Boehringer-Ingelheim, Chugai, Daiichi-Sankyo, Dainippon-Sumitomo, Kowa, MSD, Novartis, Novo Nordisk, Sanofi -Aventis, Sanwa, Taisho, Takeda, and Tanabe-Mitsubishi.
References
Supplementary Material
Please find the following supplemental material available below.
For Open Access articles published under a Creative Commons License, all supplemental material carries the same license as the article it is associated with.
For non-Open Access articles published, all supplemental material carries a non-exclusive license, and permission requests for re-use of supplemental material or any part of supplemental material shall be sent directly to the copyright owner as specified in the copyright notice associated with the article.