
Abstract
Background:
Algorithms were designed under a single model, to attain differing designated glycemic targets during intravenous insulin infusion, and evaluated in order to justify computerization of the model. The approximate maintenance rate (MR) of insulin infusion is discovered according to rate of change of blood glucose (BG) and previous insulin infusion rate (IR). During treatment, re-assignment of IR depends on MR and BG. For each MR, a roughly sigmoidal relationship between BG and IR is specified, such that the inflection point falls approximately at a true target BG.
Materials and Methods:
Performance at St. Francis Hospital, Evanston, IL, was examined during use of tabular algorithms targeting three distinct BG ranges, appropriate for the treatment of hyperglycemic hyperosmolar state, diabetic ketoacidosis, or hyperglycemia accompanying other critical illness. Group membership was defined according to algorithm used for patient treatment during the first 6 months of 2012. The group geometric mean (GGM) and multiplicative surrogate standard deviation (MSSD) are reported as group measures, respectively typifying the central tendency and variability of individual patient BG distributions.
Results:
Between first attainment of target range BG control and a data collection end point, BG data were evaluable during treatment courses for 58 patients. During this time frame, in the group treated with target 100–149 mg/dL, there were five episodes of BG <70 mg/dL for each of five patients, with the lowest being 57 mg/dL. The GGM (with multiplicative standard deviation) was 269.4 (÷/×1.06) mg/dL for the algorithm having target 200–299 mg/dL (n=3 treatment courses), 172.6 (÷/×1.15) mg/dL for target 150–199 mg/dL (n=7), and 131.3 (÷/×1.19) mg/dL for target 100–149 mg/dL (n=48). The values of MSSD for the three groups were (÷/×1.14), (÷/×1.20), and (÷/×1.20), respectively.
Conclusions:
The pilot series suggests that once target range BG is attained, maintenance of control within each of three distinct BG target ranges is achievable, according to choice of algorithm.
Introduction
P
This report addresses a basic question, important to the broad, long-term objective of developing an artificial pancreas, of whether a single mathematical design can embody a rule that safely and effectively attains different targets. This report describes an algorithm design featuring discovery of a maintenance rate (MR) of insulin infusion and assignment of an MR-dependent insulin infusion rate (IR) according to ambient BG. For each MR, the model specifies a roughly sigmoidal relationship between BG and IR, such that the inflection point falls approximately at a true target BG. In contrast to methods used by other published algorithms to attain targets and reduce risk for hypoglycemia, the sigmoidal design feature is unique.
The project proposes to evaluate the performance of intravenous insulin infusion algorithms that are in place at Saint Francis Hospital, Evanston, IL. The algorithms aim to achieve and maintain BG levels of (a) 200–299 mg/dL, (b) 150–199 mg/dL, and (c) 100–149 mg/dL, corresponding to target ranges desired for the three patient populations mentioned above. The principal hypothesis is that after first reaching its upper target BG, until a data end point, each algorithm would achieve a patient mean BG falling within the defined target range for the group.
Materials and Methods
Saint Francis Hospital is a community teaching hospital and Level 3 trauma center in Evanston, IL, having two adult ICUs, both accepting mixed medical and surgical cases. On November 6, 2011, installation and the use of the electronic medical record “went live.” As an integral part of the implementation, the programmers created electronic orders for intravenous insulin infusion algorithms, hyperlinked in the electronic medical record EPIC® (Epic Systems, Corp., Verona, WI) to printable documents, patterned after paper order sets already in use. The Hospital's Institutional Review Board approved this retrospective study.
Algorithm description
The present work aimed to evaluate the performance of the HHS, DKA, and “standard default” ICU algorithms in attaining their respective glycemic targets. The algorithms as previously published display IRs in tabular form in which columns correspond to MR values and rows correspond to BG ranges, with user discretion to modify the starting column, which otherwise is assigned by default, and with column-change rules executed by nursing staff, based on rate of change of BG and previous column assignment. 5 –7 The computerizable mathematical design (Tables 1 and 2) and the effects of translation to paper algorithms (Table 3) are shown in Figure 1. The prescriber selects the HHS or DKA algorithms from an order set for hyperglycemic crises, which states biochemical criteria suggestive of the diagnosis of the respective syndromes, adapted from published guidelines. 1,6 A modification subsequent to the published description of the standard default algorithm, potentially affecting some treatment courses during the interval of data collection, specifies column down-titration in case of BG <100 mg/dL, as shown in Tables 1 and 3.
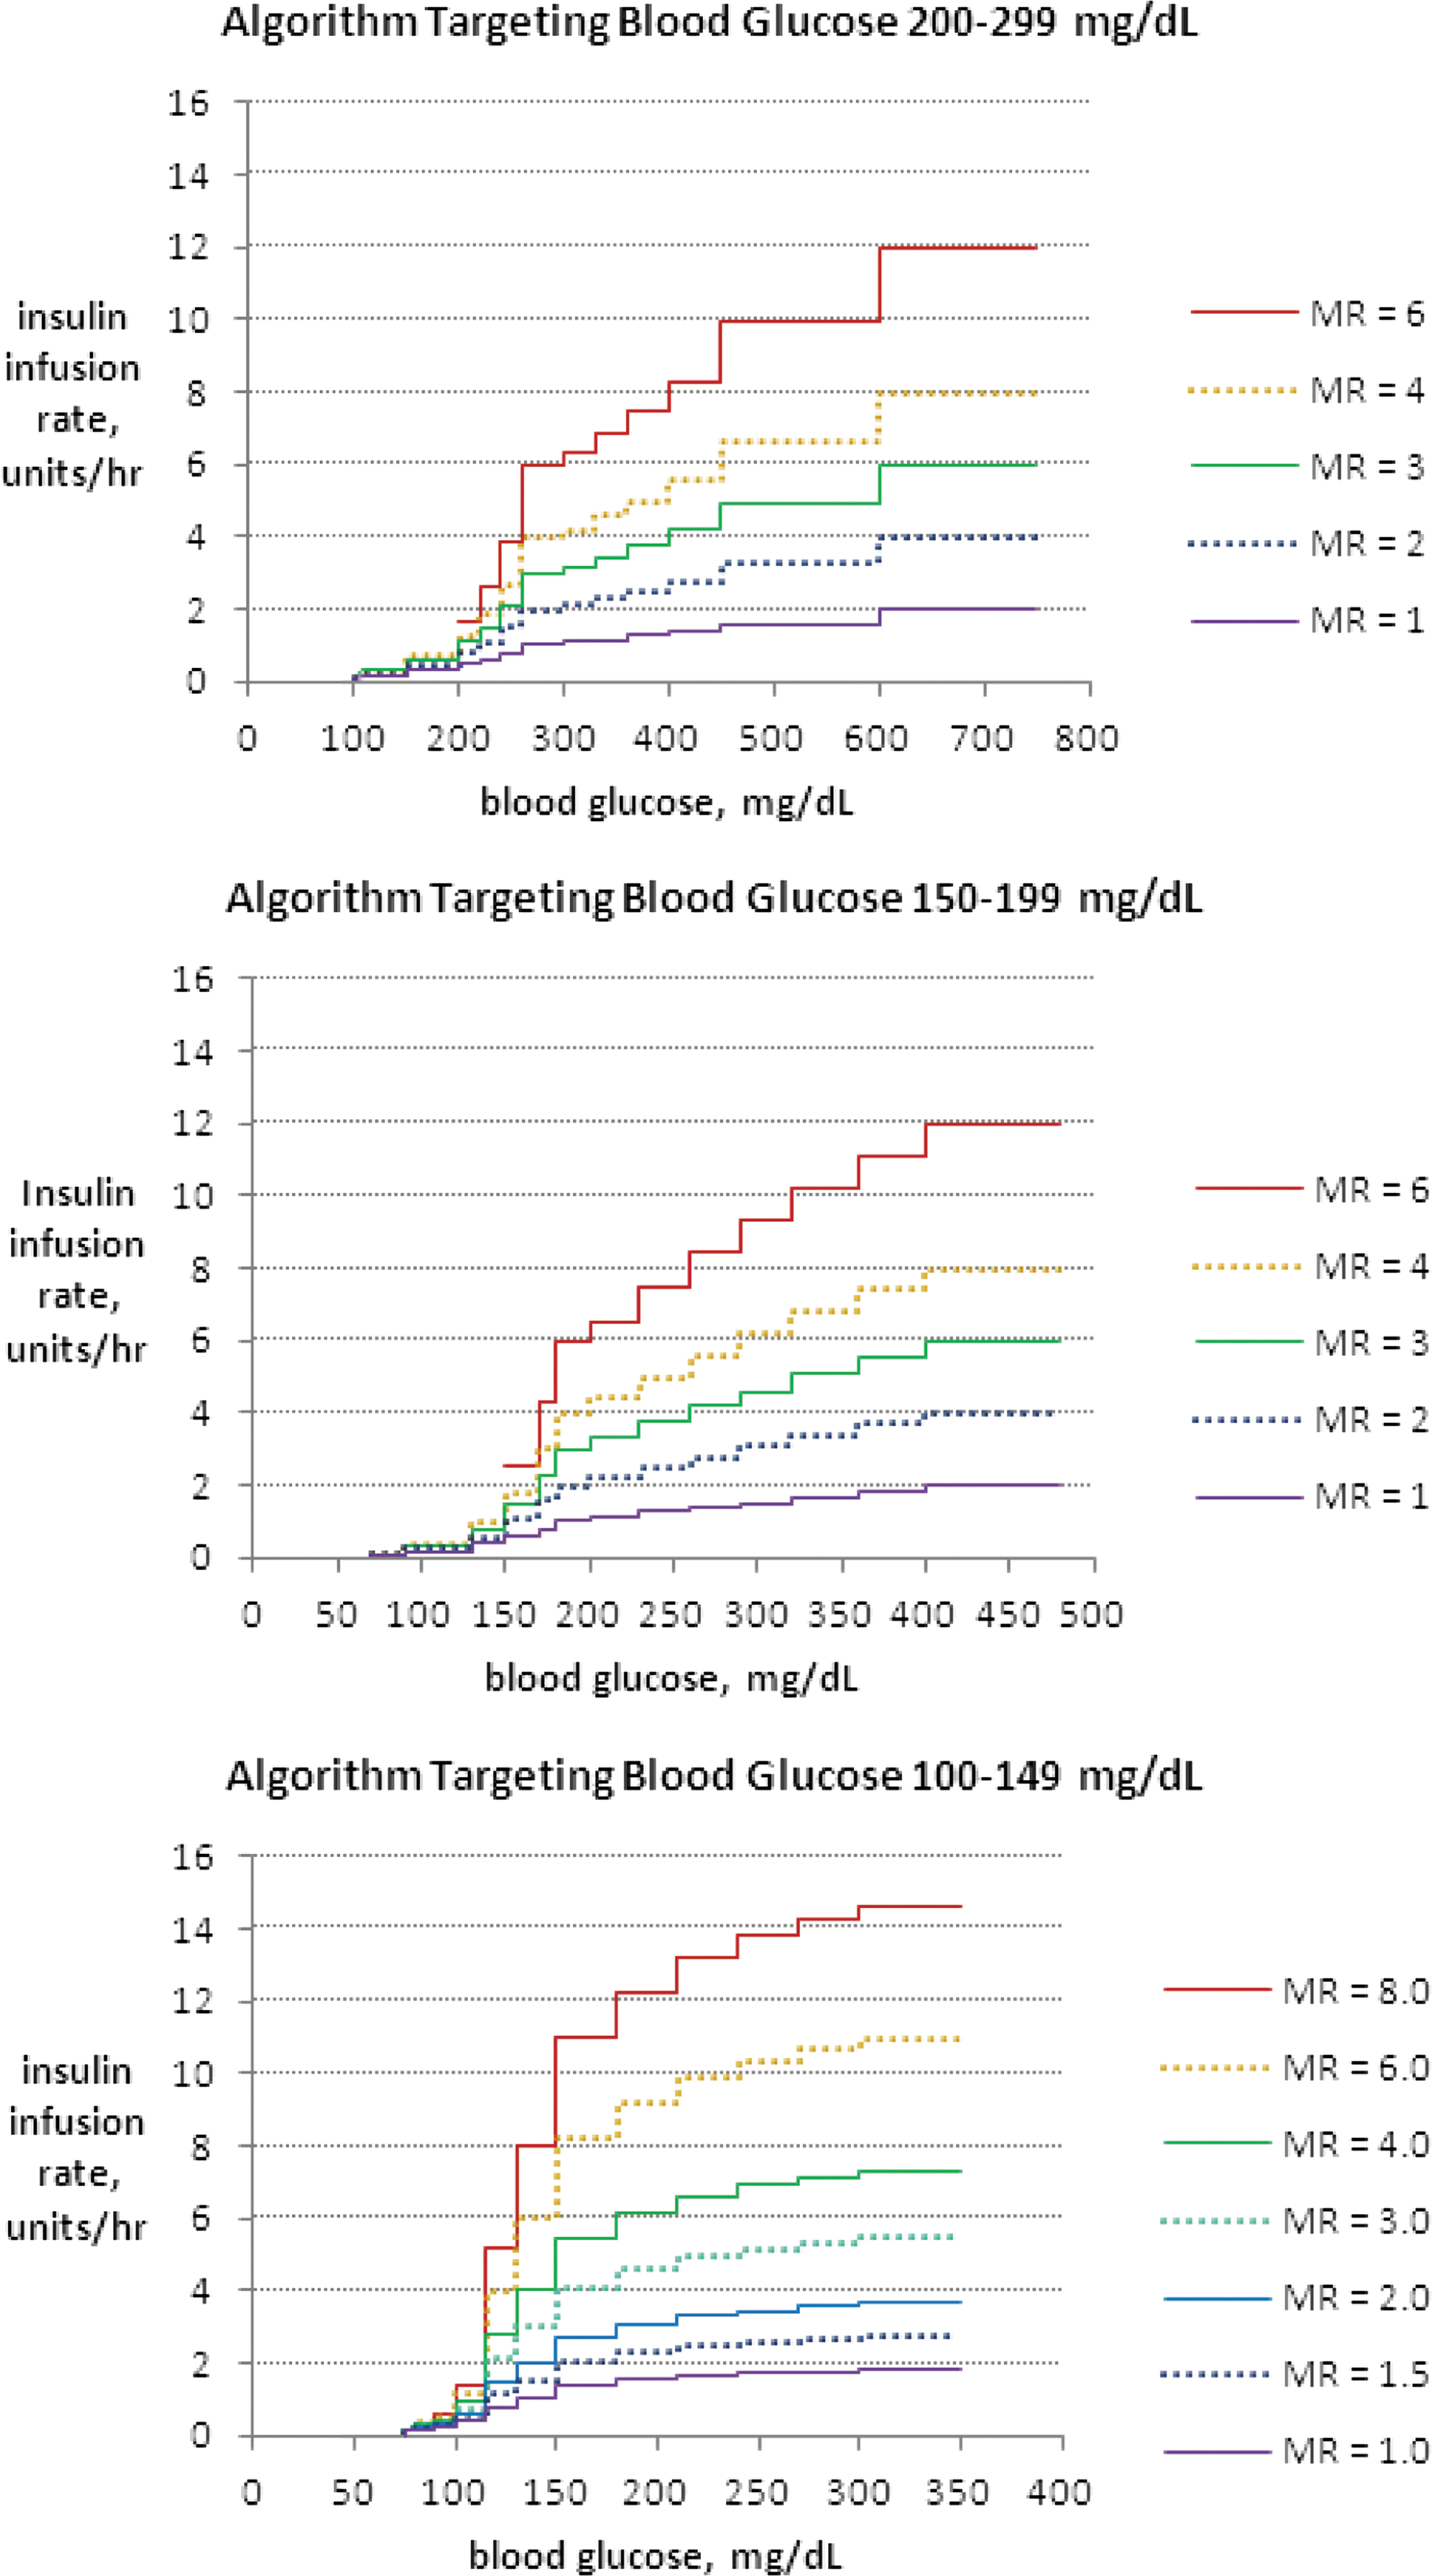
Insulin infusion rate as a function of blood glucose at given maintenance rate (MR) assignments. Recommended insulin infusion rates under the study algorithms are shown for target ranges of blood glucose (in mg/dL) equal to
The parameters used for the paper protocols shown here may be carried over after computerization. Recognition of rate of change of blood glucose (BG) in relation to previous insulin infusion rate (IR), and response to user inputs about risk factors for hypoglycemia, will eliminate the need for use of column-change rules. Revision of MR will be achieved computationally. The parameter BGlower target will be used to recognize need for forced adjustment of MR. To prevent "winding up" of the MR and insulin IR, additional constraints, including maximum assignable rates of insulin infusion, are required for computerization.
The equations can be used to assign the infusion rate (IR) when column assignment rules have identified a value for the maintenance rate (MR). Implementation as a computerized algorithm requires determination of the MR by computational methods, replacing the column change rules of the paper tabular algorithms, prior to each assignment of IR for the coming iteration.
BG, blood glucose; G-per-DIEM, glucose per daily dose of insulin, exogenously mediated.
Specific values for algorithm parameters are shown that were used for construction of three paper tabular versions having different target ranges. The maintenance rate (MR) is an insulin infusion rate associated with each column of the algorithm that is assigned when the blood glucose (BG) is close to true target. Each algorithm shows ranges of BG as rows, having columns shown left to right in order of ascending values of MR. After selection of a BG representative of each row, the equations of the algorithm were used to determine insulin infusion rates, to become the specific entries to each cell of the table, advising the user on the infusion rate for the next iteration of the algorithm. Choice of the representative BG for each row was conducted conservatively, so that the rows of the tabular protocol on the average permit higher BG boundaries for assignment of given infusion rates than those suggested by the equations. Providers have an option of starting on a column other than the default. The first step for the user, after performing a test of BG, is to determine the column assignment according to the column assignment rules and then to select a row according to BG. Under the column change rules, nursing staff are instructed to change to a higher or lower column based on the rate of change of BG but may not make upward column changes without an order from the provider until rehydration time has elapsed. Hospital units lacking ability to deliver insulin at rates <0.5 units/h may turn off the infusion temporarily, while adhering otherwise to recommendations for frequency of BG monitoring that are incorporated into each version of the algorithm. An outline of response to hypoglycemia provides safety precautions accompanying all versions of the protocol.
ROD, rate of descent.
The electronic medical record EPIC was interrogated for cases of intravenous insulin infusion use at St. Francis Hospital between January and June 2012, inclusive. Multiple treatment courses offered to individual patients were evaluated sequentially for inclusion of the first eligible course. Exclusion criteria included absence of a record of insulin administration, treatment for <4 h, use of subcutaneous insulin before completion of 4 h of treatment, absence of evidence of dynamic revision of IR, or inability to recognize use of one of the three study algorithms. Two additional algorithms available within the healthcare system, “conservative” and “aggressive” variants of the standard default algorithm, were not evaluated (see Appendix). After screening by a single investigator, potential ambiguities were referred for adjudication by a group of three investigators (see Appendix). In order to identify transition from emergency room treatment protocols, all instances of use of a hyperglycemic crisis algorithm were adjudicated. A treatment course was adjudicated if it was ordered generically as a continuous infusion of regular insulin, without chart order for use of a specific algorithm, or if the conservative or aggressive algorithm was ordered.
Data analysis
Retrospective chart review was conducted for baseline data collection for each case that was identified and found to qualify. The patient's age on admission, gender, use of total parenteral nutrition, history of multiple trauma prior to admission or major surgery on the same admission, and status at discharge were noted. Between admission and termination of data collection during insulin infusion, in the series targeting BG 200–299 mg/dL or 150–199 mg/dL, criteria were sought suggestive of HHS or DKA, respectively, including arterial pH if available, serum bicarbonate, anion gap, urine or serum ketones, and serum osmolality. Also, instances of late hypoglycemia or hypokalemia were noted, occurring after termination of data collection used for BG averaging but during insulin infusion or within 12 h after infusion termination.
Point-of-care time-stamped glucose monitoring was performed using Precision XC meters (Abbott Diabetes Care, Alameda, CA). Except for point-of-care measurements that were assigned no exact value (such as “>500”), all determinations of BG, as either laboratory or point-of-care data, were included for determination of last BG before initiation of algorithm use and analysis of performance, from the time of algorithm initiation through the time of termination of data collection used for BG averaging.
Time to upper target BG was evaluated. Mean BG after first reaching the upper target range BG, the fraction of BG readings within the acceptable range for each algorithm, the number of patients experiencing any episode of BG <70 mg/dL, and duration of data collection were determined, with inclusion of the first BG at target through final BG prior to occurrence of the earliest of the following data end points: • 24 h after first reaching upper target BG • interruption of intravenous insulin infusion • time when first subcutaneous insulin was given
Termination of data collection used for BG averaging after 24 h was intended to achieve comparable time frames of observation between groups. Subcutaneous insulin “given” refers to any dose given after initiation of intravenous insulin infusion under a study algorithm.
Statistical analysis
The last BG before initiation of algorithm use was expressed as a raw mean with standard deviation (±SD) and, after reverse-transformation of the mean and SD of logarithmically transformed BG values, as a geometric mean with multiplicative standard deviation (÷/×MSD).
Using both untransformed data and also logarithmically transformed BG data and performing operations in Excel® 2007 (Microsoft®, Redmond, WA), the mean BG and the SD of BG of each patient were evaluated. The group mean values of the means of the logarithmically transformed BG dataset of each patient with an arithmetic SD for each of the three groups were reverse-transformed. The resulting metric with its MSD is reported as an indicator of central tendency of glycemic control characterizing a typical individual patient member of each group, referred to as the “geometric group mean” (GGM). The group mean values of the SDs of the logarithmically transformed BG dataset of each patient with arithmetic SD for each of the three groups were reverse-transformed. The resulting metric is reported as an indicator of glycemic variability characterizing a typical member of each group, the “multiplicative surrogate SD” (MSSD). If the MSSD is applied to the GGM, the interval bounds that are obtained represent a BG distribution of an artificial patient typifying the characteristic BG distribution of a member of the group. 8,9 These metrics were developed for use in the described hospital setting, lacking continuous glucose monitoring, with recognition that SD commonly is used to identify dispersion of BG in hospital settings and that the distribution of BG often approximates a log-normal distribution, 10 such that SD might be most appropriately applied after logarithmic transformation.
Within the group treated under the standard default algorithm targeting BG 100–149 mg/dL, the surgical and nonsurgical subgroups were examined for differences of overall glycemia and variability. Using a two-tailed t test with assumption of unequal variance and assigning significance at a value of P<0.05, the subgroup mean values (±SD) of the means and the subgroup mean values (±SD) of SDs of the BG datasets of each patient were compared, first using raw data and then logarithmically transformed BGs, expressed after reverse transformation with MSD, as the GGM (÷/×MSD) and MSSD (÷/×MSD) for each subgroup. The t test similarly was used to compare the subgroups of fatalities and survivors treated under the standard default algorithm.
Results
The search strategy identified intravenous insulin infusion treatment courses among 82 unique patients. The numbers of patients excluded were 16 after screening by a single investigator and three after adjudication, for the following principal reasons: insulin infusion <4 h before termination (n=10), infusion <4 h before subcutaneous insulin given (n=2), no evidence of use of a dynamic algorithm (n=3), conservative algorithm ordered (n=2), aggressive algorithm ordered (n=1), and, on review of BG values and insulin rates, inability to recognize attempted execution of a specific dynamic algorithm (n=1). Of the remaining 63 patients, the number classified by a single investigator to have been treated under the standard default algorithm group was 10. After adjudication, the numbers classified to have been treated under the HHS, DKA, and standard default algorithm groups, respectively, were three, seven, and 43 additional patients.
The study groups after exclusions of ineligible cases thus consisted of three patients treated under the HHS algorithm, seven treated under the DKA algorithm, and 53 treated under the standard default algorithm (Table 4). During use of a study algorithm in the time period between attainment of target and a data end point for BG averaging, there were five BG values <70 mg/dL occurring in five different patients, each treated under the standard default algorithm, being 57, 58, 61, 65, and 66 mg/dL (Table 5). Hypoglycemia after these end points under the DKA and HHS algorithms is described below.
BG, blood glucose in mg/dL; SD of BG, standard deviation in mg/dL; MSD, multiplicative standard deviation, unitless; TPN, total parenteral nutrition.
BG, blood glucose in mg/dL; SD of BG, standard deviation in mg/dL; CV, coefficient of variation; GGM=group geometric mean in mg/dL; MSD, multiplicative standard deviation, unitless; MSSD, multiplicative surrogate standard deviation, unitless; SQ, subcutaneous.
The three and seven cases treated under the HHS and DKA algorithms, respectively, all were qualified for analysis of BG control after the time of first attainment of target under the algorithm. One case in each of these series was excluded from averaging of the time-to-target because target had already been reached prior to or at the time of initiation of recognizable use of a study algorithm, in each case related to antecedent intravenous insulin infusion.
In the group of three patients treated under the algorithm having target range 200–299 mg/dL, no patient had a chart record of meeting all the following five criteria suggesting classification as HHS prior to resolution: any plasma glucose >600 mg/dL, any serum osmolality >320 mOsm/L, all arterial pH >7.3, all bicarbonate >15 mEq/L, and ketonuria or ketonemia minimal or absent. Bicarbonate values >15 mEq/L were found in all three patients. Each of four other criteria suggesting classification as HHS was met by two of the three patients. During and within 12 h after termination of insulin infusion under the algorithm, no hypoglycemia <70 mg/dL was noted, but hypokalemia was seen in two cases, with the lowest value being 3.1 mEq/L (Appendix, Table A1).
In the group of seven patients treated under the algorithm having BG target range 150–199 mg/dL, two patients had a chart record prior to resolution of meeting all five criteria that suggest classification as DKA. Two criteria met by all patients were any anion gap >12 mmol/L and any plasma glucose >250 mg/dL. The numbers of patients meeting each of three additional criteria were two, four, and five for any arterial pH <7.3, bicarbonate <15 mEq/L, and the presence of at least moderate ketonuria or ketonemia, respectively. All had some degree of ketonemia or ketonuria. Of the seven patients in this group, late hypoglycemia <70 mg/dL was seen during and within 12 h after termination of the insulin infusion in one patient and within 4 h after termination in another patient having end-stage renal disease, with the lowest BG being 63 mg/dL within these time frames. Hypokalemia during or within 12 h after termination of infusion was seen in three of the seven patients, with the lowest potassium being 2.7 mEq/L (Appendix, Table A2).
In the group of 53 patients treated under the standard default algorithm, there were one multiple trauma case and 23 surgical cases. The remaining 29 patients except for minor procedures were medical admissions. In the surgical subgroup, the classification of operations was as follows: arthroplastic, n=1; peripheral vascular, n=1; abdominal, n=2; and cardiothoracic, n=19, of which 16 were coronary artery bypass procedures. Before target had been reached there were administration of subcutaneous insulin in four cases and termination of insulin infusion in two cases (one having a fatal outcome after withdrawal of care and attainment of both end points in one case). With exclusion of these five cases, 48 cases remained that were evaluable for analysis of BG control between the times of first attainment of target under the standard default algorithm and a data end point. One additional case already was at target on initiation of the algorithm, leaving 47 cases evaluable for time-to-target (Table 5). There were no instances of severe hypoglycemia during the data collection intervals. The series was not examined systematically for late hypoglycemia. However, it was noted that one patient, apparently having been started at the highest column rather than the default column, experienced severe hypoglycemia of <40 mg/dL shortly after interruption of the infusion.
When the 35 hospital survivors and 13 nonsurvivors treated under the standard default algorithm were compared during the data collection time frame after first reaching target BG, before and after logarithmic transformation of data no significant differences were found between the mean values of mean BG or between the mean values of the SD's of each patient. Within the standard default group, when the subgroups of 23 surgical and 25 nonsurgical cases were compared, the mean (±SD) values of the untransformed mean BG levels of each patient were 136.5 (±10.9) mg/dL versus 134.7 (±31.7) mg/dL for the surgical and nonsurgical subgroups, respectively (P=0.79). The subgroup raw means of SD (±SD) of each patient were 19.9 (±8.8) and 29.0 (±18.2) mg/dL, respectively (P=0.03). Using logarithmically transformed data, the subgroup means of mean BG levels of each patient did not differ, after reverse-transformation yielding GGM (÷/×MSD) equal to 134.6 (÷/×1.08) mg/dL versus 128.3 (÷/×1.26) mg/dL (P=0.33). However, the means of the SD values of the logarithmically transformed BG levels differed, after reverse transformation yielding MSSD equal to 1.16 (÷/×1.06) versus 1.24 (÷/×1.13) (P=0.01) for the surgical and nonsurgical subgroups, respectively.
Discussion
A long-range goal of our algorithm development is to develop technology such that randomization to specific targets may be improved and to learn whether glycemic variability and hypoglycemia among critically ill patients treated with intravenous insulin infusion can be reduced by design of dynamic insulin rules. In 2001 a single-center report from Leuven, Belgium found that in-hospital mortality was reduced by 34% for patients who had received intensive insulin management during critical surgical illness. 11 In the NICE-Sugar study, a large multicenter trial enrolling both medical and surgical critically ill patients, the finding was not reproduced: 829 patients (27.5%) died in the intensive-insulin control group, and 751 (24.9%) died in the conventional-control group (P=0.02). 12 The overall first morning mean raw BG values in the NICE-Sugar study±SD were 118±25 and 145±26 mg/dL for the intensive and conventional groups, respectively. Because existing strategies for intensive control lead to a greater risk of severe hypoglycemia, 13 the question reasonably could be raised whether outcomes during intensive management could be improved if technology were capable of achieving specific glycemic targets with lesser risk of hypoglycemia.
In the present series the measures of central tendency showed reasonable preservation of target range BG control, once target first was achieved. An earlier study from Yale found that once BG levels fell below 140 mg/dL, 52% of values fell within the target range of 100–139 mg/dL, and 66% fell within the range of 80–139 mg/dL. 14 Here we report that under the standard default algorithm, 63.0% fell within the range of 100–149 mg/dL. As a reflection of variability, we examined the SD during intervals of relative stability of the mean. The patient average of raw SD (±SD) in the standard default group reported here, 24.7 (±15.1) mg/dL, is comparable to that from North Carolina, 22.9 (±8.7) mg/dL, under an algorithm aiming at a lower target range. 7
Hypokalemia or hypoglycemia sometimes complicates treatment of hyperglycemic crises. 15 –18 The American Diabetes Association consensus statement recommends using a weight-based insulin IR until attainment of target range control. 1 In evaluation of the glycemic control achieved by the algorithms designed for treatment of DKA or HHS, we did not require that a definition of DKA or HHS be met. It is possible that patients meeting a strict definition of each hyperglycemic crisis condition would experience metabolic effects different from what was shown here. A long-range goal of our insulin algorithm development is to describe and reduce the frequency of hypoglycemia and hypokalemia during and within 12 h after completion of intravenous insulin infusion under algorithms for DKA or HHS that use a dynamic insulin rule. Any analysis of effect on late hypoglycemia and hypokalemia of course requires analysis of concomitant fluid and electrolyte therapies affecting risk for these events.
Measures of central tendency and variability did not differ between hospital survivors and nonsurvivors, but when the surgical and nonsurgical cases treated under the standard default algorithm were compared, during the time frame of data collection after first attainment of target BG, greater glycemic variability was demonstrated among the nonsurgical patients, despite similarity of mean BG. Treatments administered by the anesthesia service were not captured in the electronic medical record. We cannot discount the possibility that insulin infusion antecedent to recognized use of the standard default algorithm may have contributed to stabilization of column assignment in some cases. The numbers of patients are small, the study was not powered to show differences between survivors and nonsurvivors or between nonsurgical and surgical cases, and multivariate analysis was not attempted. We are uncertain whether to attribute clinical significance to the greater patient glycemic variability shown in the nonsurgical subgroup.
Limitations of the study include its small size, the retrospective design, lack of information on concomitant carbohydrate exposure, the unbalanced numbers of patients in the treatment groups, and the possibility of misclassification of algorithm use during adjudication of ambiguous cases. Computerized time-stamping was available for point-of-care test results, but not for the times of insulin IR changes, which were entered manually to the computer, and not for draw times of laboratory BG levels. We did not use a trapezoidal rule for time-weighting of BG values. Time-to-target and glycemic response as presented here reflect only the effects after recognizable use of the respective algorithms had commenced. Antecedent insulin therapies varied and were not consistently retrieved by chart review, including pre-arrival use, intravenous bolus, other user-defined intravenous infusion protocols, and subcutaneous insulin. Emergency room protocols differed from those used in the ICUs. Electronic access did not include anesthesia records. Effects of previously administered insulin, even that given intravenously, might have been exerted for more than an hour after those treatments had been terminated. 19 Therefore, there is a danger of misattribution of effects of previous insulin therapy to the study algorithms.
The greatest limitation of the study results from the fact that a paper protocol is required to translate the rules of the algorithms into action. Minor protocol deviations were a pervasive finding among those cases that were brought for adjudication. Because errors of algorithm execution may result from burden on nursing and algorithm complexity itself, we thought that the consequences of such errors should be captured in the evaluation of the protocols and therefore did not disqualify cases solely on the basis of user errors alone, as long as attempted use of a study algorithm was recognizable.
In the United States, lacking regulatory approval of a closed-loop system, in order to guide intravenous insulin infusion therapy many institutions use paper and Web-based algorithms and multiplier-based decision support devices. 20 –23 Some commercialized medical devices in the United States rely on a principle that patient insulin sensitivity will determine revisions of a multiplier used to establish a linear dependency of IR on BG. For readings below target, these algorithms may require dextrose infusion and/or temporary interruption the infusion. 23 This report from Saint Francis Hospital of the performance of algorithms having three different target ranges 5,6 represents a milestone in the development from predecessor paper tabular algorithms, having similar format but different target ranges. 7,24 –27 The long-range goal is to achieve full computerization. 28 The reported algorithms here introduce use of a nearly sigmoidal relationship of IR as a function of BG, such that each algorithm has an inflection point at BG close to true target. These algorithms achieve low rates of hypoglycemia without interruption of insulin infusion. Alternative strategies could be envisioned that would prevent severe excursions of BG below target. For example, insulin infusion for BG values below target could be interrupted completely, as some multiplier algorithms do. An argument against strategic temporary interruption of insulin infusion is, quite simply, that a human error of forgetting that the patient remains under treatment using an insulin infusion protocol, with failure to retest and resume insulin therapy in a timely manner, is likely to occur in actual practice.
The recognition of user variations of algorithm implementation, taken together with the observation that the algorithms performed well, but imperfectly, lead us to argue that computerization of the rules of the algorithm as a decision support system could be beneficial. The column change rules, although conservative, are arbitrary. A subroutine for assignment of the MR over a continuous range of possible values has been evaluated in silico, with prediction of safety and effectiveness. 29 Additionally, imperfect performance of the sigmoidal rule could be improved by programming a continuous function to represent the MR-dependent IR.
Computerization for piloting will entail mathematical determination of MR based on initial assumptions and subsequent response to therapy. A family of curves specific to each target will replace each family of step functions. The program will yield IR as a strictly increasing, continuous, and differentiable quadruply sigmoidal function on the entire domain of BG, having a short and relatively more flat midregion on the target range, surrounded by the ascending limbs of the sigmoidal curve.
Conclusions
An algorithm design is described, featuring discovery of an MR of insulin infusion by column-change rules and assignment of an MR-dependent insulin IR according to ambient BG. For each MR, a roughly sigmoidal relationship between BG and IR is specified, such that the inflection point falls approximately at a true target BG. Here we have presented pilot data showing that the algorithm design is capable of achieving three specific targets. A systems approach and staff education could lead to greater consistency of order entry and algorithm execution. Computerization of the algorithms as a decision support system might reduce burden to nursing staff, improve the mathematical design of the algorithm, and possibly further improve its performance.
Footnotes
Acknowledgments
The authors would like to acknowledge and thank members of the nursing and nutrition services, pharmacy, resident physicians, attending physicians, information technology, and administrative staff without whose work this report would not be possible.
Author Disclosure Statement
No competing financial interests exist.