
Abstract
Background:
Laboratory hemoglobin A1c (HbA1c) assays are typically done only every few months. However, self-monitored blood glucose (SMBG) readings offer the possibility for real-time estimation of HbA1c. We present a new dynamical method tracking changes in average glycemia to provide real-time estimation of A1c (eA1c).
Materials and Methods:
A new two-step algorithm was constructed that includes: (1) tracking fasting glycemia to compute base eA1c updated with every fasting SMBG data point and (2) calibration of the base eA1c trace with monthly seven-point SMBG profiles to capture the principal components of blood glucose variability and produce eA1c. A training data set (n=379 subjects) was used to estimate model parameters. The model was then fixed and applied to an independent test data set (n=375 subjects). Accuracy was evaluated in the test data set by computing mean absolute deviation (MAD) and mean absolute relative deviation (MARD) of eA1c from reference HbA1c, as well as eA1c–HbA1c correlation.
Results:
MAD was 0.50, MARD was 6.7%, and correlation between eA1c and reference HbA1c was r=0.76. Using an HbA1c error grid plot, 77.5% of all eA1c fell within 10% from reference HbA1c, and 97.9% fell within 20% from reference.
Conclusions:
A dynamical estimation model was developed that achieved accurate tracking of average glycemia over time. The model is capable of working with infrequent SMBG data typical for type 2 diabetes, thereby providing a new tool for HbA1c estimation at the patient level. The computational demands of the procedure are low; thus it is readily implementable into home SMBG meters. Real-time HbA1c estimation could increase patients' motivation to improve diabetes control.
Introduction
H
More recently, the A1c-Derived Average Glucose (ADAG) Study Group evaluated data from diabetes patients and people without diabetes using self-monitored BG (SMBG). 6 The aim was to define a relationship between HbA1c and average glucose levels and determine whether HbA1c could be expressed and reported as average glucose in the same units as used in self-monitoring. They found that a linear regression between HbA1c and average glucose values provided the closest relationship, allowing for calculation of an estimated average glucose for HbA1c values. This relationship did not differ significantly across subgroups based on age, sex, diabetes type, race/ethnicity, or smoking status and has been adopted as the current recommended relationship to use. 4
A range of factors has been postulated to influence the relationship between HbA1c and BG. 7 –10 In particular, the time of BG measurement (fasting, postprandial, etc.) and the frequency and timing of BG measurement appear to have significant impact on this relationship. Analysis of data from one clinical study found that among individual time points, the afternoon and evening prandial glucose readings showed higher correlations with HbA1c than the morning time points. 11 It has also been noted that at any given time a blood sample contains erythrocytes of varying ages, with different levels of exposure to hyperglycemia. Although older erythrocytes are likely to have more exposure to hyperglycemia, younger erythrocytes are more numerous. Consequently, BG levels from the preceding 30 days have been shown to contribute approximately 50% to HbA1c, whereas those from the period 30–90 days and 90–120 days earlier contribute approximately 40% and 10%, respectively. 12
These factors led some to challenge the linear model approach, turning instead to weighted average and nonlinear approaches that aim to account for the additional factors that influence the relationship between average glucose and HbA1c. 13 –19 Although many of these models are theoretically sound, none offers a practically applicable approach to tracing the fluctuations of HbA1c over time. If shown robust to missing or corrupted data, such an approach could result in an application deployed in a SMBG device with sufficient accuracy to provide real-time estimates of HbA1c. Given that the ability to provide a real-time SMBG-based estimation of HbA1c has been shown to improve glycemic control, 20 we now propose a novel model-based approach to tracking changes in average glycemia from SMBG data that may be applicable to a SMBG device.
Specifically, the proposed method tracks average glycemic from SMBG data and then derives values for estimation of A1c (eA1c) that could be available after every fasting SMBG data point (e.g., daily). The key feature of this approach is that it is capable of working with infrequent SMBG data typical for type 2 diabetes (e.g., fasting readings on most days and occasional [monthly] seven-point SMBG profiles). None of the previously proposed methods meets these restrictions—typically these methods require dense SMBG data (several readings a day) to produce a good estimate of average BG. The proposed method differs from these established techniques by its use of an underlying model that “fills in” the gaps between sparse SMBG values, thereby allowing continuous tracing of average glycemia.
Materials and Methods
Conceptually, the HbA1c estimation procedure divides SMBG measurements into two groups: fasting glucose measurements and seven-point profile glucose measurements (Fig. 1). Fasting glucose readings are expected every day or so and are used to compute the base glucose exposure tracking function of the model, whereas profile measurements are scarce (e.g., monthly) and allow for calibration of the base glucose exposure function to the patient's glucose variability. The final result is an estimate of HbA1c—eA1c, one that is updated with any incoming fasting SMBG data point and is calibrated with any incoming seven-point profile. An alternative calibration could be done using a reference HbA1c measurement.
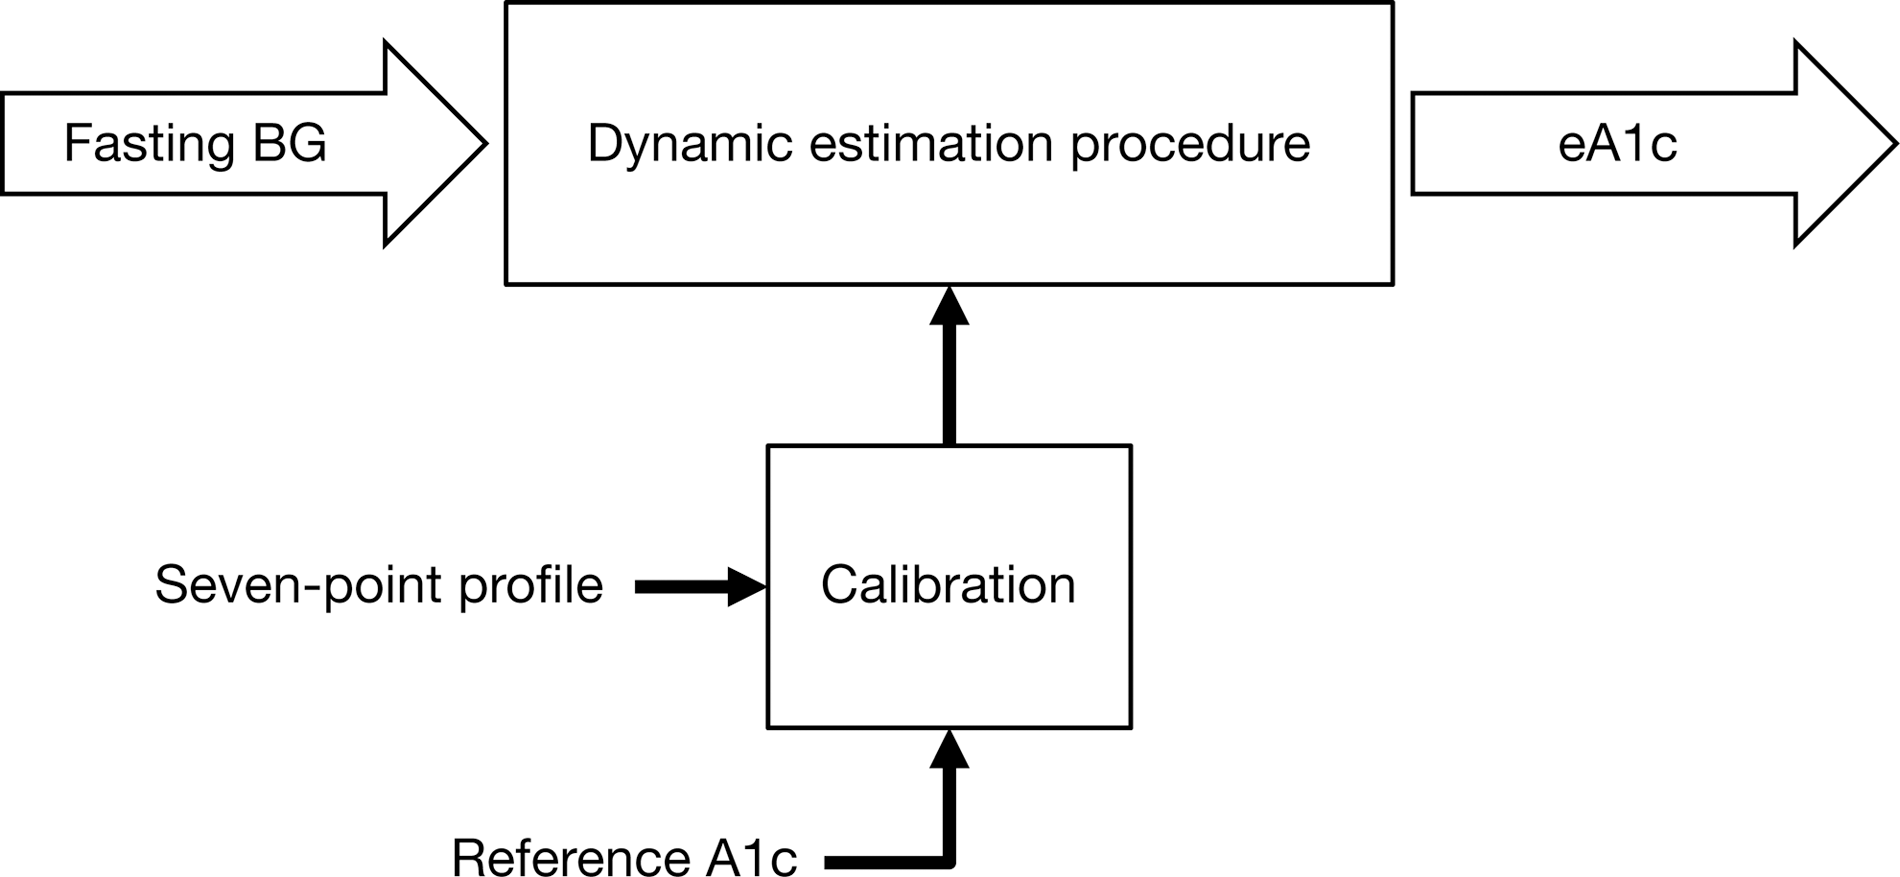
Flowchart of the hemoglobin A1c estimation procedure. Fasting self-monitored blood glucose (BG) readings are used to compute a base tracking function of glycemic exposure, which is then calibrated by a seven-point self-monitored BG daily profile. An alternative calibration method could use reference hemoglobin A1c value.
Datasets
The training and test datasets originated from a published trial in individuals with type 2 diabetes 21 and were provided as completely de-identified data by the study sponsor (Sanofi-Aventis Deutschland GmbH, Frankfurt, Germany). Individuals in the intent-to-treat study population were on average 55 years of age, had had diabetes for 8.7 years, and had a body mass index of 32.3 kg/m2. Most were white (84%), 12% were black, and 3% were Asian. The average (SD) HbA1c level (4,351 data points) was 7.6% (1.1%), with minimum and maximum values of 5.2% and 12.2%, respectively.
All formulas were developed with the training dataset that contained 17,863 fasting SMBG readings and approximately monthly seven-point profiles for 379 individuals. On average, each individual contributed 47 days of data. After using the training data, all formulas were fixed and then applied without modification to the test dataset. The test dataset contained 17,925 fasting SMBG readings and approximately monthly seven-point profiles for an independent group of another 375 individuals. On average, each individual contributed 48 days of data.
A dynamical model of hemoglobin glycation and clearance was constructed that corresponded to a first-order differential equation:
where the function f(SMBGt
) is a function using self-monitoring data to track glucose exposure over time. The parameter τ was estimated in the training dataset and was fixed thereafter at its population value of τ=20. The function f(SMBGt
) was defined as follows:
where mP
0(t) is the average fasting glucose value over the past 6 days (current day included) and is updated every time a new fasting glucose is measured. The function f(SMBGt
) is calibrated using data from the SMBG profiles taken approximately every month. The calibration offset is computed as:
where θ
1 and θ
2 are the principal components of that profile derived via standard data rotation. The iterative procedure tracking average glycemia then runs as follows. First, we compute an initial estimate:
Then, we compute daily runtime estimate:
The runtime estimate tracks average glycemia and presents the data in estimate A1c units.
All parameters of this procedure were estimated using the training dataset and then were kept fixed throughout the method evaluations in the test dataset. The training data were no longer used for any subsequent analyses.
Accuracy of the estimation procedure was evaluated in the test dataset by computing mean absolute deviation (MAD), mean absolute relative deviation (MARD), and correlation between the eA1c and reference HbA1c. An HbA1c error grid plot of eA1c values versus reference HbA1c was used to visualize the results. 22,23 The A zone for eA1c accuracy was defined as eA1c within 10% of reference HbA1c value or both reference HbA1c and eA1c are <6% or >10%. The B zone was defined as eA1c within 20% of reference HbA1c value. eA1c values outside of the A+B zones are generally considered erroneous.
To assess the accuracy of HbA1c tracking over time, the trends in reference HbA1c and estimated eA1c were compared using methods analogous to the methods used for accuracy evaluation of continuous glucose monitors. 24,25 This included comparison of the rates of change in reference HbA1c and eA1c and classification of the result into error zones corresponding to the percentiles of the distribution of the reference HbA1c rate of change, which allowed for assessment of the error of the eA1c trend relative to the magnitude of the underlying reference HbA1c trend.
Robustness of the estimation procedure was analyzed by stratifying the test dataset by reference HbA1c or by stratifying by eA1c and determining bias and MARD. To determine if the initial errors in eA1c shortly after starting the tracking procedure were larger than overall algorithm functioning, eA1c performance for the earliest available HbA1c/eA1c pairs for each subject of the testing dataset (374 pairs) was contrasted to the overall errors. Analysis of eA1c sensitivity to missing fasting BG measurements, to mislabeled profile readings (e.g., premeal mislabeled as postmeal), and to alternative site testing was performed as well. Simulation of missing fasting BG values was done by randomly eliminating fasting values from the dataset, increasing the percentage eliminated from 0% to 90%. Simulation of mislabeled profiles was done by randomly switching BG values in randomly selected profiles, increasing the percentage of mislabeled readings from 0% to 100%. Simulation of alternate site testing was done by randomly associating a multiplicative normally distributed error with mean 0 and SD of 0.1015 (which is equal to 0.2/1.97) to all SMBG readings in the dataset. This choice of mean and SD ensures that 90% of the simulated data fall within 20% of the initial value. Each of these simulations was repeated 10 times, and MARD and correlation of eA1c with reference HbA1c were determined.
Results
Accuracy of the model-based eA1c
In the test dataset, the correlation of eA1c with reference HbA1c was r=0.76; mean absolute and relative deviations were MAD=0.50 HbA1c units and MARD=6.7%. The distribution of estimation errors was as follows: 95% of eA1c values fell within ±17% from reference, corresponding to 95% of the eA1c values within ±1.17 HbA1c units of the laboratory value; 61% of eA1c values fall within ±7% from reference, corresponding to 61% of the eA1c values within ±0.52 HbA1c units of the laboratory value; and 53% of eA1c values fall within ±6% from reference, corresponding to 53% of the eA1c values within ±0.44 HbA1c units of the laboratory value.
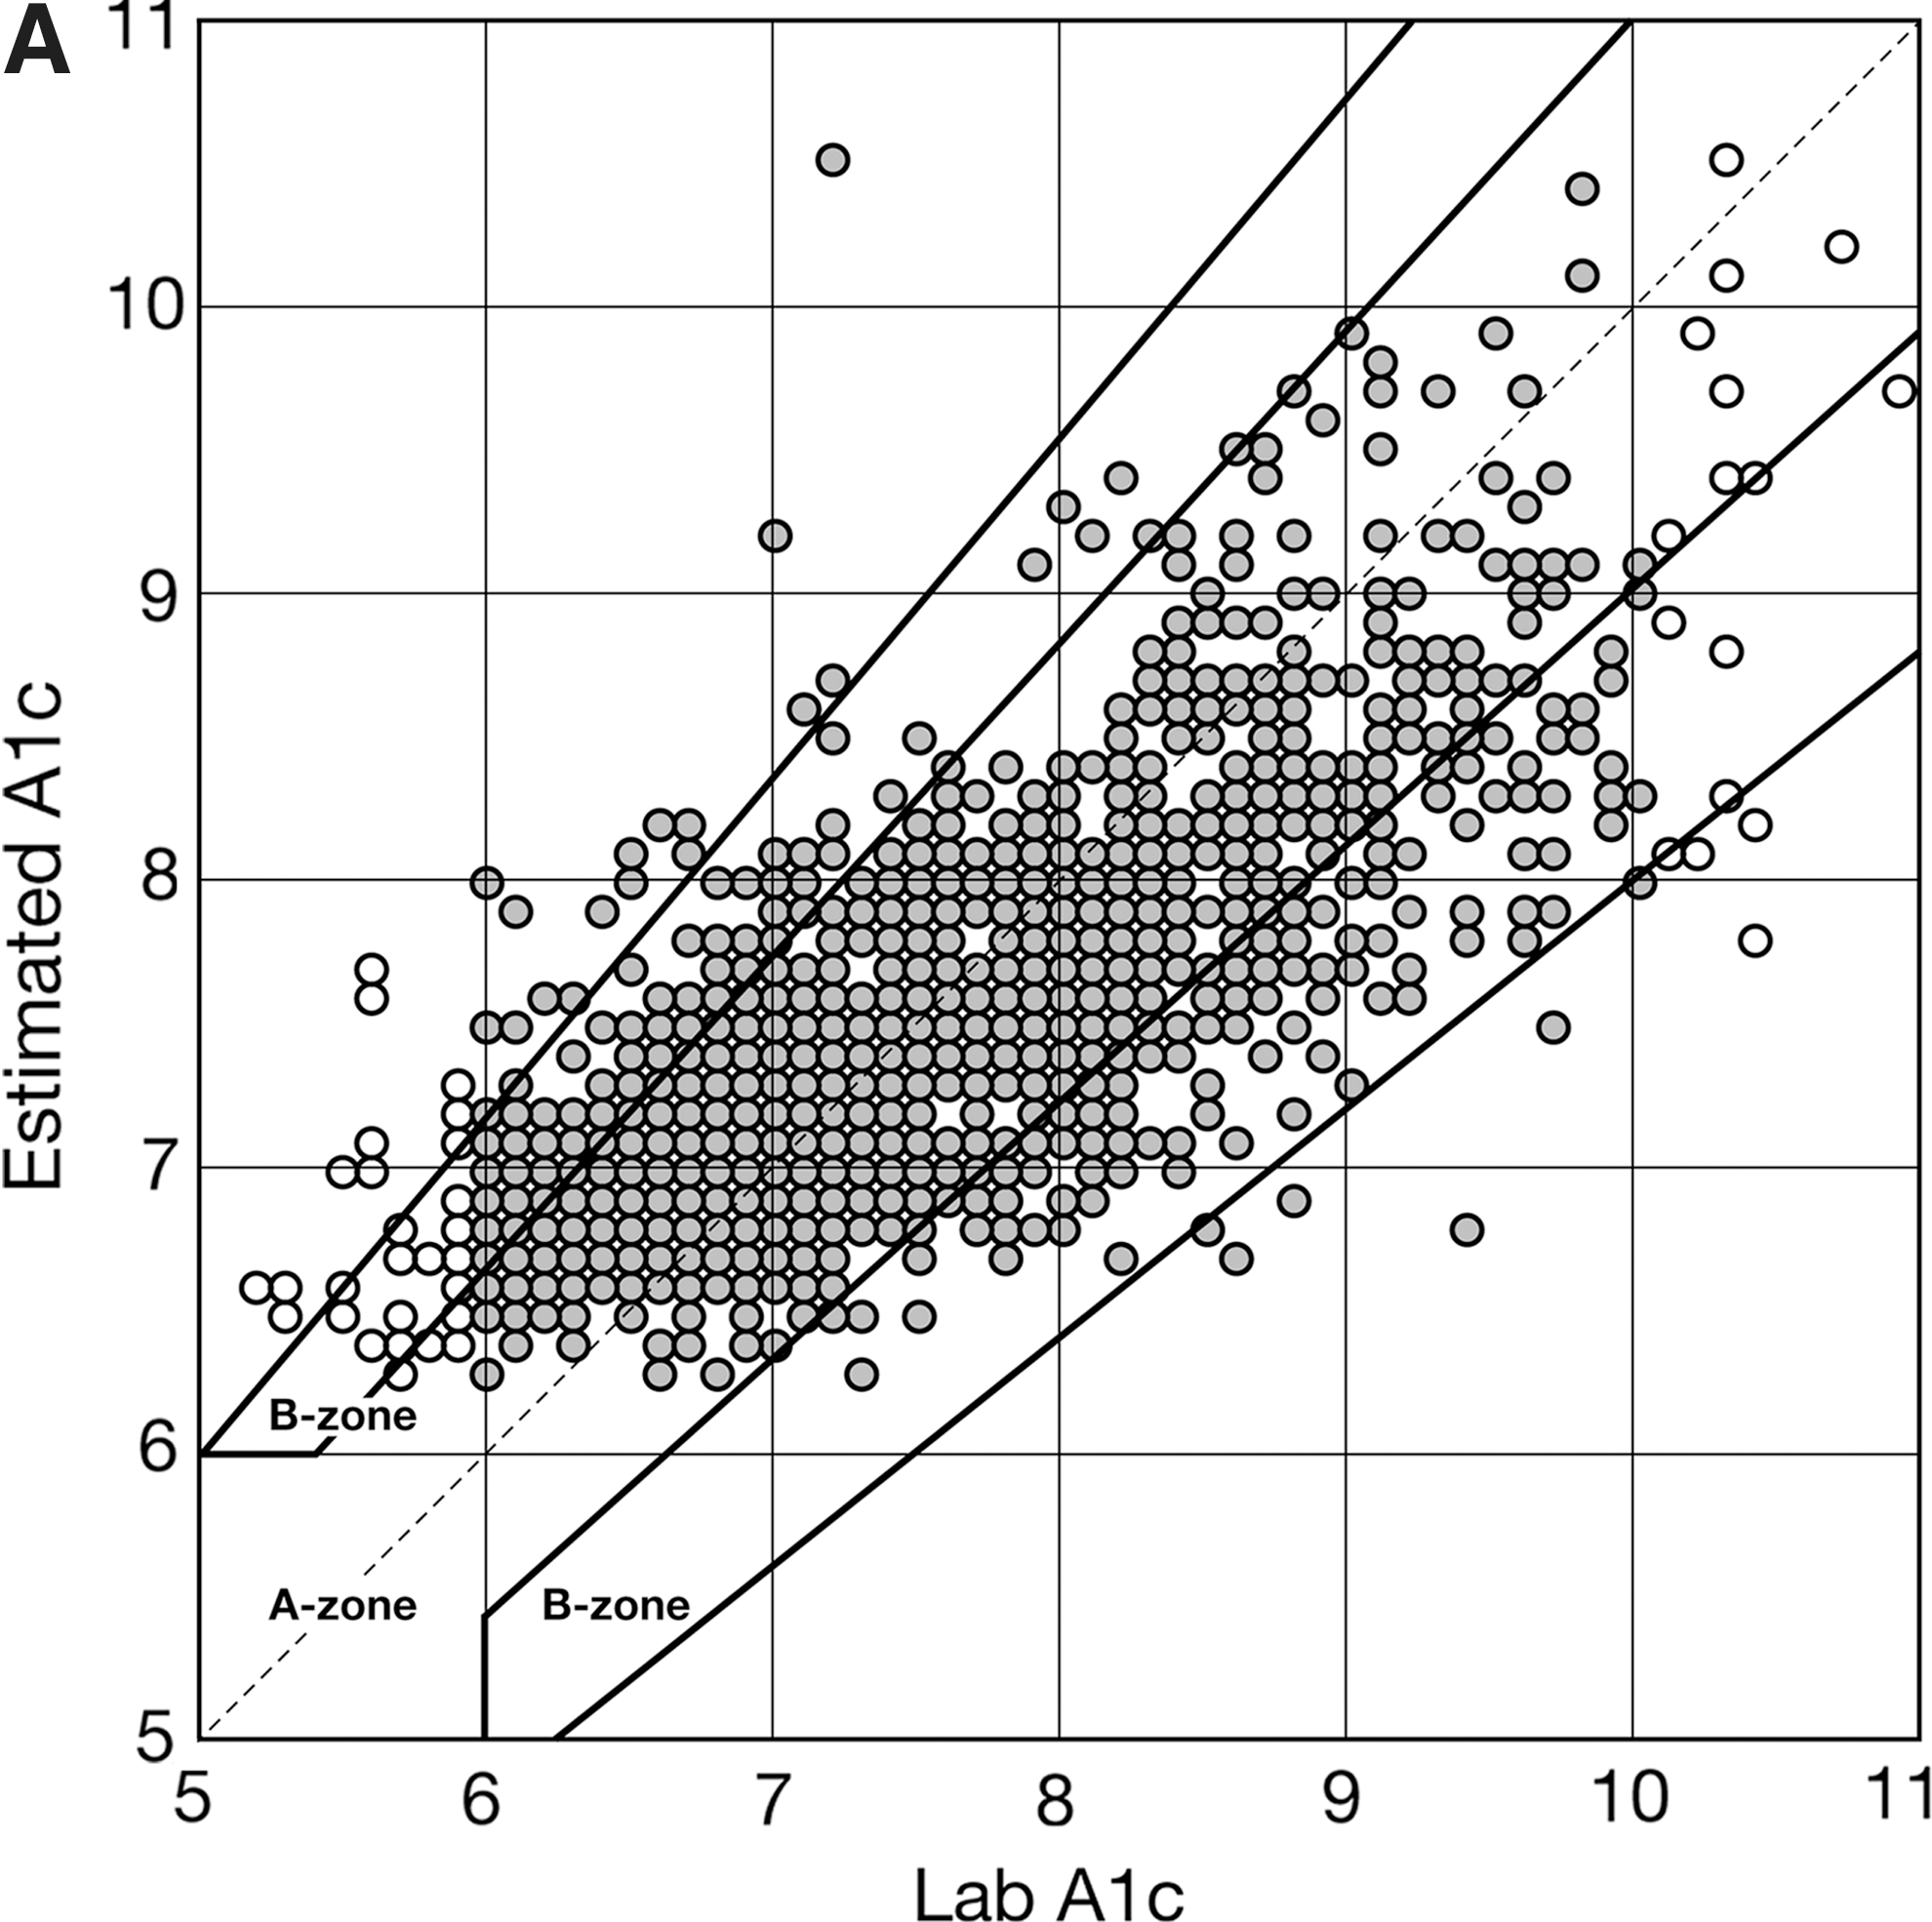
Figure 2A presents the HbA1c error grid plot for eA1c computed using the test dataset. The data are stratified by reference HbA1c values below 6% and above 10% and between 6% and 10%. In total, 77.5% of all eA1c values fell within 10% from reference HbA1c (A zone), and 97.9% fell within 20% from reference (A+B zones). If limited to a reportable HbA1c range (6–10%), the accuracy of eA1c was 79.9% (A zone) and 99.0% (A+B zones). In terms of eA1c trend, there was no difference in the distributions of the HbA1c daily rate of change observed in reference HbA1c values and in eA1c values, with 95% of all estimated trends within ±0.02 HbA1c units/day from reference and 66% of all estimated trends within ±0.01 HbA1c units/day from reference.
Comparison with established methods
Figure 2B presents the HbA1c error grid plot for eA1c computed using the test dataset and an established linear method. 6 The linear formula tended to significantly overestimate HbA1c, particularly readings above 8% HbA1c, and to underestimate HbA1c readings below 6%. This resulted in only 55.1% of the all data pairs within the A zone of the grid and only 86.7% within the A+B zones of the grid. Almost identical results were obtained—55.1% and 86.8%—if the analysis was limited to reference HbA1c of 6–10%.
This result is not unexpected—a linear-regression–type method with a lead predictor average SMBG would tend to be less accurate when the density of the data is low (e.g., a fasting SMBG every day and occasional pre-/postprandial readings).
Detection of HbA1c change
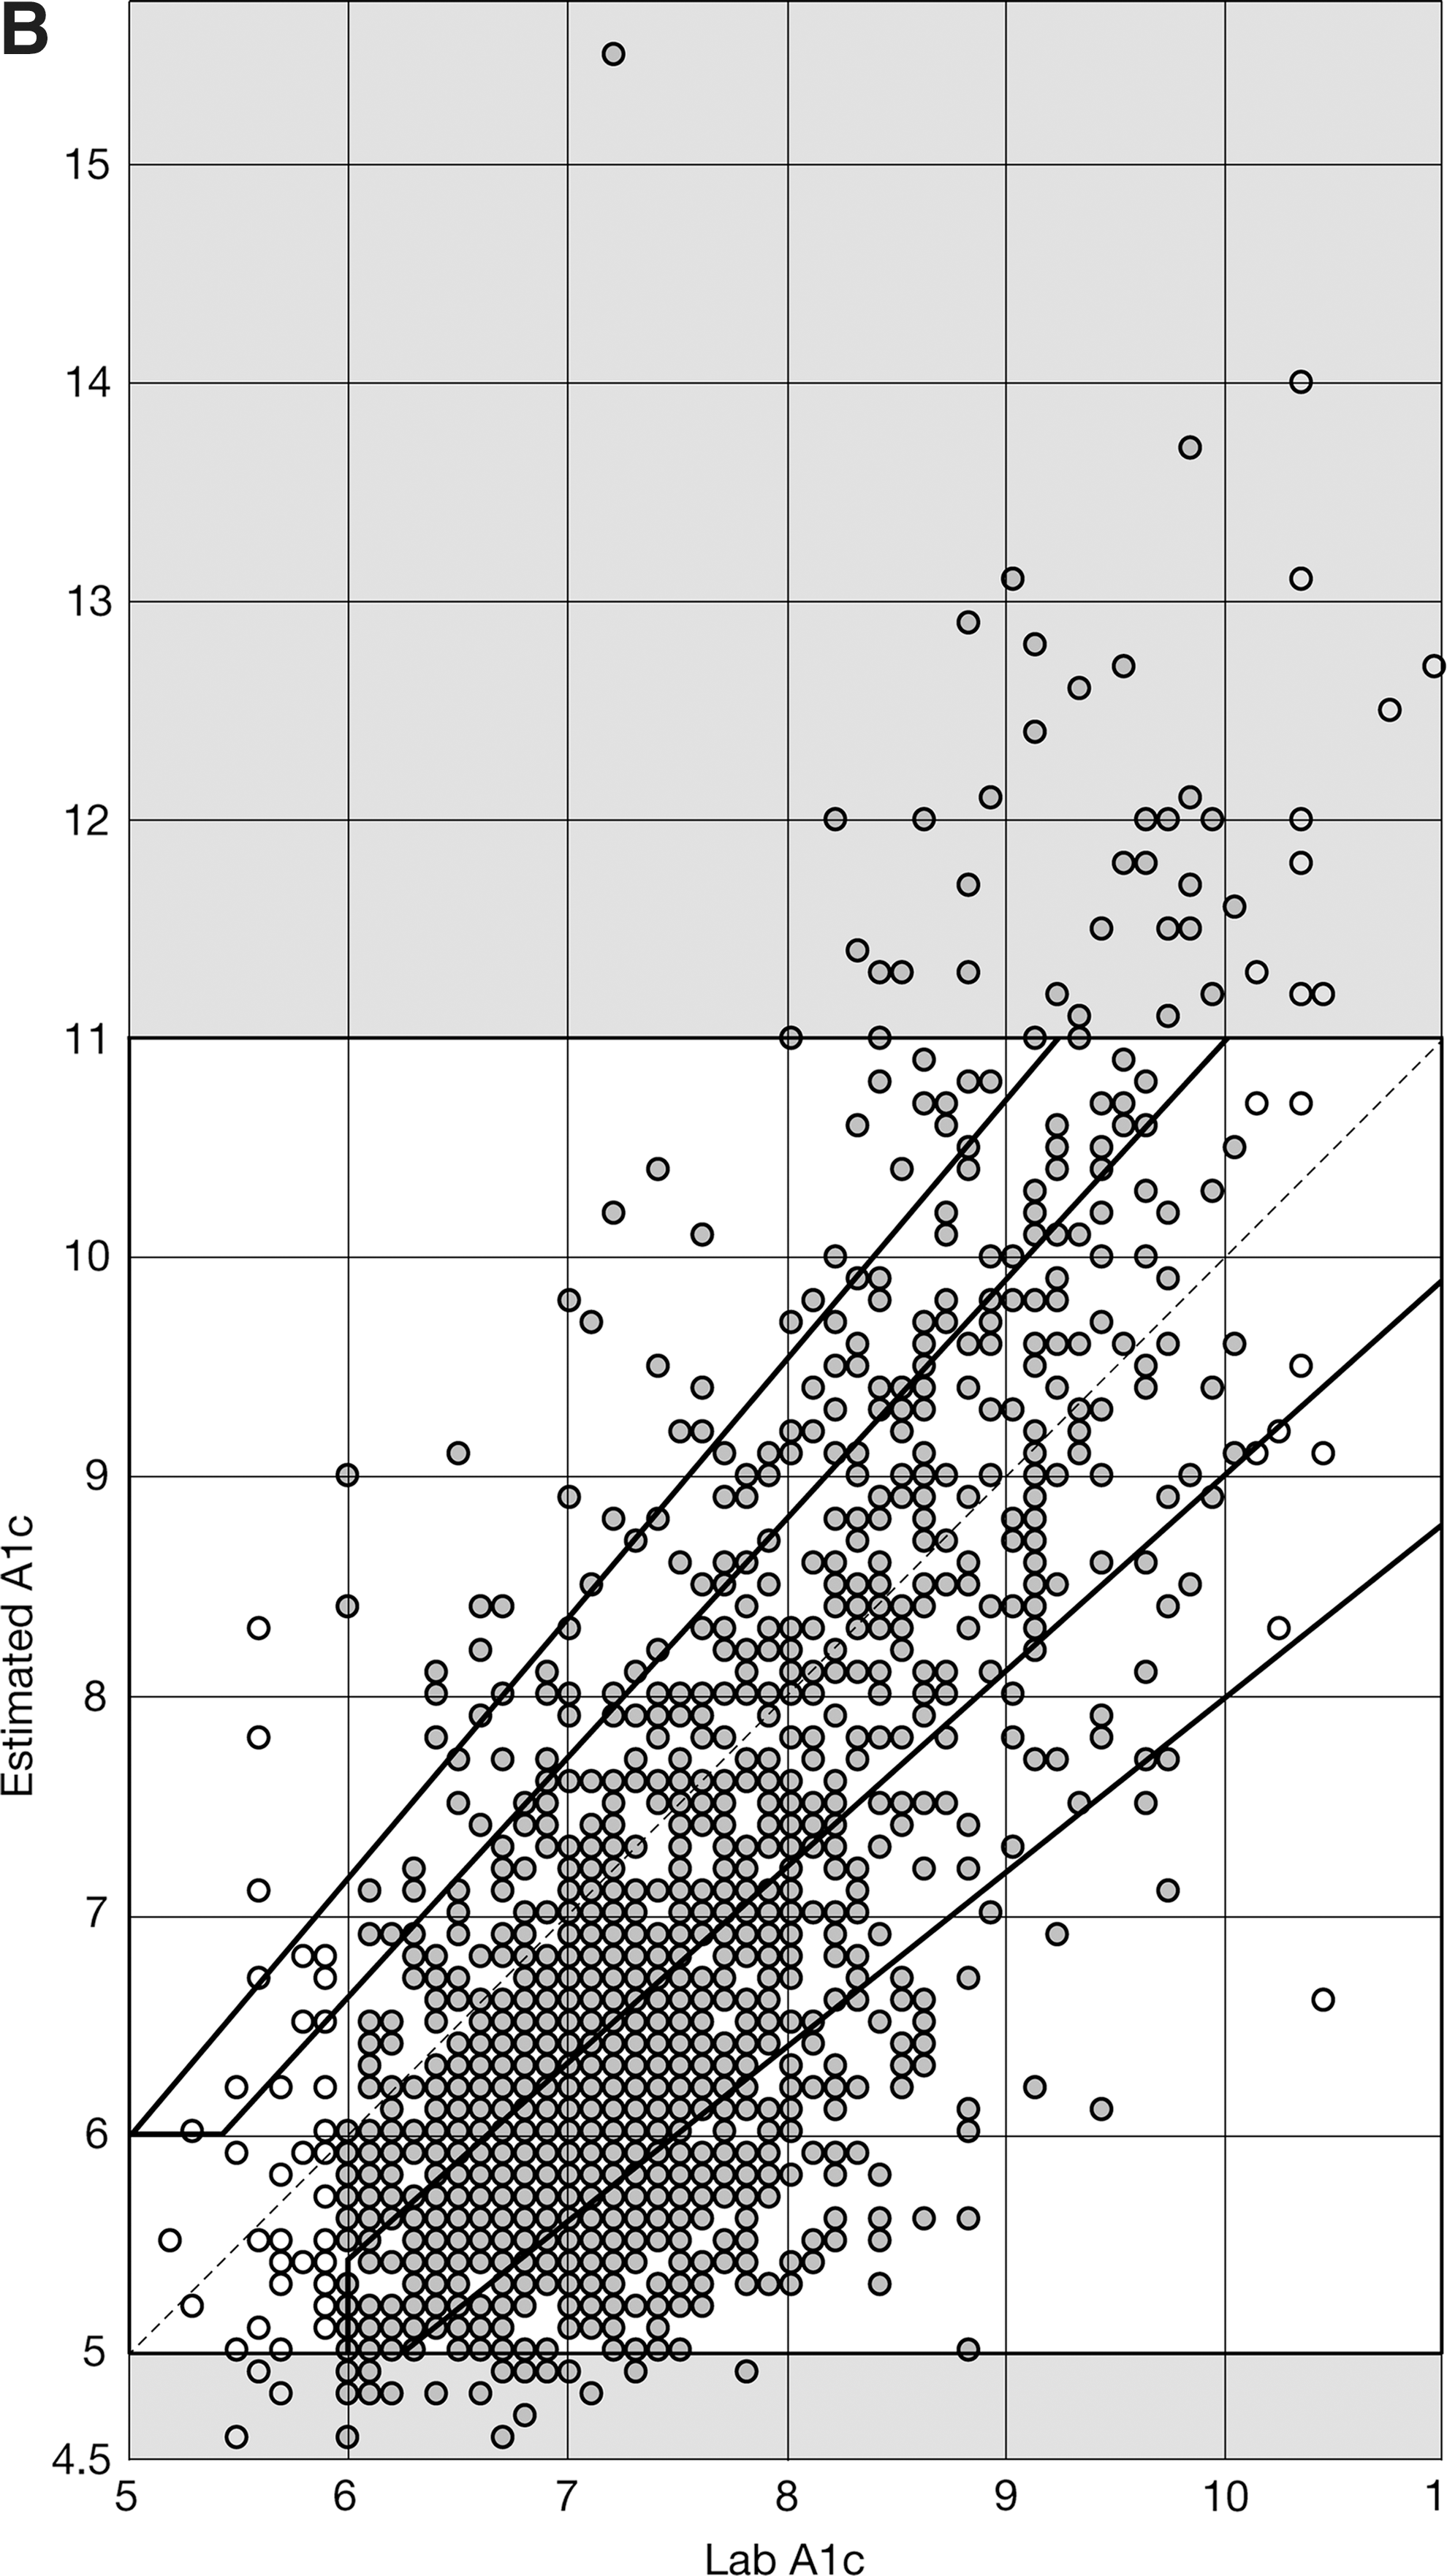
Key questions regarding this system are how it captures a change in the patient's HbA1c and how small of a change it can reliably detect. To assess the algorithm performance in that regard we analyzed sequential HbA1c/eA1c pairs separated by more than 2 weeks in all 375 subjects (352 subjects had at least two HbA1c/eA1c pairs). We then looked at the percentage of eA1c change that was in the same direction as the true HbA1c change (i.e., the algorithm properly detected a change). As larger HbA1c changes should be easier to detect, we looked at the detection probability with increasing HbA1c change. The results presented in Figure 3 indicate that the eA1c algorithm is capable of reliably detecting clinically significant changes: 85% of HbA1c changes of at least 0.3% will be detected, and 95% of changes of at least 0.8% will be detected.
Probability (percentage) for detection in hemoglobin A1c change plotted along the amplitude of the change in reference hemoglobin A1c. A change in hemoglobin A1c is considered detected if the estimation of A1c algorithm indicates change in estimation of A1c in the same direction as reference.
Robustness analysis
Stratifying the data by reference HbA1c, the dynamical method was most accurate in the 7–8% HbA1c range, with minimal bias and 4.7% MARD (Table 1). Within the reportable HbA1c range of 6–10%, the bias of eA1c was always <1% HbA1c and MARD ≤10.6%. Stratifying the data by eA1c and not reporting values below 6% and above 10% resulted in HbA1c biases between −0.36% and 0.07% and MARDs between 6.47% and 7.36%. Performance at the initial eA1c for each subject was similar to overall performance (MARD, 7.6% vs. 6.7%; MAD, 0.67 vs. 0.50). The larger initial MAD was due to the initial HbA1c values being significantly higher than subsequent values (8.5% vs. 7.4%; P<0.01).
eA1c, estimation of A1c; HbA1c, hemoglobin A1c; MARD, mean absolute relative deviation; NA, not applicable.
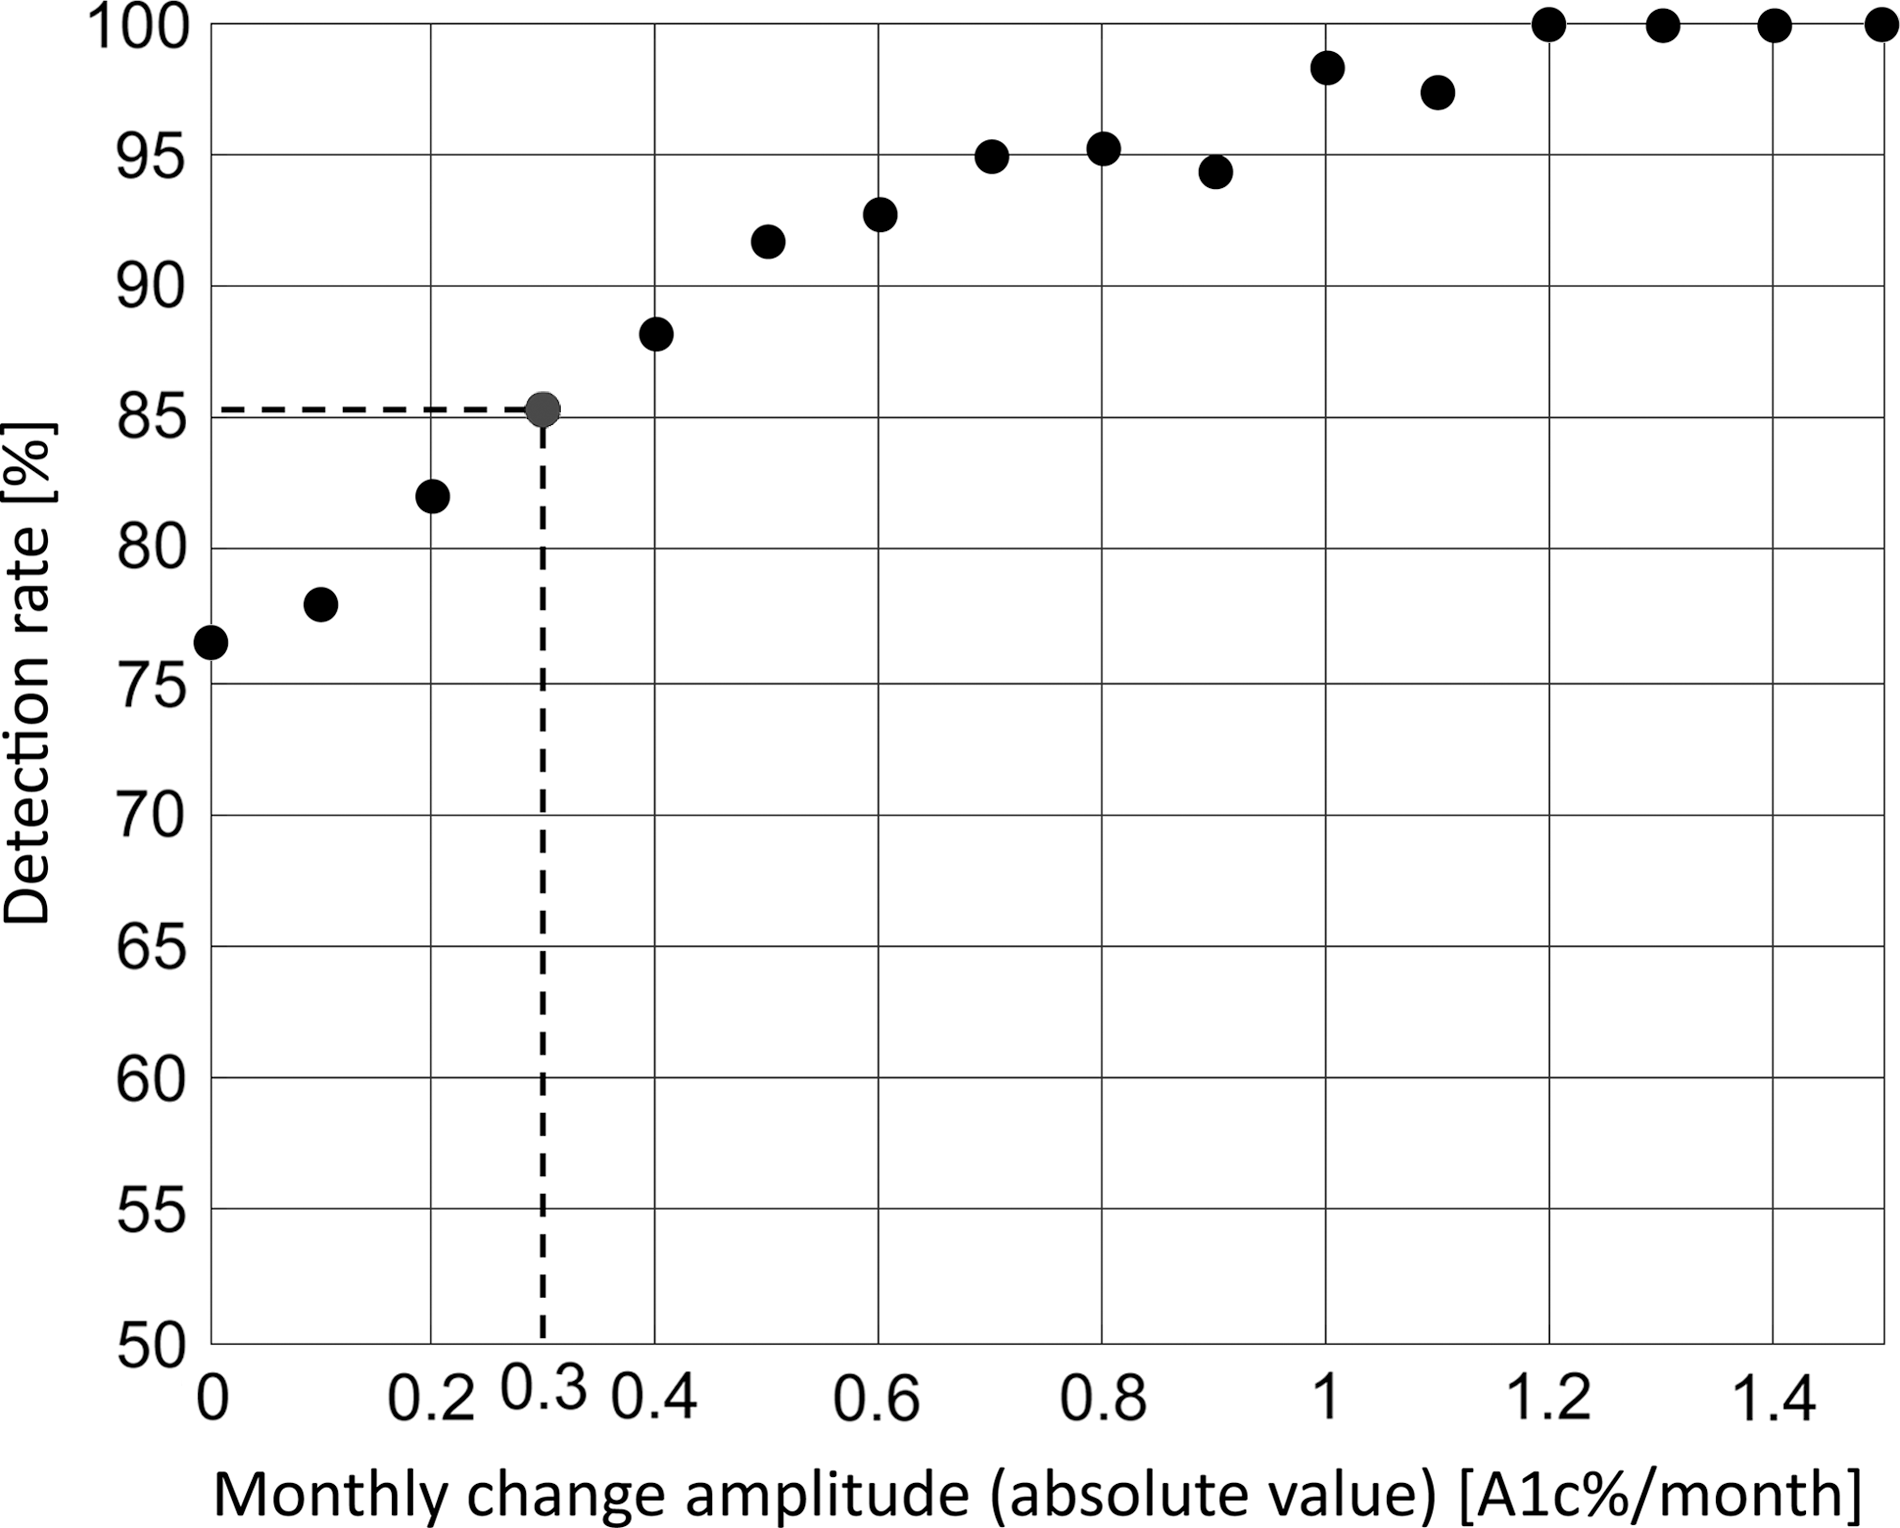
To further test robustness, we randomly eliminated fasting readings, randomly mislabeled daily profiles, and amplified SMBG errors. When 90% of fasting measurements were eliminated, MARD rose from 6.74% to 6.8% (Fig. 4A), whereas correlation with reference HbA1c values decreased from 0.76 to 0.66 (Fig. 4B). When 100% of SMBG profiles were scrambled, MARD rose to 6.99% (Fig. 4C), and correlation with reference HbA1c declined to 0.73 (Fig. 4D). In the worst performance across all alternate site testing simulations, MARD rose to 7.37, MAD rose from 0.50 to 0.55, and correlation with reference HbA1c declined from 0.76 to 0.68.
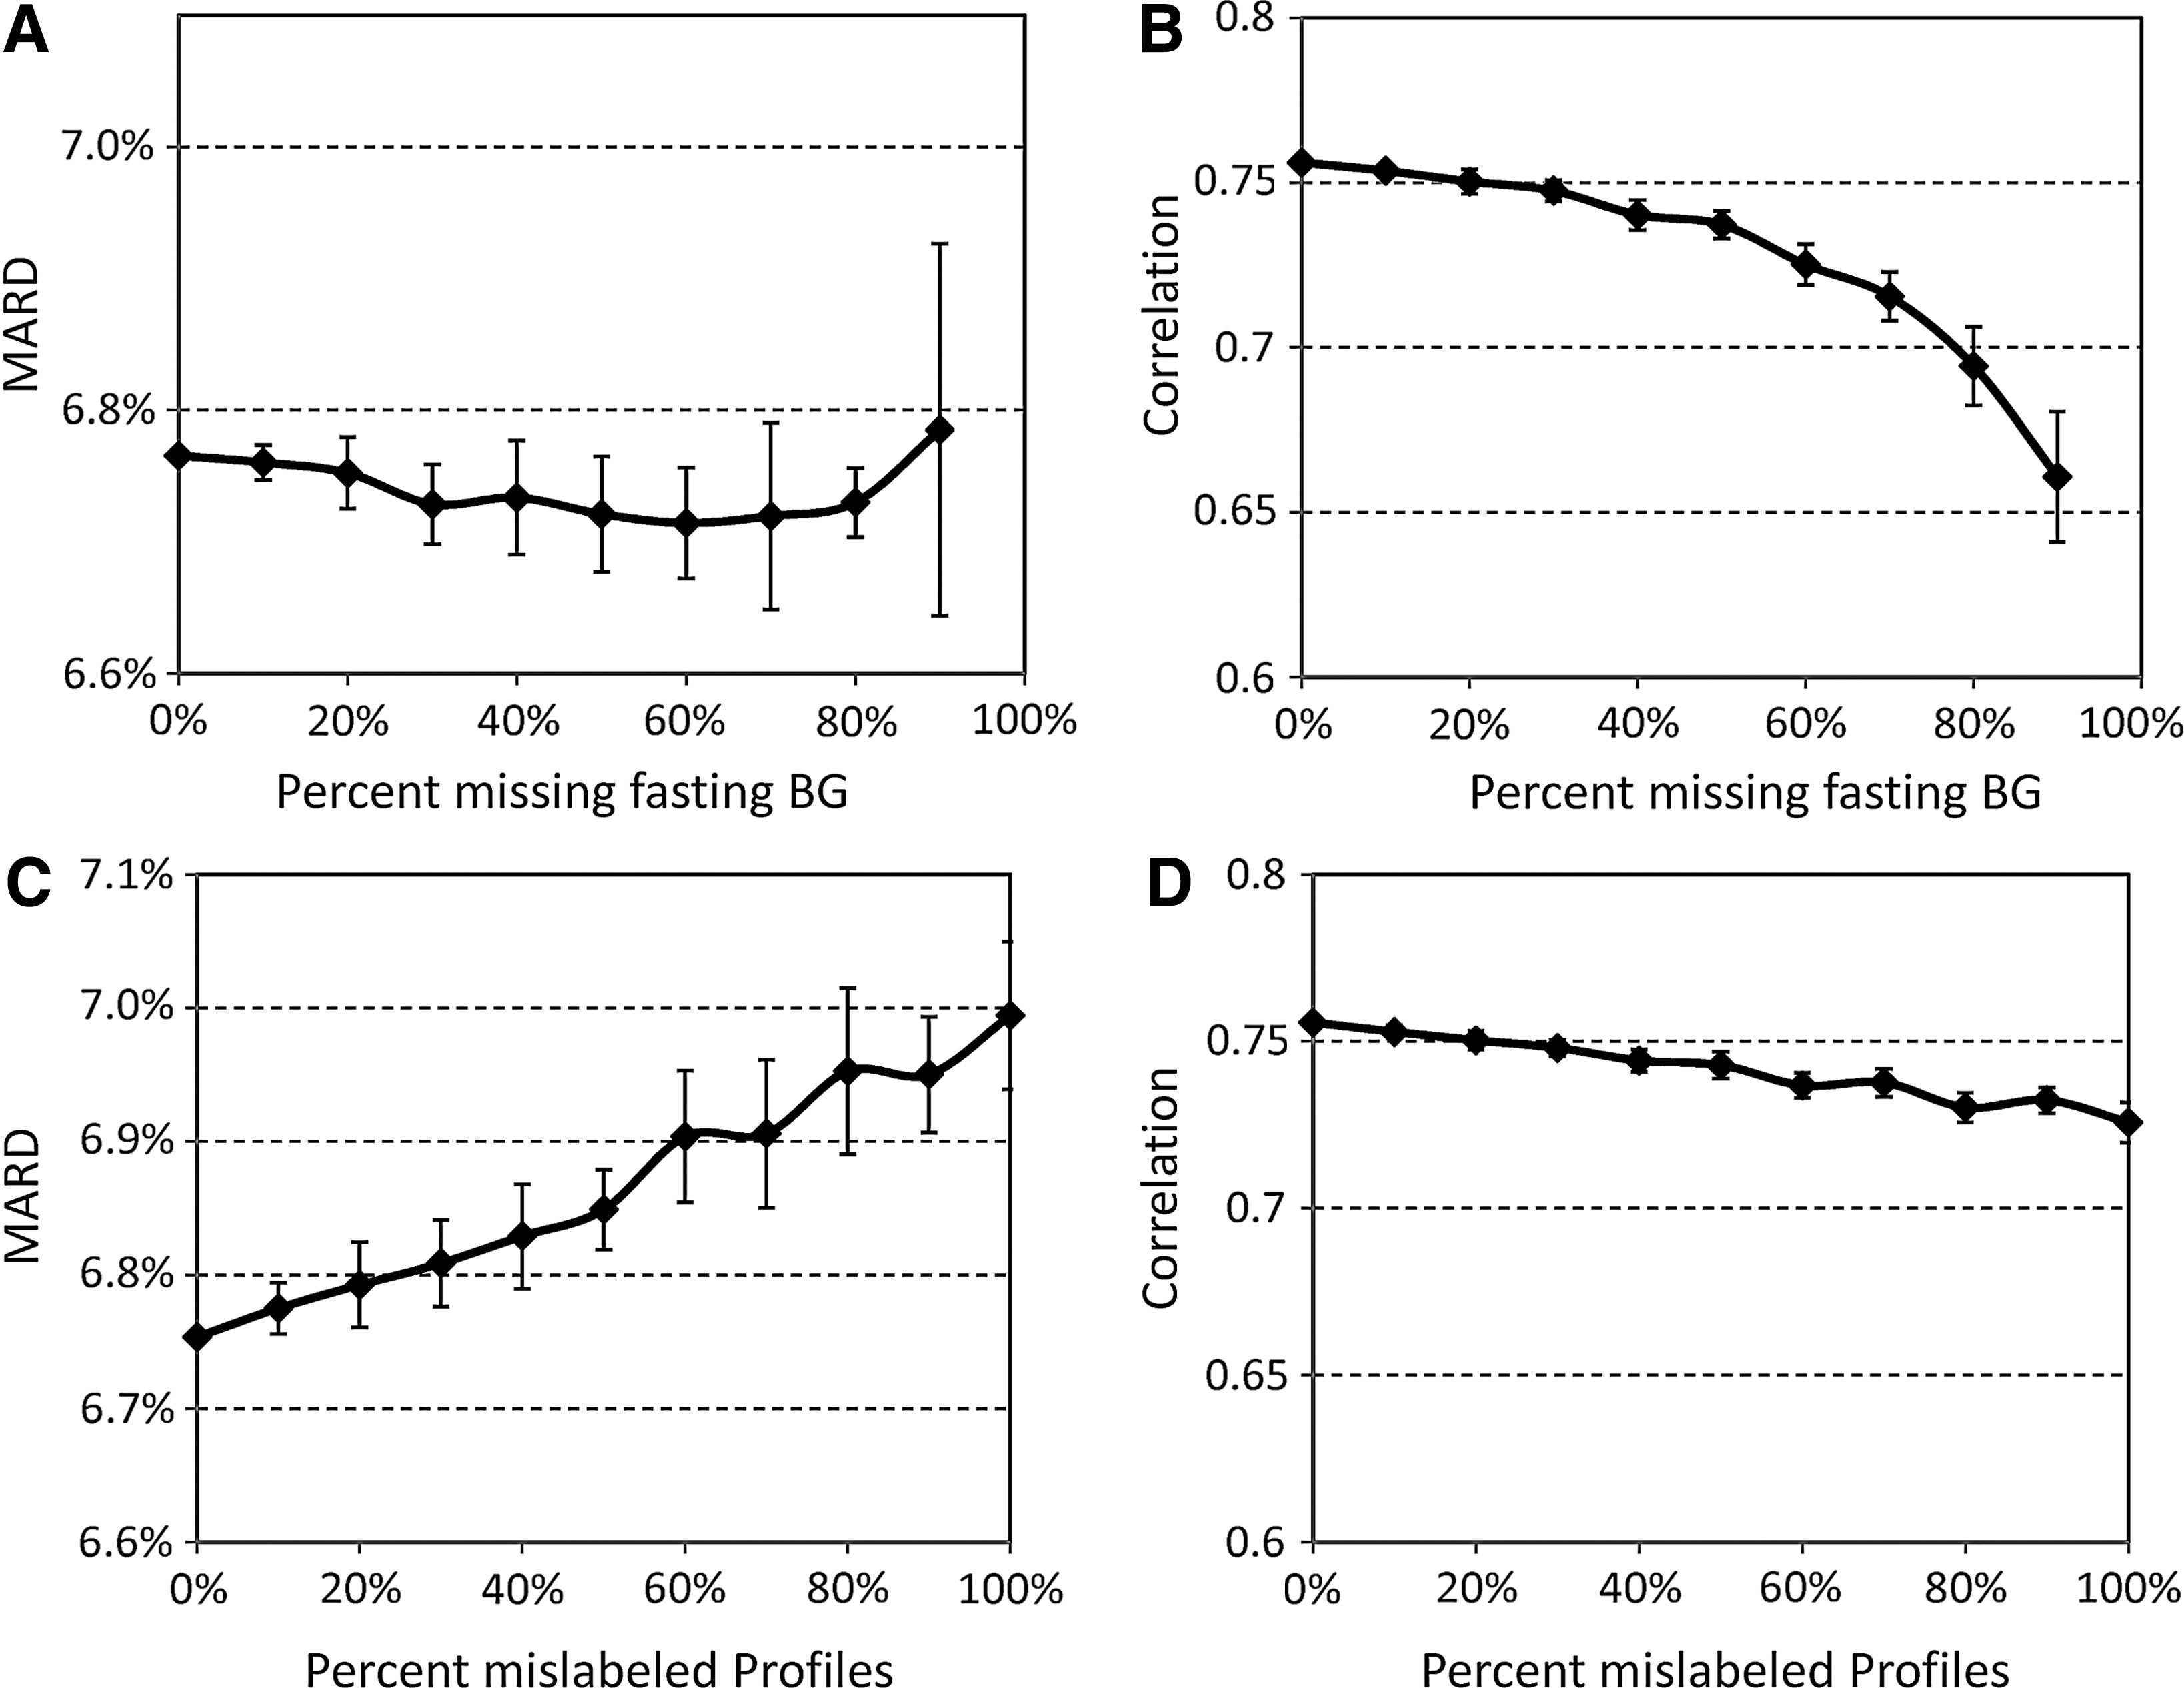
Effect of
Discussion
In diabetes, the struggle for tight glycemic control results in large BG fluctuations over time. These fluctuations are the measurable result of the action of a complex dynamical system, influenced by many internal and external factors, including the timing and amount of insulin and other drug therapies, food eaten, physical activity, etc. The macro (human)-level optimization of this system depends on self-treatment behavior. Such an optimization has to be based on feedback utilizing readily available data, such as SMBG.
Although HbA1c is the gold standard marker for average glycemia, HbA1c assays typically require a laboratory and are routinely done only every few months. Thus, a method to track changes in average glycemia in between laboratory assessments is needed. SMBG offers this possibility, provided that appropriate algorithms are used to retrieve SMBG data.
This report describes a method for tracking changes in average glycemia, based on a conceptually new approach to the retrieval of SMBG data. The principal premise of this approach is the understanding of HbA1c fluctuation as the measurable effect of the action of an underlying dynamical system. SMBG provides occasional glimpses at the state of this system, and, using these measurements, the hidden underlying system trajectory can be reconstructed for each individual.
Using compartmental modeling, we constructed a new two-step algorithm that includes real-time eA1c from fasting glucose readings, updated with any new incoming fasting SMBG data point, and initialization and calibration of the estimated HbA1c trace with daily SMBG profiles taken approximately every month.
The model was developed using training data and then fixed and applied to independent test data, where MARD, the metric that is typically used to assess accuracy of any direct measurement or other assessment of unknown analyte, was observed to be <10%. Achieving MARD below 10% signifies that the method is capable of providing accurate and precise tracking of changes in average glycemia over time. 26 Further analysis revealed that almost 60% of the eA1c deviation from reference HbA1c was due to subject-specific bias, possibly due to individual differences between average glycemia and HbA1c of a person. In such cases, the eA1c algorithm consistently under- or overestimated the reference HbA1c for a specific subject but tracked HbA1c trends appropriately. When the systematic bias was removed, the 95% confidence limits for the remaining noise were ±11%.
In addition, the HbA1c error grid analysis resulted in 99.0% of readings in the A+B zones—a result comparable to the accuracy of contemporary SMBG devices. 27 Thus, the model-based estimation procedure does not introduce further bias in the estimate, beyond the errors inherent with the input SMBG data. Using the dynamical eA1c is particularly adapted to sparse data (e.g., where only fasting glucose is available together with occasional seven-point profiles and simple averages are likely to be biased). In this situation, which is common in type 2 diabetes, having an underlying model has clear robustness advantages over a model-free linear procedure, which is heavily influenced by missing data and tends to produce biased results when limited data are available.
To further emphasize this point, we compared the proposed procedure with an established linear model, on the same dataset. Because the data are sparse this linear-regression–type method tends to be less accurate—an expected result when the density of the data is low (e.g., only fasting SMBG every day and occasional pre-/postprandial readings). This finding supports the need for alternative model-based procedures that allow gaps in the data to be “filled in” via modeling of the underlying system dynamics. As evident from our results, even a straightforward first-order model is capable of improving significantly the tracing of average glycemia, compared with established linear procedures.
Our estimation procedure also allows for calibration using laboratory HbA1c reference values in addition to the seven-point SMBG profiles. One important feature of the algorithm is that the computation of eA1c can be calibrated, at any time, with a laboratory HbA1c value. Such a calibration procedure permits accounting for individual differences in the relationship between mean BG and HbA1c for each patient (i.e., for individual rates of hemoglobin glycation). In modeling terms this is achieved by adding a glycation rate coefficient γ to Eq. 1 as follows:
The calibration with laboratory HbA1c adds a layer of precision to HbA1c estimation that is in addition to (or a replacement of) the calibration done via seven-point SMBG profiles. Applied to the test dataset, straightforward calibrations with a single laboratory HbA1c value for each person (one calibration for the duration of the study) yielded a correlation r=0.87 between eA1c and HbA1c, MAD=0.40, and MARD=5.3% (compared with r=0.76, MAD=0.5, and MARD=6.7% achieved with profile calibrations). One can therefore conclude that occasional calibration with laboratory HbA1c would improve the accuracy of the estimation procedure. However, a robust calibration algorithm must be developed, and the optimal time interval between laboratory HbA1c calibrations must be evaluated before such a procedure can be implemented.
Conclusions
A conceptually new, clinically viable procedure has been developed for real-time tracking of average glycemia from self-monitoring data. The average glucose tracing is then converted into running estimates of A1c, which can be presented to the patient daily. This technique allows for simple parameterization of the dynamics of average glycemia and thereby HbA1c, has a robust estimation procedure capable of working on sparse readings of fasting BG and occasional seven-point SMBG profiles, and has an inherent capability for calibration of the algorithm using SMBG profiles and/or reference HbA1c readings.The computational demands of the procedure are low; thus it is readily implementable into devices with limited processing power, such as home SMBG meters. Providing weekly estimates of HbA1c has been shown to increase patient motivation and improve diabetes outcomes 20 ; thus a procedure tracking average glycemia and HbA1c in real time could provide valuable assistance to the daily optimization of diabetes control. It should be emphasized, however, that this procedure is not intended as a substitute for laboratory assessments of HbA1c—it should be viewed as a surrogate measure that allows convenient tracing of average glucose, readily implementable in a point-of-care SMBG device.
Footnotes
Acknowledgments
This study was supported by a grant from Sanofi-Aventis Deutschland GmbH. Editorial support was provided by Tom Claus, PhD, of PPSI (a PAREXEL company) and was funded by Sanofi.
Author Disclosure Statement
B.P.K. has served on the advisory panels of Animas Corp. and Sanofi-Aventis and has received research support from Amylin Pharmaceuticals, Inc., Animas Corp., Dexcom, Inc., Insulet Corp., Sanofi, and Tandem Diabetes Care. M.D.B. has received research support from Animas Corp., Dexcom, Inc., Insulet Corp., Sanofi, and Tandem Diabetes Care. F.F. and J.S. are employees of Sanofi-Aventis Deutschland GmbH.