
Abstract
Background:
This pilot study aimed to verify if glycemic control can be achieved in type 2 diabetes patients after acute myocardial infarction (AMI), using insulin glargine (iGlar) associated with regular insulin (iReg), compared with the standard intensive care unit protocol, which uses continuous insulin intravenous delivery followed by NPH insulin and iReg (St. Care).
Patients and Methods:
Patients (n=20) within 24 h of AMI were randomized to iGlar or St. Care. Therapy was guided exclusively by capillary blood glucose (CBG), but glucometric parameters were also analyzed by blinded continuous glucose monitoring system (CGMS).
Results:
Mean glycemia was 141±39 mg/dL for St. Care and 132±42 mg/dL for iGlar by CBG or 138±35 mg/dL for St. Care and 129±34 mg/dL for iGlar by CGMS. Percentage of time in range (80–180 mg/dL) by CGMS was 73±18% for iGlar and 77±11% for St. Care. No severe hypoglycemia (≤40 mg/dL) was detected by CBG, but CGMS indicated 11 (St. Care) and seven (iGlar) excursions in four subjects from each group, mostly in sulfonylurea users (six of eight patients).
Conclusions:
This pilot study suggests that equivalent glycemic control without increase in severe hyperglycemia may be achieved using iGlar with background iReg. Data outputs were controlled by both CBG and CGMS measurements in a real-life setting to ensure reliability. Based on CGMS measurements, there were significant numbers of glycemic excursions outside of the target range. However, this was not detected by CBG. In addition, the data indicate that previous use of sulfonylurea may be a potential major risk factor for severe hypoglycemia irrespective of the type of insulin treatment.
Background
There is a consensus that hyperglycemia is deleterious for AMI patients, but at what time point the insulin treatment should begin, the most appropriate treatment protocol, and the best target of glycemic control are unsolved clinical issues. 3
The NICE-SUGAR study showed that maintenance of glycemic control between 81 mg/dL and 108 mg/dL did not result in added benefit and that hypoglycemia had an independent negative impact on mortality rates. These data indicated that perhaps targets of glycemic control in AMI should be considered less stringently. 8 The study by Kosiborod et al. 9 showed a U-shaped relationship between average blood glucose during the period of hospitalization and mortality significantly increased for all patients with glycemic level below 70 mg/dL or above 180 mg/dL for those with known diabetes and above 120 mg/dL for patients without diabetes. The reason for this difference is not well understood, but 180 mg/dL seems to be the acceptable threshold to initiate insulin therapy. 3,9 Although the ideal target for glycemic control is not known, data indicate that it should be between 80 mg/dL and 180 mg/dL. 10 The usual protocol consists of continuous insulin intravenous infusion during the first 24–48 h after an AMI event, followed by subcutaneous insulin therapy. 11 However, the task of monitoring the intravenous infusion in order to achieve glycemic targets requires well-designed protocols and continuous attention by well-trained nursing staff. 12
According to other studies, 10,13 continuous intravenous insulin is not an absolute requirement if glucose levels are adequately controlled by other means. Thus, an alternative strategy may be the use of insulin glargine (iGlar), coupled with subcutaneous regular insulin (iReg) to adjust for postprandial hyperglycemia. Because of its pharmacokinetic characteristics, iGlar may advantageously replace intravenous insulin because a single subcutaneous injection translates into uniform action during approximately 24 h for the majority of patients. 14,15 In spite of the great number of studies comparing iGlar and human insulin, no study has been carried out in the clinical setting of AMI.
This exploratory pilot study aimed to verify if glycemic control can be achieved in type 2 diabetes patients during the first 3–4 days after AMI either by administering iGlar associated with iReg or by continuous intravenous insulin delivery followed by NPH and iReg, the standard treatment in our intensive care unit (ICU) setting.
Research Design and Methods
Inclusion criteria
Twenty type 2 diabetes patients (over 40 years of age) diagnosed for AMI according to American Heart Association criteria within 24 h were enrolled if the patient presented, by protocol, a fasting glycemic level in excess of 110 mg/dL or random glycemic levels above 180 mg/dL at the time of admission to the ICU. Patients without previous diagnosis for type 2 diabetes were also included if glucose levels were over 200 mg/dL and glycosylated hemoglobin was 30% above the method limit. However, all 20 patients included were previously diagnosed with type 2 diabetes. Seventeen were receiving insulin (three in each group) or oral antidiabetes drugs (five and six patients, respectively, in each group); three patients (two in the iGlar group) were previously on diet only (Table 1).
Data are mean±SD values (range).
Comparison between weight (P<0.0064) and body mass index (BMI) (P<0.0051).
Continuous glucose monitoring system (CGMS) monitoring during continuous intravenous insulin (Ins) (Phase 1).
CGMS monitoring during NPH (Phase 2).
Comparison between Glargine and Standard Care groups, P=0.0058.
Comparison between Glargine and Standard Care groups, P<0.0001.
AMI, acute myocardial infarction; CBG, capillary blood glucose; ICU, intensive care unit; OAD, oral antidiabetes drugs.
Exclusion criteria
Major exclusion criteria were the onset of AMI more than 24 h ago, congestive heart failure, acute kidney failure, and need of vasoactive drugs to maintain hemodynamic conditions that may interfere with the continuous glucose monitoring system (CGMS) or capillary blood glucose (CBG) readings, any pathology requiring systemic corticosteroid treatment, and need of severe restriction in liquid replacement.
Study design
The study approved by the Institutional Review Board from the institution (SEPACO Hospital) was conducted according to the Helsinki Declaration and Good Clinical Practice-International Conference on Harmonization. Informed consent was obtained from all patients.
This pilot study was open, randomized (1:1), parallel, and controlled. Patients were randomized to one of two arms: (a) standard treatment with a continuous infusion of a solution containing 100 IU of iReg and 500 mL of 5% glucose (final insulin concentration, 0.2 IU/mL) for 24–48 h (continuous intravenous insulin) corresponding to Phase 1, followed by NPH insulin, with iReg administered before meals or to correct hyperglycemia during Phase 2 (St. Care group) or (b) treatment with iGlar with added iReg before meals or to correct hyperglycemic events throughout the whole study (iGlar group). For comparison, we considered, for this group, Phase 1 as the first 48 h. Characteristics of the study population are shown in Table 1. Insulin use algorithm was DeGold for iGlar,
16
and the ICU protocol for St. Care is available at
Insulin therapy was guided exclusively by CBG measurements using a calibrated Accu-Chek® Active (Roche Diagnostics GmbH, Mannheim, Germany) glucometer; measurements were repeated every hour during the first 6 h, further performed before and 2 h after each meal (standard diet for diabetes in the ICU, with 50% of caloric intake from carbohydrates), and finally before sleep time (seven points in total). In cases where the glycemic level was unstable or hypoglycemia was present, measurements were repeated at 15-min intervals until stability was achieved. Of note is that iReg doses in the iGlar group were lower than in the St. Care group because in the first 48 h, the latter used only iReg. However, mean total insulin required was comparable in the two groups of patients (Table 1). Table 1 also shows that a significantly increased number of CBG measurements, obtained in shorter intervals, were needed in order to adjust insulin infusion in the St. Care group compared with the iGlar group.
After a stabilizing period, blinded CGMS® System Gold™ sensors (Medtronic, Northridge, CA) were introduced (see flowchart in Fig. 1). CGMS was calibrated by means of four different CBG measurements every day. However, CGMS data were downloaded only after patients were discharged at the end of the trial and blinded to patient treatment. A third party formatted the data as a continuous recording instead of in the usual 24-h form, and the parameters were calculated by a program specifically created for this study, which permitted the analysis of the following glucometric parameters: mean and SD of glucose levels, glycemic median and range, exposure to hyperglycemia equivalent to the area under the curve (AUC) >140 mg/dL and >180 mg/dL normalized by time (hyperglycemia index, calculated as MeanExp Hyper=Σ Area Sup /T Total), percentage of time (Percentage of Time Hyper=Σ Time Sup /T Total) presenting glycemia>110 mg/dL, 140 mg/dL, or 180 mg/dL (stringent, moderate, and loose targets), and the proportion of time out of target (<70 mg/dL or >140 mg/dL and <80 mg/dL or >180 mg/dL). Parameters calculated to assess variability were the daily hyperglycemic excursion rate to levels >140 mg/dL and >180 mg/dL and the mean amplitude of glycemia excursions as previously described. 17 Safety analyses included exposure to hypoglycemia (AUC<70 mg/dL and <56 mg/dL normalized by time, MeanExp Hypo =Σ Area Inf /T Total), daily rate of hypoglycemic excursions, and percentage of time when glucose levels were either<70 mg/dL or <56 mg/dL. Because of detection limit by CGMS, the number of excursions and percentage of time in hypoglycemia≤40 mg/dL were calculated manually. 18 All CGMS-based values, with the exception of mean amplitude of glycemia excursions, were compared with those obtained by CBG used for treatment of the patients. Patients in both groups remained for an equivalent time under CGMS, with blood glucose levels recorded every 5 min for at least 85% of the time for each individual patient.
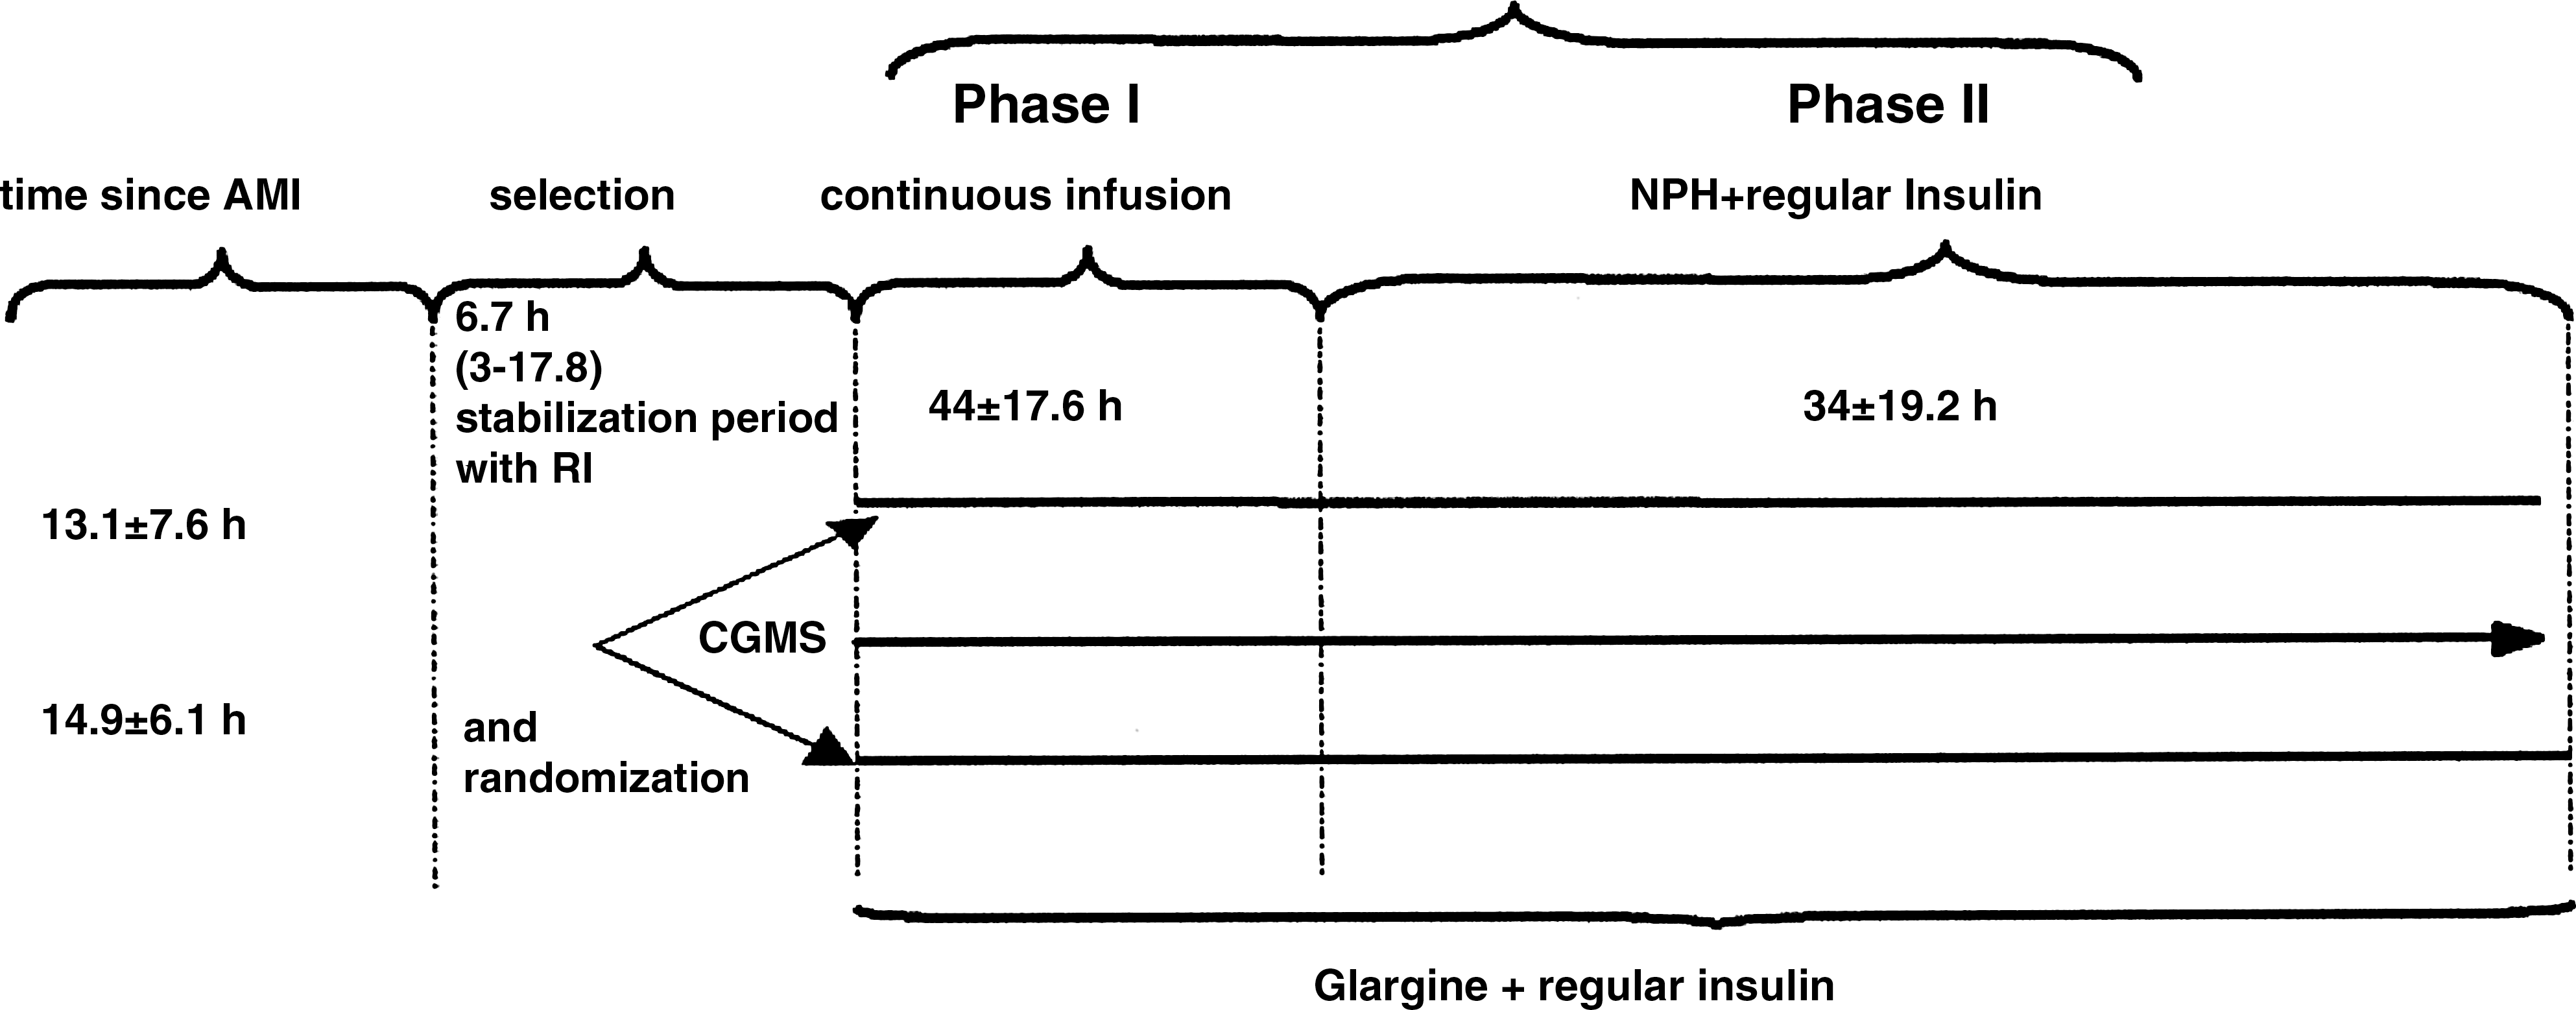
Study design and procedure flowchart. CGMS, continuous glucose monitoring system; RI, regular insulin.
Of the 10 patients randomized to St. Care, one remained under continuous intravenous insulin continuously (Phase 1) for 85 h because of revascularization surgery indication. With one exception, a patient not needing iReg, all patients in the iGlar group received the proposed treatment.
CGMS data were analyzed considering the total study period (St. Care vs. iGlar), and the comparison between continuous intravenous insulin and iGlar (Phase 1), as well as the following period when patients were treated with NPH insulin or iGlar associated with iReg (Phase 2). Medians of glucometric parameters in both treatment arms were compared using Kruskal–Wallis and Mann–Whitney statistics. Comparison of results obtained by CBG versus CGMS was also done using Wilcoxon statistics. The t test was used to test population homogeneity. Fisher's exact test was used to explore the association between hypoglycemic events and previous treatment with sulfonylurea. GraphPad (San Diego, CA) InStat 3 was used in all instances. As this was an exploratory pilot study, an estimate of sample size was not advised.
Results
Analysis done by either CGMS or CBG measurements, of Phase 1 (first 48 h) and Phase 2 separately or when considering the whole study treatment periods, showed that both the median and the mean blood glucose levels and the proportion of time in and out of target were comparable between treatment groups (Table 2). Furthermore, most glucometric parameters were comparable between the two treatment groups.
The whole study period compared insulin glargine (iGlar) versus standard of care (Standard Care), Phase 1 compared iGlar versus continuous intravenous insulin (CII), and Phase 2 compared iGlar versus NPH insulin.
Continuous glucose monitoring system (CGMS) versus capillary blood glucose (CBG): a P<0.03, b P<0.02, c P<0.001.
Hyperglycemia index calculated as MeanExp Hyper=Σ Area Sup/T Total.
MAGE, mean amplitude of glycemic excursions.
A significant difference in the frequency of glycemic excursions out of target were seen on comparison between data obtained with CBG and CGMS, suggesting that significant numbers of blood glucose excursions remain undetected even when CBG is performed frequently (Table 2).
Hyperglycemia episodes
Regarding the proportion of time in hyperglycemia above 140 or 180 mg/dL, CGMS data obtained during continuous intravenous insulin treatment (Phase 1) were similar to those observed with iGlar. On the other hand, when the same data were compared during Phase 2 (iGlar+iReg vs. iReg+NPH), proportions of time in hyperglycemia showed a decrease in the iGlar group, although without reaching statistical significance, probably because of the wide dispersion of data and the small sample size (Table 2).
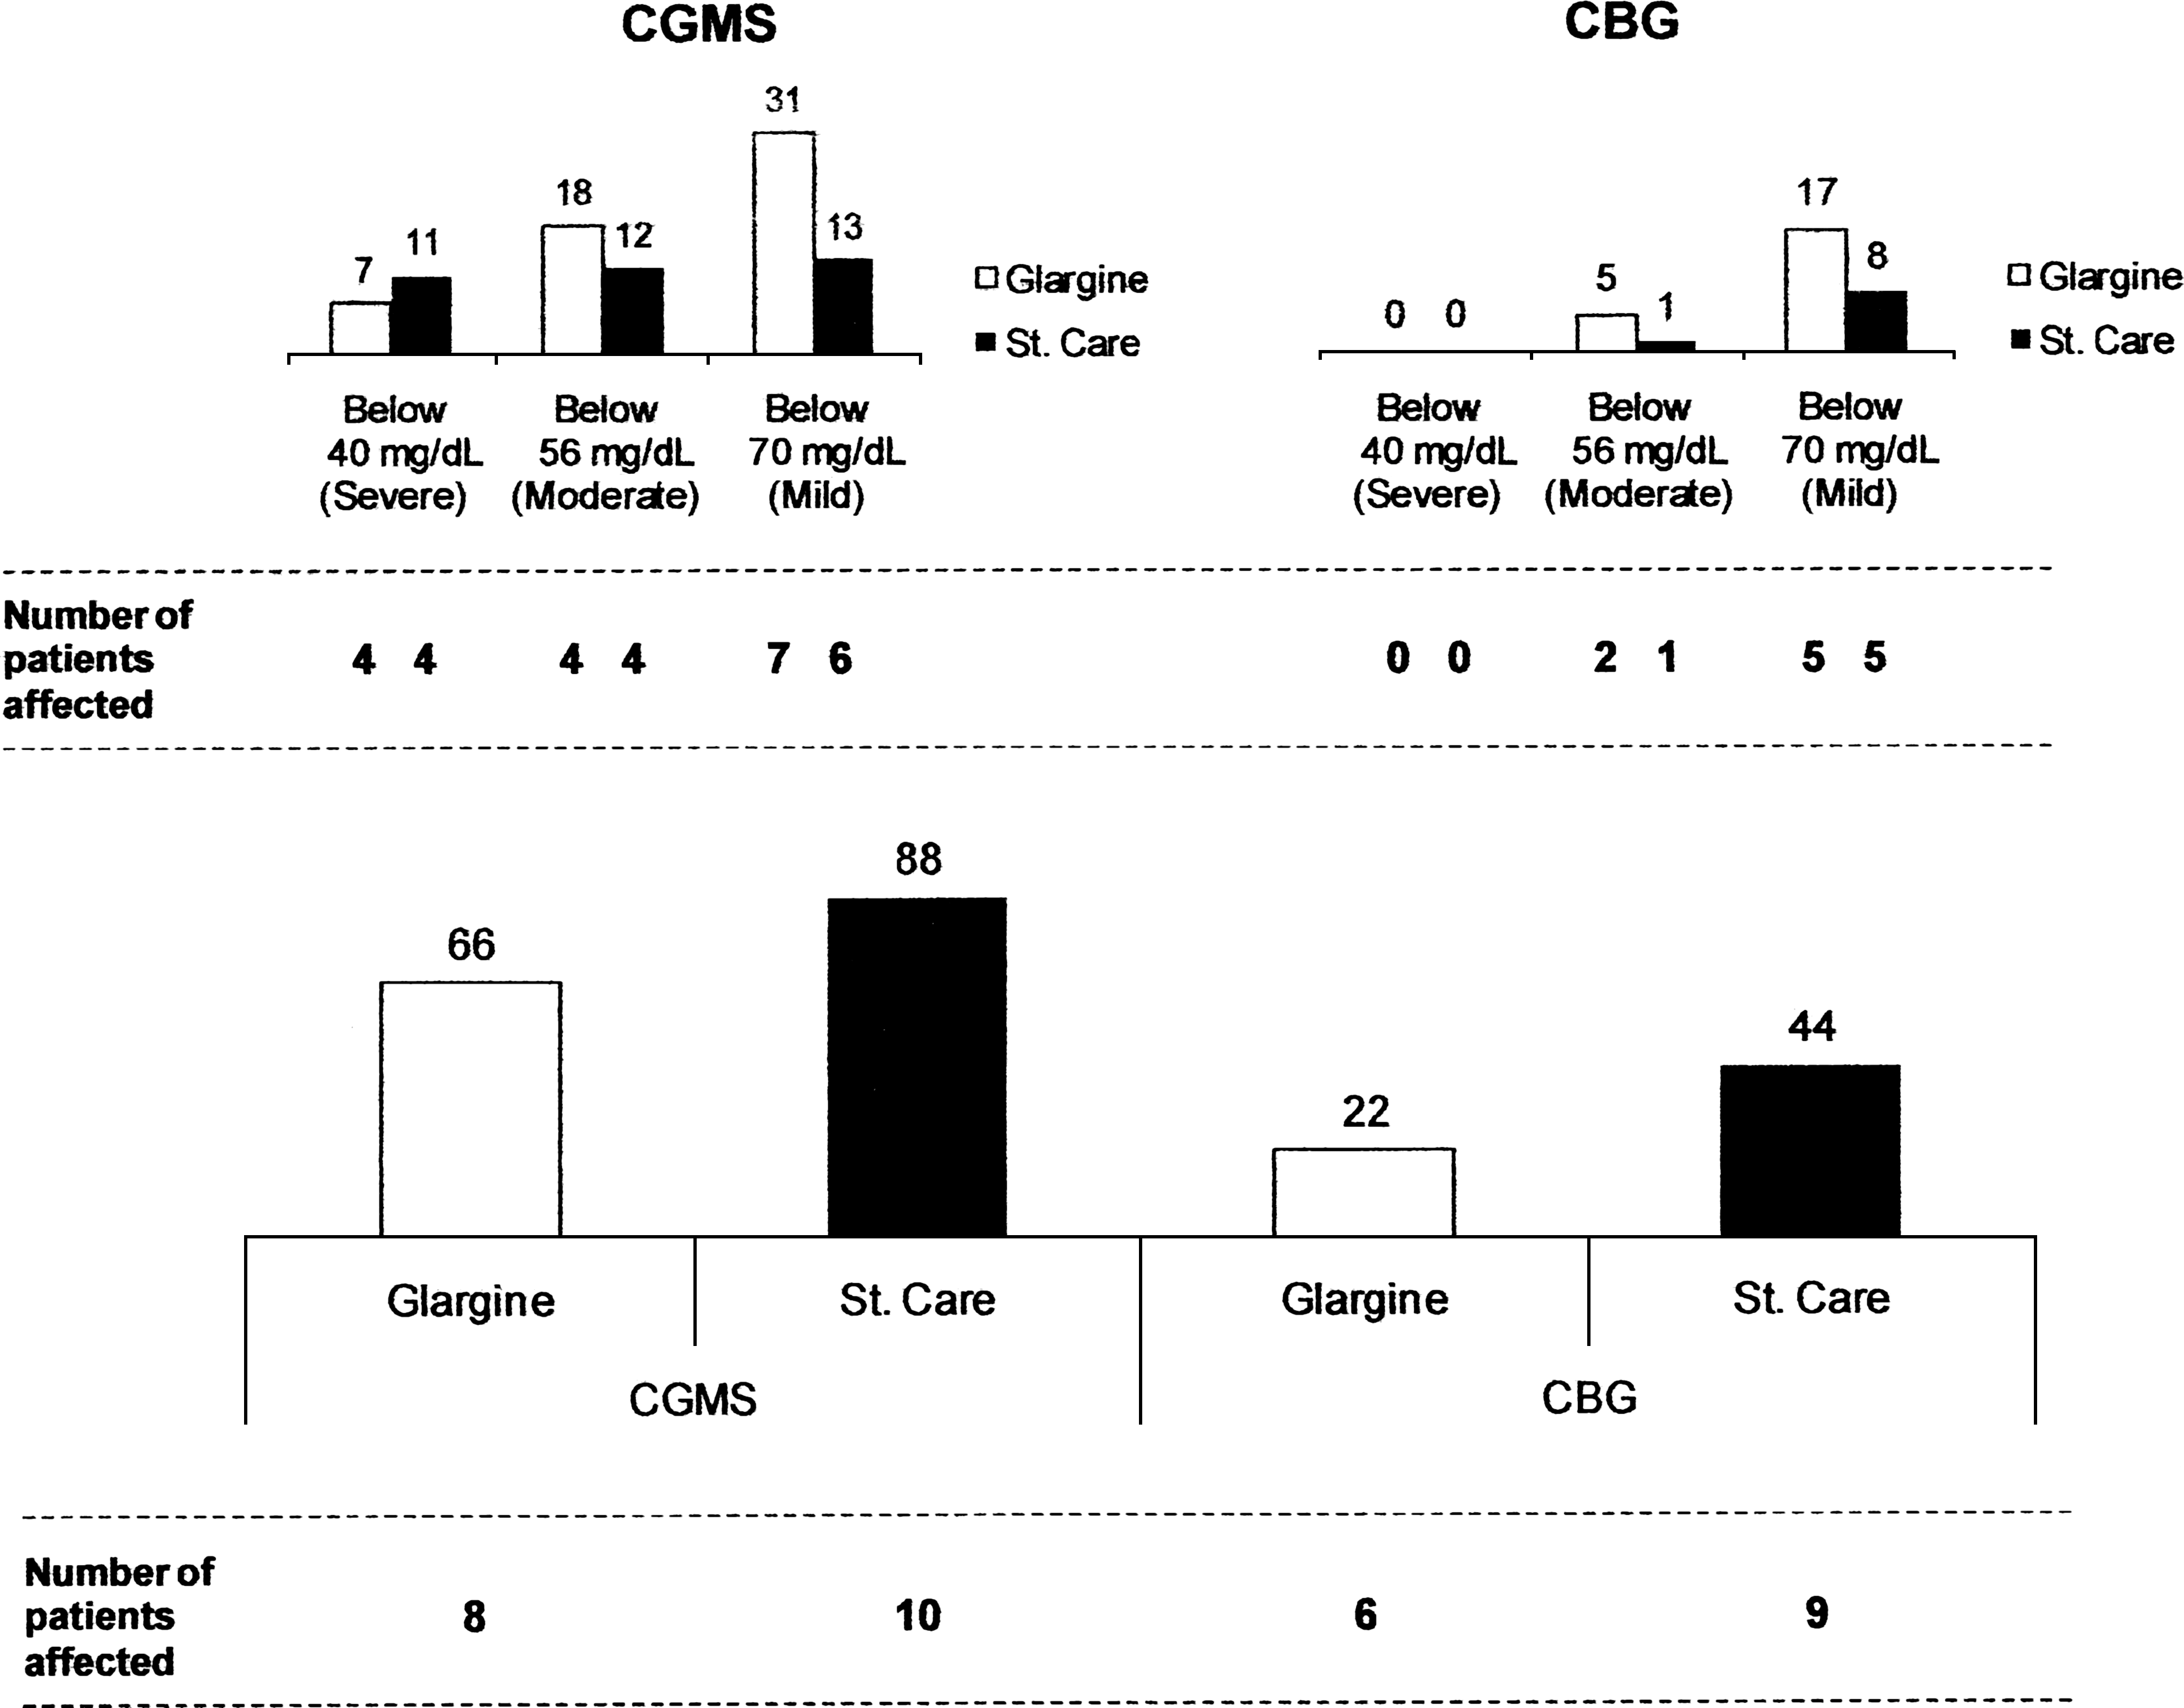
At least one episode of hyperglycemia ≥180 mg/dL occurred in all 10 patients in the St. Care group and eight of 10 patients in the iGlar group, throughout the whole study. Detailed analysis of CBG data permitted the detection of 22 peaks in the iGlar group and 44 peaks in the St. Care group (no significant difference), whereas CGMS recorded 66 and 88 peaks, respectively (no significant difference). Nonetheless, there was a significant difference (P<0.05) between the two measuring techniques (Fig. 2).
Number of (
Hypoglycemia episodes
The number of fingerpricks per patient for CBG analysis varied from 20 to 75 in a 4-day period and detected hypoglycemia events in five patients from each group. In iGlar-treated patients 17 mild (between 70 and 56 mg/dL) and five moderate (between 56 and 40 mg/dL) episodes and in the St. Care group eight mild and one moderate event were recorded by CBG. Although not significantly different between treatment arms, the numbers of mild and moderate episodes were also increased in the CGMS analysis compared with CBG in both the iGlar (62 in seven of 10 patients) and St. Care (39 in six of 10 patients) groups (P<0.007).
Severe hypoglycemic events were detected by CGMS but not by CBG. The CGMS data revealed a total of seven (iGlar) and 11 (St. Care) hypoglycemia events reaching levels below or equal to the minimum detection threshold of 40 mg/dL, in four patients in each group (Fig. 2). The hypoglycemic data are shown in Table 3.
The hypoglycemia index was calculated as MeanExp Hypo=Σ Area Sup/T Total.
The majority of severe hypoglycemia events (74%) occurred during the first 48 h after treatment onset (data not shown). Analysis of the patients presenting moderate/severe hypoglycemic events showed six of eight patients were receiving long-acting sulfonylurea, in contrast to three of 12 patients without hypoglycemia (Fisher's exact test, P=0.0648).
Discussion
Persistent hyperglycemia occurring in any time during hospitalization due to AMI is a predictor of mortality. 10 Both time to initiate insulin therapy and goals of control have been the subject of controversy. Targets initially recommended (blood glucose<110 mg/dL) were based on the results obtained in the surgical ICU and have been challenged by recent studies that failed to demonstrate the benefit of tight glucose control. 3,8 –10 Protocols recommended intravenous insulin infusion in the first 24–48 h after AMI followed by transition to a scheme using subcutaneous insulin. 11,12,19 The handling of intravenous insulin infusion requires proper equipment, the use of structured algorithms for correction, and well-trained staff. 12,19 The pharmacokinetic profile of iGlar can mimic a continuous insulin infusion, rendering it a potential substitute for use in the ICU. However, there are limitations that could preclude the use of iGlar, such as a lower flexibility to quick dosage adjustment and a lag period of several days required to achieve steady state in a clinical setting in which acute changes in insulin sensitivity may occur. 20 In addition, there is a possibility that more prolonged hypoglycemic events may occur when compared with intravenous insulin. 14
For these reasons we decided to conduct an exploratory pilot study to compare the glycemic control achieved with standard care with that obtained with the use of iGlar combined with the use of iReg, in the setting of AMI, which to the best of our knowledge has never been done.
Glycemic control parameters obtained by CBG and by CGMS were comparable, indicating that the treatment algorithms—iGlar or St. Care—were able to attain the recommended targets of glycemic control (between 80 and 180 mg/dL). These results indicate that iGlar may be considered from treatment onset without deterioration of glycemic control and justifies an extended multicenter clinical trial to confirm these observations.
A nonstatistical difference in the frequency of glycemic excursions outside of target range was seen upon comparison of data obtained with CBG and CGMS. The number of events recorded by CGMS was increased, notably in hypoglycemia excursions. If CGMS were not included in this study, severe hypoglycemia would not even have been detected and reported. The analysis of CGMS data revealed a total of seven and 11 hypoglycemia events reaching levels below the minimum detection value of 40 mg/dL in four patients each in the iGlar and St. Care groups, respectively. These events were undetected by CBG despite frequent monitoring.
Even though we expected CGMS to capture more events (hypo- and hyperglycemia) than CBG, 14,21 the lack of detection of severe hypoglycemia by CBG was a surprising observation. To try to understand the lack of correspondence between the two detection methods, we re-analyzed the periods recorded as severe hypoglycemia by CGMS. Of 18 episodes, six were confirmed by CBG classified as moderate hypoglycemia, and two were not confirmed. This discrepancy may occur because the accuracy of the CGMS sensor in hypoglycemic conditions is lower. 22 This issue could be addressed with the newer CGMS sensors, which exhibit improved sensitivity.
In the remaining episodes, hypoglycemic events occurred between fingerpricks and were asymptomatic. Studies comparing hypoglycemic episodes identified by CGMS but undetected by CBG despite frequent fingerpricks have never been carried out in this clinical setting. Although occurring more often than expected, hypoglycemic events might represent fluctuations of little or no consequence to the patient or be an underlying factor with a clinical impact on mortality 23 –25 or worsening of the patient's conditions. 26 This controversy is highlighted by studies showing a differential role of spontaneously occurring compared with exogenous insulin-induced hypoglycemic events on patient mortality. 27 Detailed analysis of these patients suggested that severe hypoglycemia was associated not with the treatment allocation but with previous treatment with sulfonylurea (six of eight patients). As the patients included in this pilot study were all enrolled less than 24 h after AMI and because the majority of hypoglycemic excursions occurred in the beginning of the study, a residual effect of sulfonylurea added to the effect of the insulin therapy cannot be ruled out. We feel that this fact will have to be taken into account when calculating the speed of the initial insulin infusion as well as when deciding on the initial dose of iGlar, including a downgrade of the initial insulin dose when patients report taking sulfonylureas. The high prevalence of sulfonylurea use in the diabetes population prone to cardiovascular disease indicates still further attention should be devoted to this incidental observation disclosed during our pilot study. 23
The small sample size is a characteristic of the pilot exploratory studies and is undoubtedly one of the limitations of this study, limiting the value of the statistical findings. Nevertheless, the data obtained were controlled both by CBG and CGMS. Besides, clinical care was dispensed in a real-life setting, which improves reliability and encourages the expansion of this study to confirm that glycemic control can be achieved with a simple scheme consisting of a single daily injection of iGlar added to iReg replacement guided by a structured algorithm.
Conclusions
The pilot study presented here suggests that an equivalent glycemic control may be achieved with the use of iGlar associated with iReg instead of the standard care intravenous insulin infusion followed by NPH associated with iReg, which is the prevailing standard treatment for hyperglycemia in type 2 diabetes patients after an AMI event. CGMS monitoring revealed that significant numbers of hyperglycemic peaks and hypoglycemic episodes remain undetected despite frequent capillary glycemia measurements. Finally, data indicate that previous use of sulfonylurea may be a risk factor for severe hypoglycemia irrespective of the type of insulin treatment.
Footnotes
Acknowledgments
We thank Ana Maria Truzzi of Sanofi-Aventis for assistance in statistical planning, Prof. Maria Regina Cardoso Alves of the Faculdade de Saúde Pública, Universidade de São Paulo, for statistical analysis, and Dr. Linnus Pauling Fascina, head of the SEPACO hospital, and his staff for their unconditional support in carrying out this study. Medtronic, Brazil, provided CGMS equipment and individual sensors. Sanofi-Aventis, Brazil, supported this study proposed by the investigators, paying for medication and monitoring costs, statistical analysis, and hiring of a logistics firm that created the software program for glucometric analysis of CGMS-based data. We also thank Anna Carla Goldberg, Ph.D., Experimental Research Coordinator at the Instituto Israelita de Ensino e Pesquisa Albert Einstein for help in the elaboration and critical analysis of the article.
Author Disclosure Statement
C.R.S. is an investigator in multicenter trials sponsored by Sanofi-Aventis. D.R.F. is a subinvestigator in multicentric Phase 3 and 4 trials sponsored by Sanofi-Aventis and also has received conference fees from Sanofi-Aventis. F.G.E. is an investigator in multicenter trials and a member of the consulting medical board and has received conference fees, all sponsored by Sanofi-Aventis. D.J.G. is an employee of Verax S/C Ltda. J.B. declares no competing financial interests exist.