
Abstract
Background:
We evaluated intensive intervention in poorly controlled patients with type 2 diabetes mellitus involving weekly clinic visits and adjustment of therapy with analysis of three seven-point glucose profiles and intervention from an interdisciplinary staff.
Methods:
Sixty-three patients were randomized to an intensive treatment group that obtained self-monitoring of blood glucose (SMBG) profiles (six or seven values per day, 3 days/week) and were seen in the clinic at Weeks 1–6 and 12. SMBG results were downloaded, analyzed using Accu-Chek® 360° software (Roche Diagnostics, Indianapolis, IN), and used to adjust therapy. Control group subjects obtained glucose profiles and had clinic visits only at Weeks 0, 6, and 12.
Results:
There were highly statistically significant improvements in the intensive treatment group compared with the control group between Weeks 0 and 6 with greater reductions in weekly mean glycemia (WMG) (−76.7±8.9 mg/dL vs. −20.5±8.1 mg/dL), glycemic variability (SD) (−16.3±3.1 mg/dL vs. −5.0±3.1 mg/dL), and glycated hemoglobin (−1.82±0.16% vs. −0.66±0.22%) without significant changes in frequency of hypoglycemia or weight. Improvements were sustained in the intensive treatment group through Week 12. A minimal but statistically significant degree of improvement was seen in the control group at Week 12.
Conclusions:
This short-term pilot study of an intensive monitoring, educational, and pharmacological interventions program resulted in dramatic improvement of glycemic control within 6 weeks, and these effects are sustained through Week 12. SMBG glucose profiles, calculation of WMG and SD, and graphical displays of glucose data can improve the effectiveness of adjustment of therapy at weekly clinic visits when combined with intensive support from a multidisciplinary team.
Introduction
Currently, glycemic control is almost universally assessed using the A1C, the gold standard for monitoring glycemic control that serves as a surrogate marker for risk of future diabetes-related complications. Self-monitoring of blood glucose (SMBG) represents an important adjunct to A1C because it can distinguish among fasting, preprandial, and postprandial hyperglycemia, assessing glycemic excursions, and documenting hypoglycemic episodes. 5 When used properly, SMBG gives an acceptably accurate reflection of immediate and short-term glucose levels and can improve glycemia. 6 Fructosamine and other markers have also been used to measure glycemic values in the previous 2–3 weeks rather than the previous 3 months. 7 Numerous studies have shown a high correlation of A1C and mean glucose as measured by SMBG, continuous glucose monitoring, or frequent venous sampling. 8 –11
Patients with T2DM are typically followed up by their physicians at 3-month intervals. 12,13 This approach appears to be based on the need to minimize costs and convenience and the fact that A1C is a measure of average blood glucose for the previous 3 months.
Fluctuating glucose levels can be more deleterious to endothelial function and generate more oxidative stress than mean glucose in normal subjects and in patients with T2DM. 14 In patients in type 1 diabetes mellitus, A1C variability was predictive not only of the incidence of microalbuminuria and progression of renal disease, but also the incidence of cardiovascular events. 15
We sought to test the hypothesis that more frequent adjustment of therapy, combined with a multifactorial interdisciplinary approach, could result in more rapid improvement in glycemic control. Because the A1C value is relatively useless as a marker of changes from week to week, we elected to use the mean blood glucose calculated from 18–21 glucose values obtained weekly, using a six- or seven-point glucose profile obtained on three consecutive days each week, obtained on the same days of the week. Furthermore, we used computer analysis of the SMBG data to provide the “ambulatory glucose profile” (AGP) 16 and monitored glycemic variability assessed as the SD of these same SMBG glucose values. We combined this intensified SMBG structure monitoring involving diabetes education, diet, exercise, and psychological support.
The concepts of “AGP,” “standard day,” or “modal day” 16,17 provide information to the clinician regarding the timing of hyper- and hypoglycemia and the relationship to meals, exercise, and medications, and this can provide more information than the A1C. The average glycemic profile can be obtained within a matter of a few days. Thus, in principle, the physician should be able to make adjustments in therapy on a weekly basis rather than a quarterly timescale. This is analogous to the rapid titration and self-adjustment of insulin dosages.
We first performed a non-randomized pilot study involving 150 patients over a period of 2 years to develop a systematic approach to implementation of therapy involving weekly clinic visits. 18 This involved informal testing of approaches to a multidisciplinary strategy involving frequent changes in therapy combined with diabetes education for the patient. Results of that preliminary study were used to design the present study, which have been presented in part elsewhere. 19
Research Design and Methods
The present study was designed as a proof-of-concept, randomized, controlled study. The protocol was approved by the Clinical Research Ethics Committee of the Federal University of São Paulo, São Paulo, Brazil. Sixty-seven patients with T2DM being followed up in the outpatient diabetes clinic at our institution were recruited with the following two principal inclusion criteria: 35–75 years old and poor glycemic control (A1C≥8.0%). Three patients were excluded because of noncompliance, and one patient failed to complete the study. Thirty two patients were randomized to the intensive treatment group, and 31 were assigned to the control group. Subject characteristics for the two groups are shown in Table 1.
Data are mean±SEM values.
One patient in this group was morbidly obese (baseline weight, 184.1 kg).
A1C, glycated hemoglobin; BMI, body mass index.
At the initial visit (baseline=Week 0), following an informed consent procedure, patients provided written, witnessed informed consent and were introduced to the interdisciplinary team. Patients in the intensive therapy group were requested to attend clinic on a weekly basis for 6 weeks with a follow-up visit at 12 weeks. During these visits the patients received evaluation of glycemic control, adjustment of pharmacotherapy, and a total of 10 h of education and training by a multidisciplinary diabetes care team (physicians, nurses, nutritionists, psychologist, and physical therapists) over the seven visits from Week 0 through Week 6. Patients in the control group had follow-up visits at Weeks 6 and 12 and received only 2 h of education regarding diabetes, nutrition, and exercise at Week 0.
Adjustment of pharmacotherapy was done on a weekly basis by one physician for Weeks 0–6 for subjects in the intensive treatment group and by a different physician at Weeks 0 and 6 for subjects in the control group. Patients in both groups were treated with diet and mono-, dual-, or triple-therapy regimens involving metformin, sulfonylureas, a glinide, a thiazolidinedione, and/or insulin, at the physician's discretion, based on analysis of their glycemic profile, weekly mean glycemia (WMG), and glycemic variability. No predefined treatment schedule or protocol was used because pharmacological therapy was always individualized according to each patient's clinical condition and laboratory values.
All subjects were provided with a blood glucose meter (Accu-Chek® Performa, Roche Diagnostics, Indianapolis, IN) and glucose monitoring strips for the study period. Patients were trained in the use of meter. In the intensive treatment group, patients were asked to perform a six- or seven-point glucose profile for three consecutive days on eight occasions: Weeks 0–6 and Week 12. Subjects in the control group were requested to do so on three occasions: Weeks 0, 6, and 12. Patients in the intensive treatment group were requested to return to the clinic for weekly visits through Week 6 for medical evaluation, adjustment of therapy, and educational interventions and again in Week 12 for evaluation and discharge from the study. Patients in the control group were seen at Weeks 0, 6, and 12. Diabetes education was provided at Week 0; adjustment of therapy was done at Week 0 and Week 6. Download of meter glucose data was performed only at Weeks 0, 6, and 12 in this group, but these data were not made available to the clinician treating the control group patient until Week 12.
In the intensive treatment group, the patient would typically meet with the entire multidisciplinary team, involving the physician, diabetes nurse, diabetes educator, nutritionist, and exercise trainer, for approximately 15 min. The downloaded SMBG data, WMG, SD, and AGP would be reviewed, and the current problems or issues would be identified. The patient would then meet with individual members of the team, as appropriate, to address particular problems. Finally, the patient would meet once again with the physician and have his or her medication adjusted. In addition to the intervention with the patient, this format was selected so as to provide training to the entire diabetes care team.
At each visit, all patients in both groups were systematically asked whether or not they had experienced clinical symptoms of hypoglycemia. Some patients reported symptoms suggestive of hypoglycemia associated with normal or elevated blood glucose values shortly after treatment was initiated.
Statistical analysis
The principal hypothesis we examined was whether the intensive treatment group showed greater improvement than the control group. Accordingly, we used one-sided comparisons for comparison between the two groups.
Data for WMG, SD, A1C, and body weight were plotted versus time (Weeks 0–12) for each subject individually, and the mean and SEM at each time point were displayed. We then examined the difference from baseline values for each of these parameters at any specified time point (Weeks 1–12).
We assessed the percentage of patients who achieved “good control” using composite criteria of WMG of ≤150 mg/dL and an SD of ≤50 mg/dL at any time during the 12-week study and compared the intensive treatment and control groups using a
Hypoglycemia in each group was expressed in terms of numbers of events with glucose below 60 mg/dL observed during the 12-week study period. We performed a χ2 test to assess the null hypothesis. The percentage of patients experiencing one or more hypoglycemic reactions was calculated, and a z test for proportions was used to compare the intensive treatment and control groups.
Results
Figure 1 summarizes the results for all subjects in both the intensive treatment and control groups. Changes in WMG, SD, A1C, and weight from baseline to Week 12 are shown for both groups. There were large and statistically significant changes in WMG, SD, and A1C (Fig. 1A–C). Changes in WMG, SD, and A1C occurred much more dramatically and much more rapidly in the intensive treatment group than in the control group. However, there were also slow but consistent changes in the control group by 12 weeks, by which time the improvements in WMG and SD were roughly comparable to those for the intensive treatment group at 1 week, whereas the changes in A1C were roughly comparable to those at 4 weeks in the intensive treatment group. The difference between the intensive treatment and control groups and its level of statistical significance were maximal at 6 weeks: WMG increased between Week 6 and Week 12 for the intensive treatment group, whereas the WMG for the control group continued to fall. Figure 1E shows the percentage of subjects achieving good control as defined by the criteria WMG ≤150 mg/dL and SD ≤50 mg/dL. The difference between the two groups is statistically significant (P<0.05). Figure 1F shows that the change in WMG at 6 weeks is dependent on the baseline WMG for both the intensive therapy and control groups. The regression lines for the two groups are highly statistically significant (P<0.001). For a baseline WMG of 150 mg/dL, no further improvement is predicted (Fig. 1). In contrast, there were no significant changes in weight for either group (Fig. 1D).
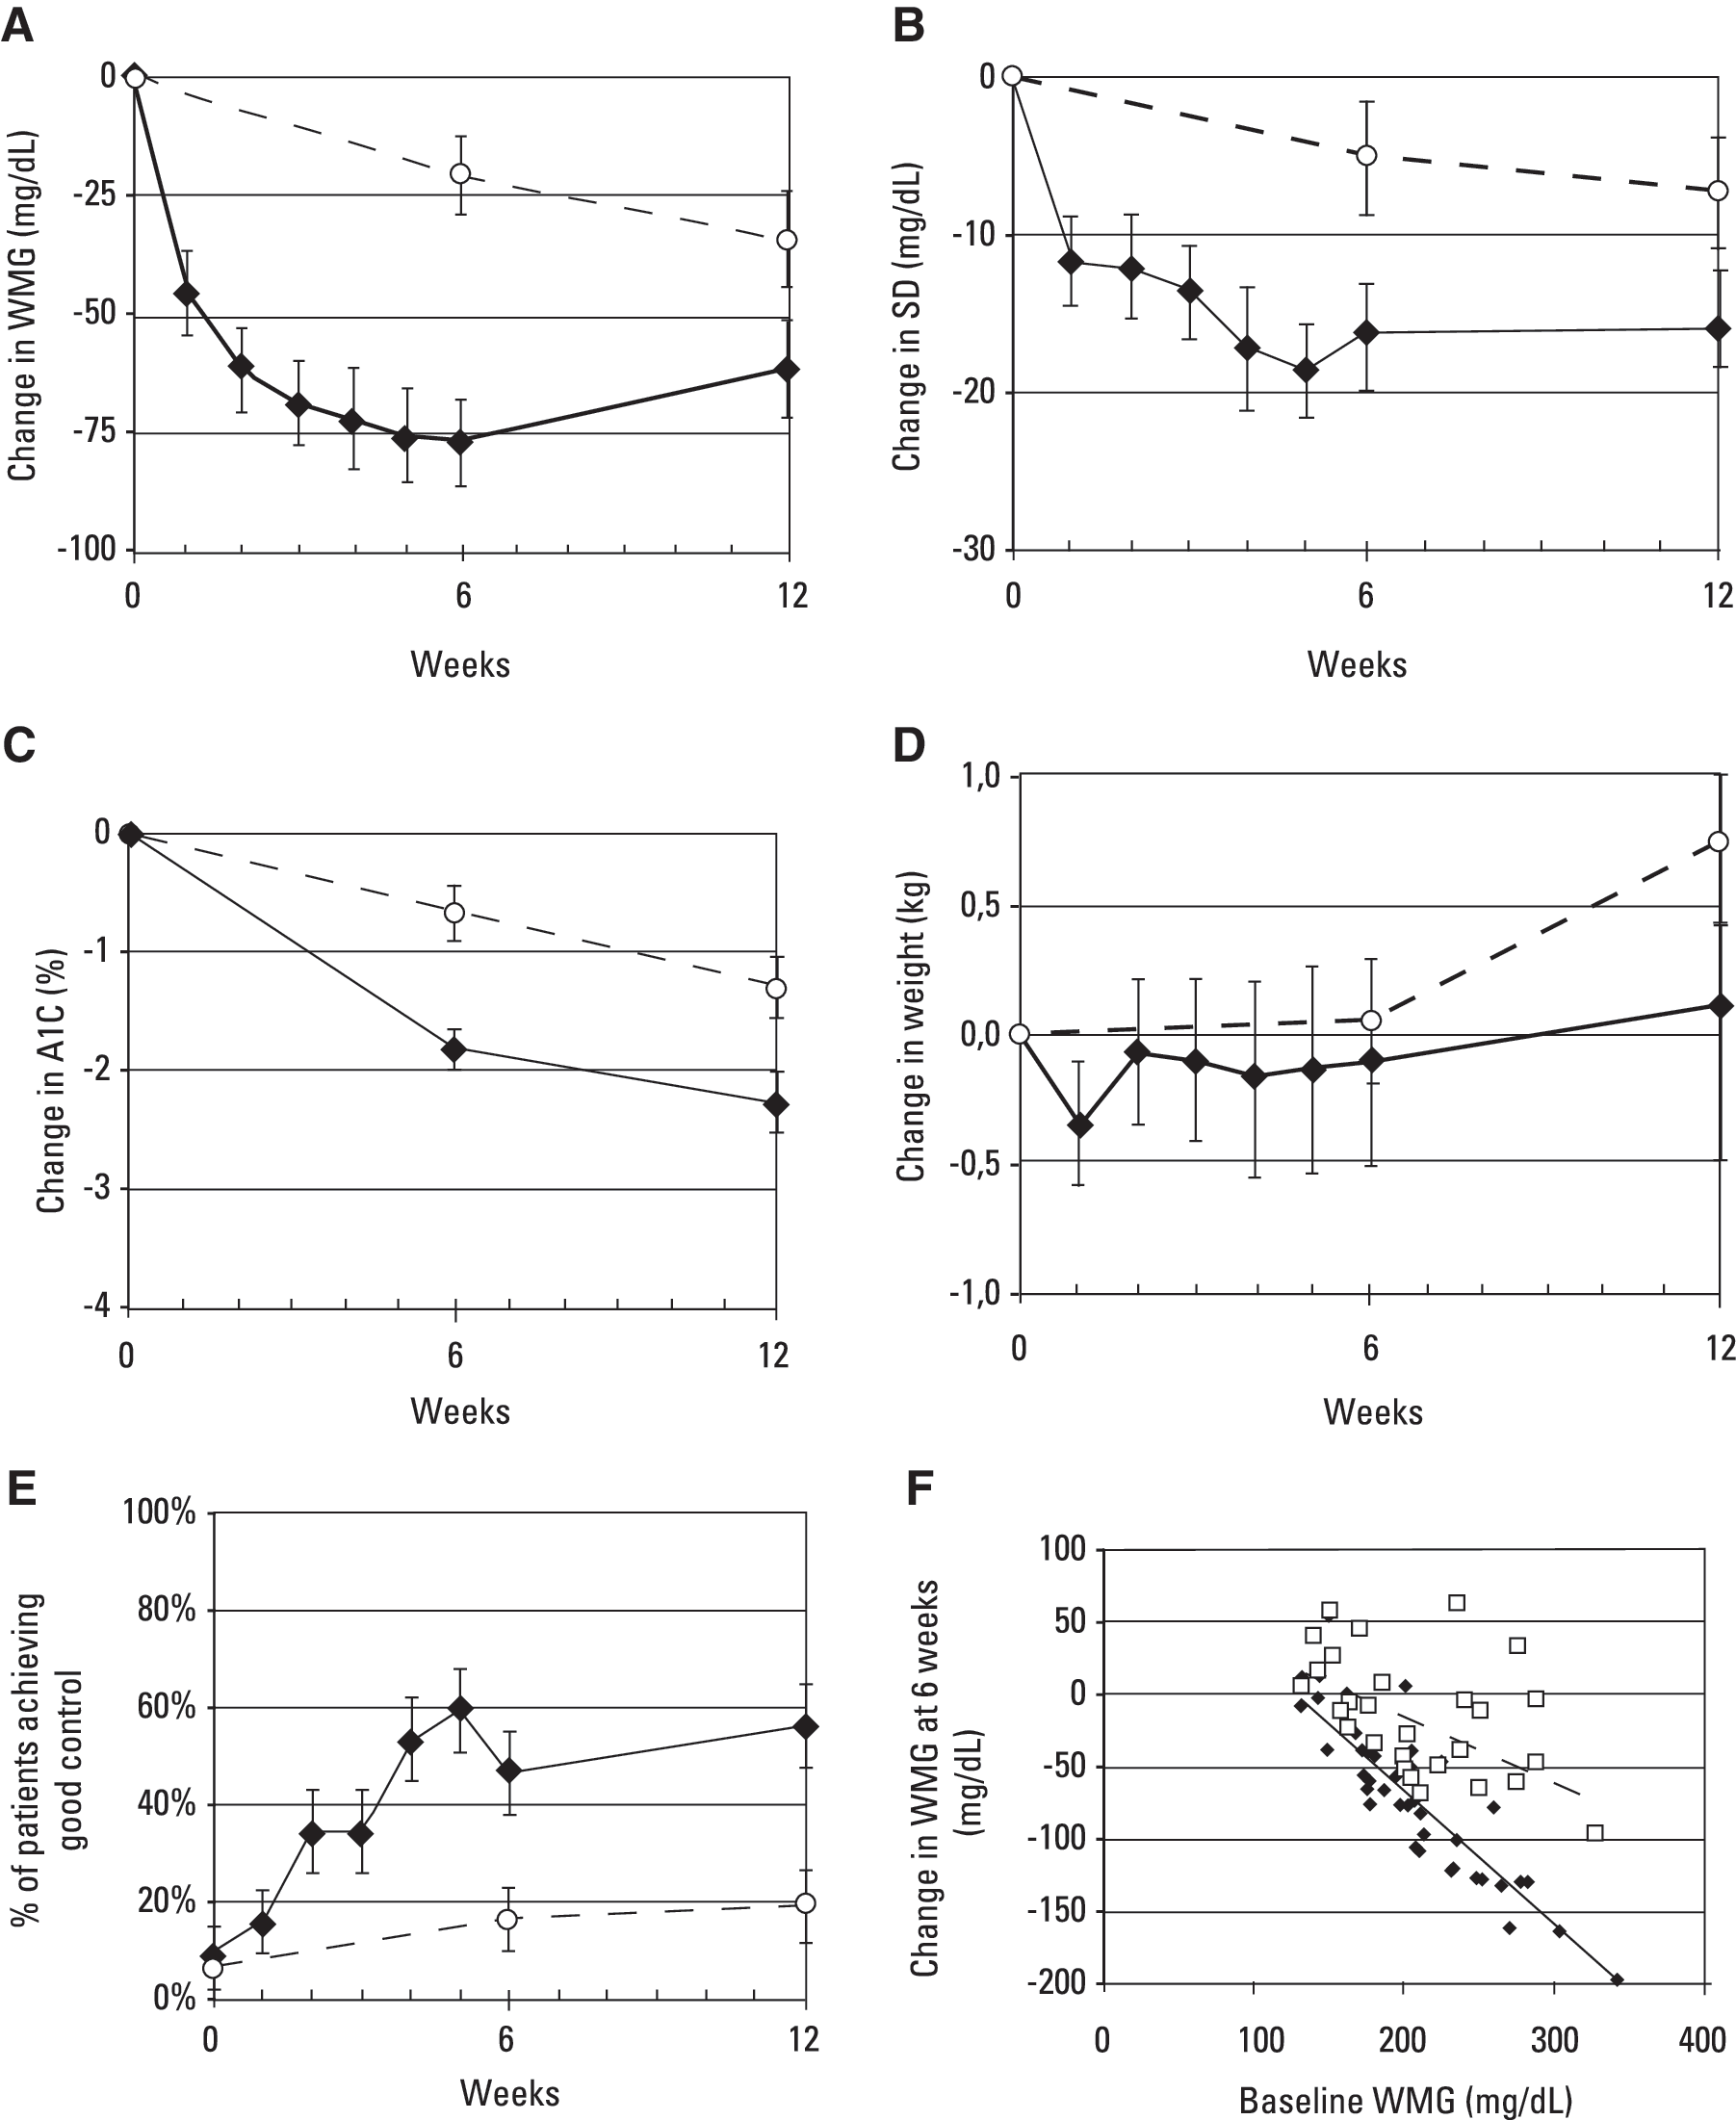
Changes (±1 SEM) from baseline values for (
The changes observed in WMG, SD, and A1C for the intensive treatment group were statistically significantly larger than the very modest degree of improvement in the control group. The numerical values and P values are shown in Table 2. It is interesting that the level of statistical significance for the change in A1C was greater (i.e., with a smaller P value) than for WMG.
Data are mean±1 SEM for baseline values and changes between baseline and Week 12 in weekly mean glycemia (WMG), glycemic variability as SD, glycated hemoglobin (A1C), weight, and percentage of subjects in good glycemic control.
P<0.05, ** P<0.01, *** P<0.001, ****** P<1×10⁻⁶.
NS, not significant (P>0.05).
Table 2 also shows the percentage of subjects achieving “good control” defined as WMG ≤150 mg/dL and SD ≤50 mg/dL, indicating that both the mean level and glycemic variability were well controlled. The percentage of subjects achieving “good control” by these dual criteria was statistically significantly greater in the intensive treatment group at 6 and 12 weeks (46.9% and 56.3%) than in the control group at the corresponding time points (16.1% and 19.4%) (P<0.01 at both 6 and 12 weeks).
Hypoglycemia
The frequency of hypoglycemic events (% of glucose values ≤60 mg/dL) was slightly increased in the intensive treatment group (4.11±0.96%) compared with the control group (2.24±0.64%), but this difference was not statistically significant (P>0.05). There were no reports of severe hypoglycemia in either group.
Discussion
Use of AGPs 3 days per week combined with weekly clinic visits with the physician and a multidisciplinary team, using weekly downloads of memory glucose meters, display of data, and calculation of WMG and glycemic variability (SD), was demonstrated to dramatically improve glycemic control within a matter of a few weeks (Fig. 1 and Table 2). This finding potentially has major implications with respect to the current prevailing practice of scheduling patient–physician encounters at 3–6-month intervals. The present study suggests that it may be possible to reduce the customary long delays in achieving satisfactory glycemic control due to “clinical inertia” and multiple other factors.
Subjects in the intensive treatment group showed a highly statistically significant and clinically important improvement in WMG, SD, and A1C throughout the course of the 12-week study. There were also statistically significant improvements in these three parameters for the subjects in the control group, but those changes were much smaller in magnitude. The differences between the intensive treatment and control groups were highly statistically significant. The change in A1C showed the highest level of statistical significance—even higher than for WMG. This appears to reflect the fact that the A1C is a better measure of average or integrated glucose values than even a seven-point profile performed once per week, when data are obtained at 6-week intervals. The A1C reflects the average glucose for the previous 3 months—the entire period of the study—whereas the WMG for any given week is based on just 18–21 values over a period of 3 days—if the subject has been 100% compliant. It does not adequately represent nocturnal glycemic levels or glycemia on the remaining 4 days of the week.
The improvement observed for the control group is likely to be a so-called “Hawthorne effect” or “study effect” due to changes in behaviors in response to participation in the study (e.g., attention, encouragement, resources) and not in response to any particular experimental intervention per se. 20 Although these subjects were seen in the clinic only three times over the course of a 3-month period, this was still much more “care” and attention than the conventional or usual care and represented an increase in the frequency and an improvement in the quality of the physician–patient encounters for these subjects. At Week 12, the control group showed a level of improvement that was roughly comparable to the intensive treatment group at Week 1 (Fig. 1A). By Week 12, the control group would have performed 63 glucose measurements (seven-point glucose profiles on each of 3 days in each of 3 weeks).
The present findings clearly indicate that one can adjust medication dosages and combinations of medications in regimens using WMG and weekly SD based on SMBG data rather than A1C at 3-month intervals. SMBG has the advantage of rapid response, making it possible to observe changes at 1-week intervals. In turn this enables rapid adjustment of therapy, rapid correction of mean levels of glycemia, and rapid reduction of glycemic variability (Fig. 1A and B and Table 2). One can use the WMG to calculate a predicted A1C using a simple linear equation. 21
The present findings raise several interesting questions for further study.
Can these beneficial effects be sustained on a long-term basis?
It has been frequently observed that improved glycemic control achieved during an effective intervention is progressively lost at the close of the study. This was observed in the Diabetes Control and Complications Trial, the United Kingdom Prospective Diabetes Study, and numerous other studies. In the present study, there was a maximal effect at 6 weeks, after six weekly clinic visits. By Week 12, with a 6-week hiatus between clinic visits, there was significant loss of efficacy.
The present study was designed to evaluate efficacy and safety of an interdisciplinary, intensive diagnostic, educational, and pharmacological intervention in a short-term basis and not to evaluate effects of long-term interventions. Therefore, our major objective was that of testing the hypothesis that this set of interventions would enable patients to achieve good glycemic control, which might also lead to an improvement in the patient's self-esteem and compliance. Some deterioration of glycemic control as a consequence of the suspension of educational and therapeutic interventions should be expected.
Which components of the present “monitoring, educational, and pharmacological interventions program” are most important, and which are essential to achieve successful control of glycemia?
Are the key components for success the same for all subjects and all patient populations, or do they depend on locale, patient characteristics, “provider” characteristics, or other factors? The intensive treatment group had (1) more frequent clinic visits, (2) longer and more intensive clinic visits with a multidisciplinary staff, (3) more diabetes education, nutritional counseling, and motivational interventions, (4) use of SMBG with downloading and analysis of glucose data in the clinic, and (5) management by a physician who was familiar with the software, the principles for interpretation of glucose profiles, and experience and training in the use of WMG and SD to adjust therapy. The meters, SMBG test strips, six- or seven-point glucose profiles, office visits, and medications were provided free of charge to the patients. Even under the most ideal circumstances in routine care, there is usually the need for the patient to pay for some of these services and supplies. The willingness and ability of patients to implement this in practice remain to be seen. It would be important to try to identify the “minimal” set of interventions that would be sufficient to achieve the magnitude of response (WMG, SD, A1C) that was observed here. The optimal solution may vary from one institution, clinical setting, or patient population to another.
A dramatic change in WMG, reduction in SD, and improvement in A1C might be more effective and cost-effective if it could be achieved rapidly (within 6 weeks, as in the present study), and the improvement might be expected to continue, by virtue of breaking through the barrier of “clinical inertia” and the reluctance of many physicians to adjust therapy at each office visit. It might also be feasible to combine the present approach with clinical decision support at the point of care in order to provide a computer-generated interpretation of the glucose profiles and computer-generated recommendations for changes in therapy, 22 or with telemedicine approaches that would provide frequent interaction of the patient with the physician and multidisciplinary team, in order to attempt to reduce the costs associated with this kind of frequent, intensive interaction. 23
Wagner et al. 24 have used the chronic care model and shown that increasing the frequency of periodic primary care visits with a multidisciplinary team organized to meet the multiple needs of diabetes patients improved the processes of diabetes care, improved medical outcomes, and reduced costs on a long-term basis because of significantly fewer visits to the emergency room and appointments with specialists. Our approach differs from that of Wagner et al. 24 primarily in the examination of the possible benefits of frequent (weekly) interactions with the care team. Also, the two physicians managing the patients in the present study were both endocrinologists/diabetologists—one for the intensive treatment group and one for the control group.
The present study has several limitations. These include:
Small sample size
The present sample size enabled us to perform hypothesis testing with adequate sensitivity. However, a larger sample size would permit a more detailed analysis of subsets of data that might assess the effects of various choices of medication and permit an analysis to try to identify the relative importance and contributions of the multiple aspects of the “intensive monitoring, educational, and pharmacological interventions program.” These components include the frequency of clinic visits, the intensity of SMBG, the protocol for SMBG, the role of computer analysis and display of the AGP, and the relative importance of the contributions of the member from each of the various disciplines represented in the multidisciplinary care team. A larger study could evaluate the robustness and potential generalization of the present approach.
Short duration of the study
Another important limitation is the short duration of the study (12 weeks). Patients with T2DM need to achieve good control for a matter of years, even when one takes into account the effects of “metabolic memory” as exemplified by the long-term 10-year follow-up to the United Kingdom Prospective Diabetes Study. 25
The present study did not include analysis of the patients' behavior modification in response to the intervention
Ideally we would be able to study diet, exercise, compliance with medication, and psychological aspects (stress, depression, treatment satisfaction, etc.). We believe that such aspects should be included in future studies, and they were recently included in a study of structured testing/monitoring. 26 We expect that these psychological and behavioral aspects will be critical for design of interventions to achieve long-term improvement.
Because the study was conducted at one institution, there is the possibility that there could have been some “contamination” between the two treatment groups due to interactions among the patients or among the caregivers for the two treatment groups
The same caregiving group was involved in the patient education for both groups. However, this should be an advantage in terms of standardizing that aspect of the therapeutic intervention, aside from the large difference in total time devoted to each patient. The multidisciplinary diabetes team (nurse, nutritionist, educator, and exercise specialist) did not interact with subjects in the control group at Weeks 6 and 12, and this substantially reduced the risk of cross-contamination of the two groups. Besides, any cross-contamination would have been expected to reduce the differences and significance of the differences between the two groups of subjects.
Conclusions
Clinical inertia is a major obstacle for the achievement of good glycemic control. Guidelines from different diabetes associations throughout the world have consistently adopted the concept of promoting therapy adjustments at 2–3-month intervals. 27,28 The present randomized, controlled, proof-of-concept study demonstrated the ability to safely improve glycemic parameters such as WMG, glycemic variability, and glycemic profile within just 6 weeks in the majority of our patients by means of intensive self-monitoring, educational, lifestyle, and pharmacological interventions. The availability of software for computer analysis and display of glucose values greatly facilitated this task.
In general, in the past SMBG data have not been used to fullest advantage. Only a small minority of physicians routinely downloads glucose data from memory-equipped glucose meters and performs systematic analyses and interpretation of the data. We believe there is a need for improved methods for display and analysis of SMBG data, for a systematic approach for identification and prioritization of clinical problems revealed by SMBG, for characterization of blood glucose variability, and for clinical decision support. 29
A recent report demonstrates the effectiveness of structured SMBG on patient self-management behavior and metabolic outcomes in T2DM. 30 Another study also demonstrated that appropriate use of structured SMBG significantly improves glycemic control and facilitates more timely and aggressive treatment changes in non–insulin-treated T2DM. 26 Our present results are consistent with the conclusions from these studies.
The major objective of this study was to evaluate the feasibility of the implementation of an intensive approach to rapid glycemic control without significantly increasing the risk of hypoglycemia. Further studies with a larger number of participants and a longer period of observation are warranted.
Appendix
Members of the Diabetes Education and Control Group are Amanda Pires, Anita Sachs, Aparecida Fátima Bueno, Bianca Pires, Camila Costa, Clarissa Uezima, Ednir Apostólico, Elizabeth McKenzie, Erácliton de Souza, Fátima Regina da Silva, Fernanda Carvalho, Gabriela Cavicchioli, Graça Camara, Irma Cianfrone, Kátia Martins, Katia Niglio, Milena Alves, Mário da Silva Júnior, Nivia Sanches, Marta Darhouni, Moema Bueno, Mônica Gamba, Patrícia Fan, Patrícia Monteagudo, Patricia Zach, Priscila Broinizi, Rene de Araujo, Regina Niglio, Sheilla Silveira, Sonia Couto Ramos, Tarcila Campos, and Viviane Nascimento.
Footnotes
Acknowledgments
The authors wish to express their heartfelt appreciation to the members of the Diabetes Education and Control Group of the Kidney and Hypertension Hospital, Federal University of São Paulo, São Paulo, Brazil, for their full support of the educational interventions and especially to Amanda Pires, R.D., Principal Study Monitor. Roche Diagnostics of Brazil provided Accu-Chek Performa glucose meters, monitoring supplies, and the Accu-Chek 360 software.
Author Disclosure Statement
A.P.-N. has been a consultant and speaker for Roche Diagnostics Brazil and Bayer HealthCare–Diabetes Care, Brazil. D.R. has been a consultant with Abbott Diabetes Care, Amylin, Inc., Animas Inc., DexCom, LifeScan, Inc., Roche Diagnostics, and Sanofi-Aventis, Inc. M.T.Z. is a consultant and clinical researcher for Novartis, Merck, Sanofi Aventis, Pfizer, and Takeda.