
Abstract
The two basal insulin analogs, insulin glargine and insulin detemir, were developed to ameliorate the well-known limitations of NPH insulin. In contrast to rapid-acting analogs, which differ exclusively in terms of primary structure while sharing similar pharmacokinetics (PK) and pharmacodynamics (PD), the two long-acting insulin analogs are different chemical and structural entities, exhibiting distinct modes of protracting the insulin effect. So far, PK and PD studies of long-acting analogs have often shown conflicting results, pointing out different conclusions, thereby leading to animated controversies. The methods used in the evaluation of basal insulins might have been partially responsible as, although the euglycemic clamp technique has been broadly acknowledged to be the “gold standard” reference to assess the glucose-lowering effect of an insulin preparation, its execution and interpretation might have been substantially different across studies, in various methodological and analytical aspects, ultimately providing an explanation for some of these controversies. This review will present and describe the basic methods used in the evaluation of basal insulins and will critically summarize the points that might have been responsible for the different outcomes. The findings of glucose clamp studies demonstrate that the two long-acting insulin analogs are different, to some extent, in both their PK and PD profiles. These differences should be taken into consideration when the individual analogs are introduced to provide basal insulin supplementation to optimize blood glucose control in patients with type 1 and type 2 diabetes as well.
Introduction
Subcutaneous insulin substitution must then meet the need for both fasting and postprandial blood glucose control aiming at near-normoglycemia while, simultaneously, avoiding hypoglycemia. Needless to say, insulin analogs have represented important contributors of the improved outcome, in terms of blood glucose control. 2,3
Three rapid-acting insulin analogs have been produced to better limit the rise in plasma glucose after meals, whereas two long-acting analogs were developed to ameliorate the well-known limitations of NPH insulin: pronounced peak of activity, limited duration of action, and erratic absorption. 4 –7 The two long-acting insulin analogs—glargine and detemir—are different chemical and structural entities, with different modes of protracting the insulin effect. 8 This may well explain the large number of pharmacodynamics (PD) and pharmacokinetics (PK) studies that have been undertaken to define the relative characteristics of the two molecules, in order to underline potential advantages/disadvantages of one versus the other.
Surprisingly enough, PK/PD studies of long-acting analogs have often shown conflicting outcomes and results, pointing out different conclusions, thereby leading to animated controversies.
Indeed, although the euglycemic clamp technique has been broadly acknowledged to be the “gold standard” reference to assess the glucose-lowering effect of an insulin preparation, its methodological execution and interpretation have been substantially different across studies, under a variety of aspects, ultimately providing explanation for some of these discordances.
Ensuring “clamps” are reproducible and reliable requires standardized protocols in order to allow precise quantitative measurement and systematic comparisons between different research groups, 9 ultimately allowing prediction of findings from clinical trials.
In the light of the above discussion, and with the aim of providing a track for readers and reviewers for the interpretation of PK and PD studies, this review will present and describe the basic methods used in the evaluation of basal insulins and will critically summarize the points that might have been responsible for the apparently different outcomes. It further aims to illustrate how clamp study results may easily translate into concepts relevant for daily practice.
The Euglycemic Glucose Clamp Technique
The basic principle
Originally developed and introduced by Andres 10 back in 1979, to measure peripheral insulin sensitivity in clinical research, the euglycemic glucose clamp technique was subsequently applied to assess the PD properties of insulin preparations. In this case insulin is injected into subjects, and the amount of glucose infused, to prevent the expected decrease in blood glucose concentration, thus “clamping” blood glucose to a predetermined level, reflects accurately the biological effect (i.e., glucose-lowering effect) of the tested insulin. The recorded glucose infusion rate (GIR) then constitutes a measure of the net effect of the insulin (i.e., it describes the resulting sum of the suppression of hepatic glucose production and the stimulation in glucose utilization), making it possible to establish the onset, peak activity, and duration of action. 9,10 The euglycemic glucose clamp may be coupled to glucose turnover measurements to quantify the exact proportion of the residual endogenous (hepatic) glucose production and of the peripheral glucose utilization.
The very first attempt to assess PD of insulin preparations dates back to 1952 and is due to Gerritzen.
11
In his test, different insulin preparations (20 U) were injected in healthy student volunteers, and a standardized amount of oral carbohydrates (mashed potatoes) was given, at regular intervals, to prevent the counterregulatory responses to blood glucose decrease: Thirteen different insulins have been tested in young healthy students under standard experimental conditions that is, absolute rest and a constant hourly intake of carbohydrate and water. These insulins have been classified into four categories, according to the duration of the action, with the object of simplifying the choice of the most suitable insulin …
11
noted Gerritzen in one of his first articles, pointing out, with remarkable intuition (1) the need for standardized conditions in glucose clamp studies and (2) the role of insulin PD as a prerequisite for the optimal use of any insulin preparation in patients with diabetes.
The study population
The most reliable assessment of PK/PD of a given insulin preparation implies that the insulin to be tested is applied in a study population lacking C-peptide (type 1 diabetes mellitus subjects), not in the presence of endogenous insulin secretion, either normal (subjects without diabetes) or impaired (type 2 diabetes mellitus subjects). In fact, when the metabolic activity of the applied insulin is declining, in type 1 diabetes subjects, at first GIR decreases, whereas later plasma glucose spontaneously and progressively rises, thus allowing a clean, reliable, and accurate definition of PD.
Conversely, in healthy subjects, as well as in individuals with type 1 diabetes with short disease duration and, to a greater extent, in individuals with type 2 diabetes, the presence of any endogenous insulin secretion might importantly interfere with PD outcomes, above all, with the onset, duration of action, and overall activity. Clear demonstrations of this are first clamp studies in volunteers without diabetes looking at PK/PD of insulin glargine 4 and detemir, 12 in comparison with that of NPH insulin, where metabolic activity of NPH is still observed at 24 h 12 or even at 30 h 4 and appears steady. This is in clear contrast to what is the feedback from clinical practice. Accordingly, clamps testing rapid-acting insulin analogs in healthy individuals show remarkable intravenous glucose requirement (∼2 mg/kg/min) even 10 h after insulin administration. 13
The reason for these findings may well reflect the contribution of the ongoing endogenous insulin secretion. In addition, in subjects without diabetes as well as in individuals with type 2 diabetes, as plasma glucose tends to decrease during a prolonged fast, the artificial maintenance of euglycemia might stimulate endogenous insulin secretion and exaggerate the rate of glucose infusion, thus overestimating duration of action. Indeed, the role of prolonged fasting is striking in one observation 12 where, at the end of the study (24 h), GIRs with placebo (saline infusion) were almost superimposable to those with trial drug 12 (Fig. 1).
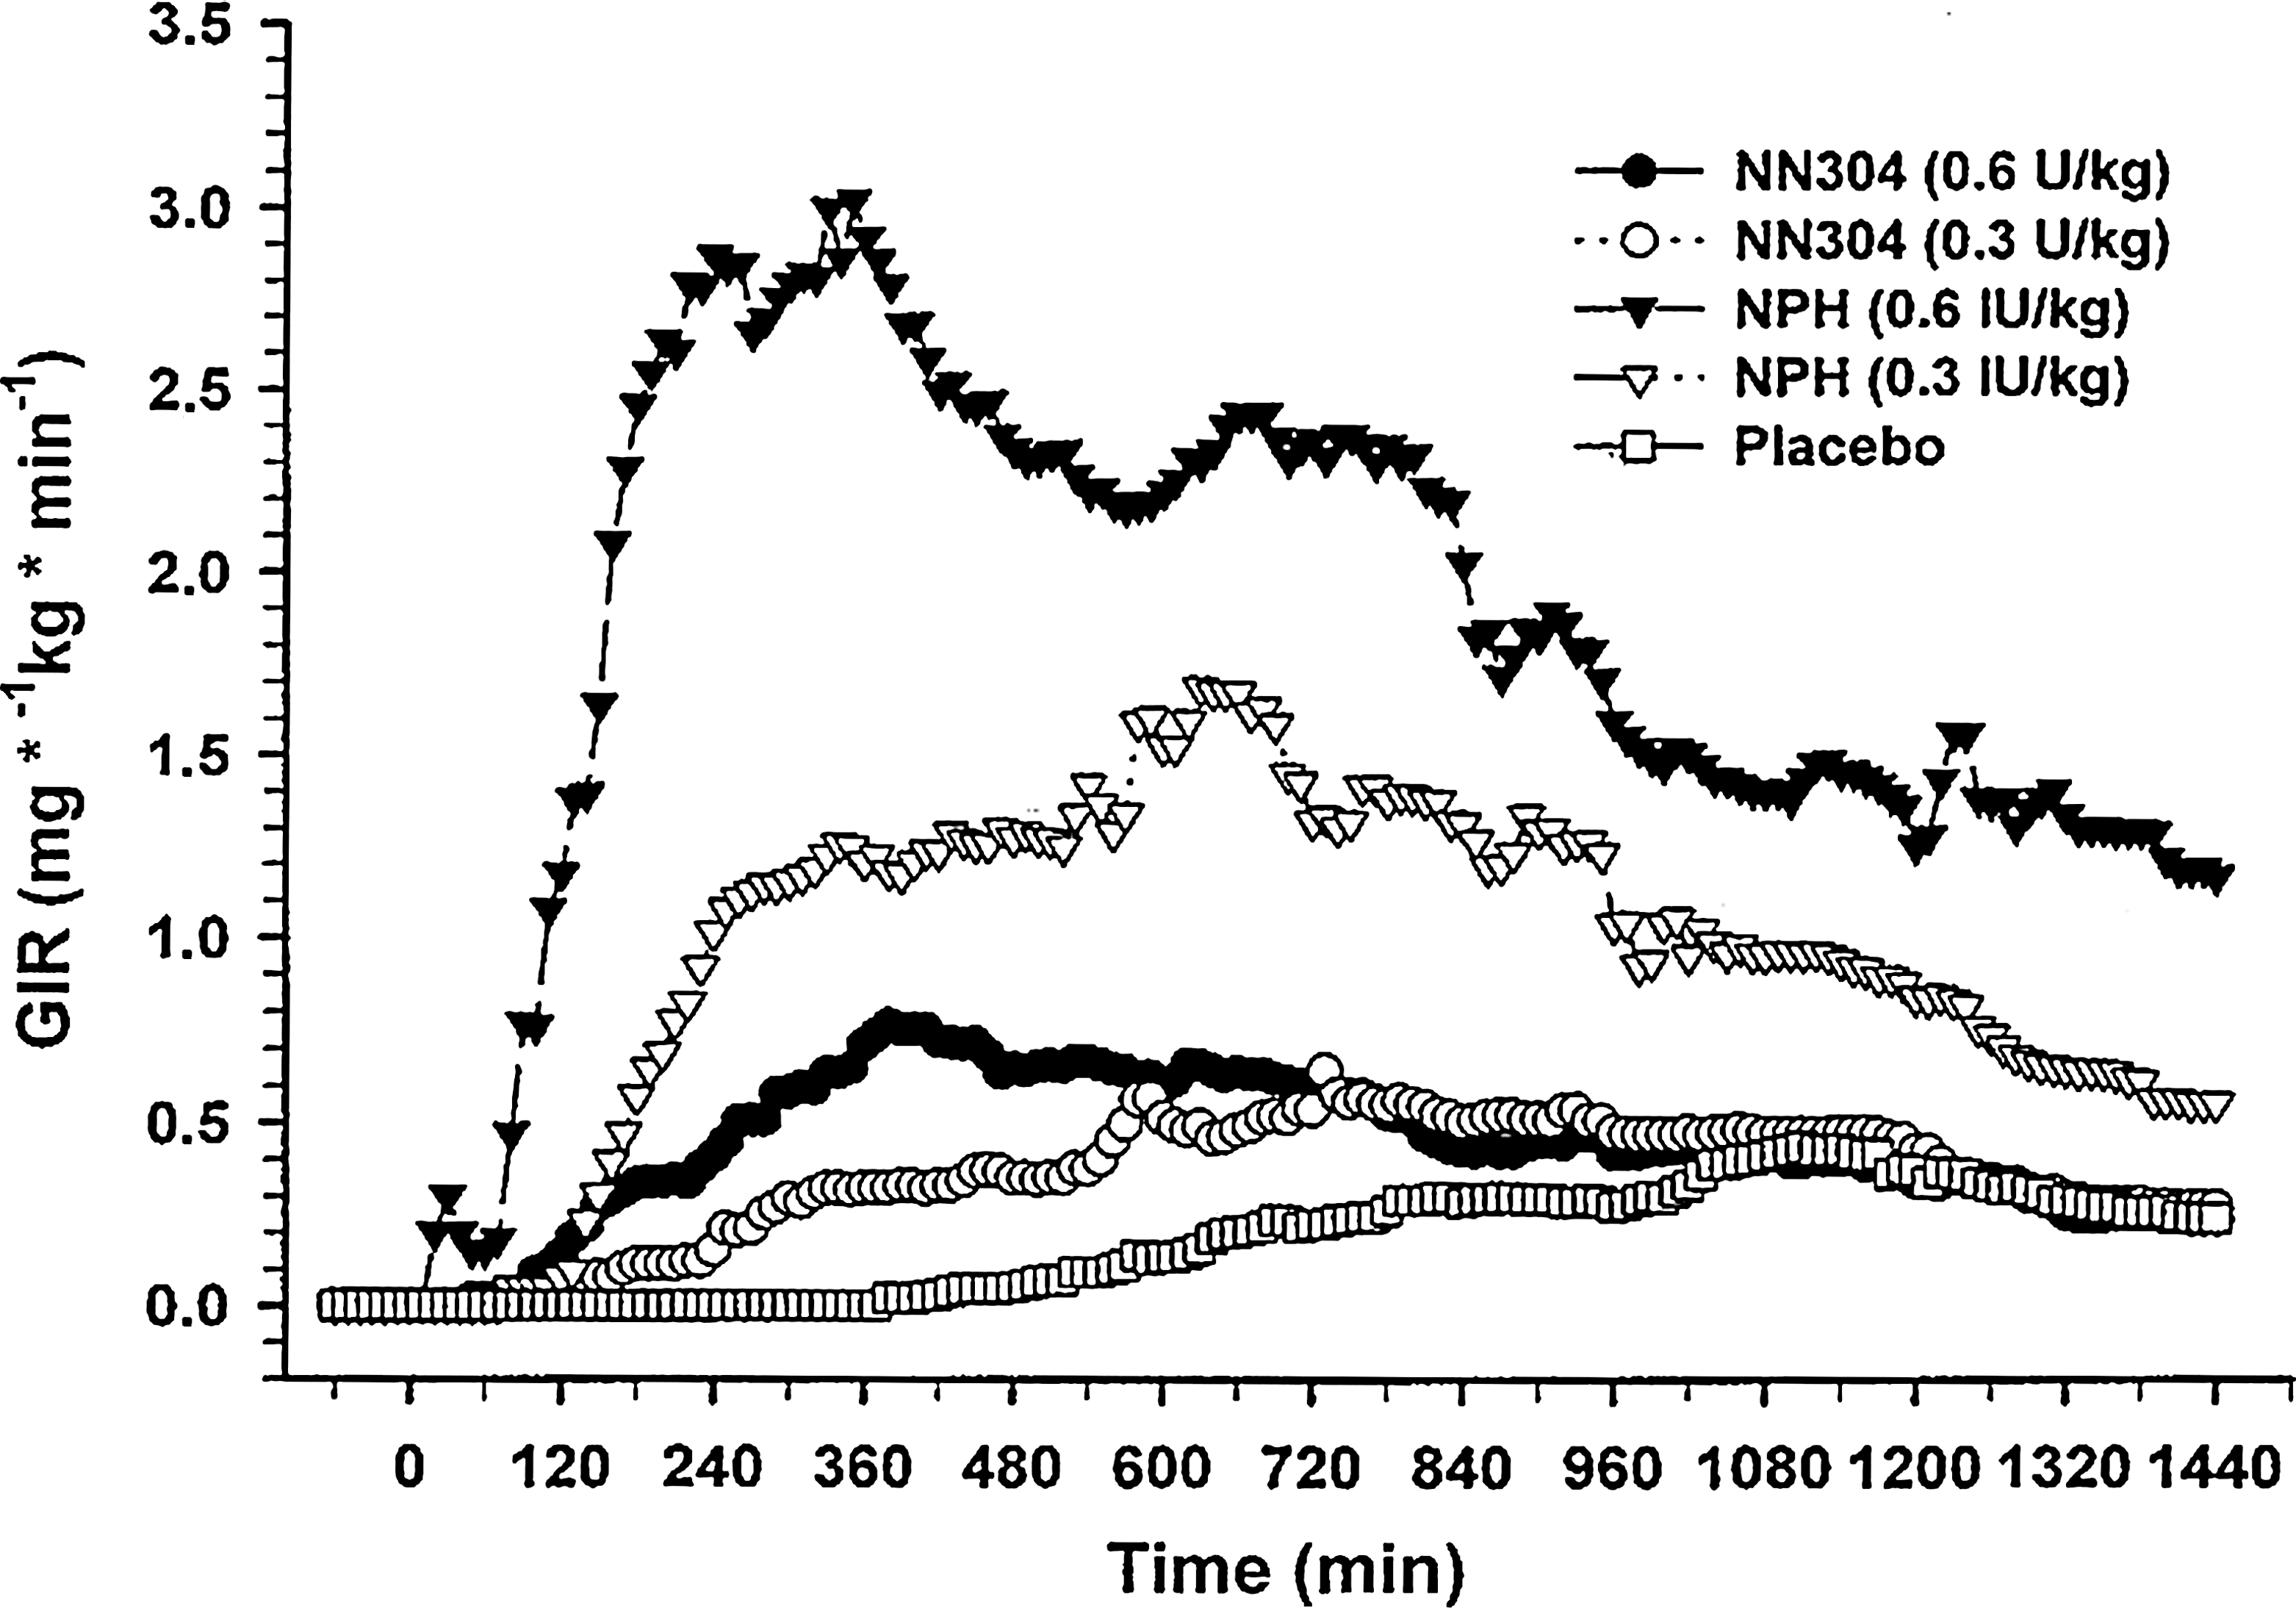
Mean glucose infusion rate (GIR) profiles following the different treatments (n = 10 in each group). Each subject was investigated on 5 different days with administration of placebo (volume equivalent to a dosage of 0.3 IU/kg), NPH insulin (100 IU/mL; 5,808 molecular weight), or NN304 (600 nmol/mL; 100 U/mL; 5,917.2 molecular weight) in dosages of 0.3 IU/kg and 0.6 IU/kg. After subcutaneous injection of the test substance at 0 min, arterialized plasma glucose levels were kept constant at 4.5 mmol/L by variable infusion of glucose during a 24-h period. Reproduced with permission from Brunner et al. 12
The method of suppressing endogenous insulin secretion, by means of a constant intravenous insulin infusion, as suggested by some authors, 9 in order to more appropriately study healthy subjects, does not seem adequate, as it does not rule out the metabolic impact of the continuous intravenous insulin administration (i.e., it may anticipate onset of action and delay end of action of the tested insulin). 4,13 –17
Keeping in mind all the above considerations, the conclusion of an otherwise well-performed study in healthy subjects showing only marginal differences in glucodynamics among glargine, detemir, and NPH should not be surprising at all. 18
For such reasons, it is not informative, and actually it can be misleading, to represent altogether time–action profiles of insulin preparations no matter whether clamps were performed in individuals with type 1 or type 2 diabetes. 19
Nevertheless, it is fair to recognize that, although the relevance of assessing insulin PD in healthy subjects is limited and substantially linked to regulatory purposes, studying individuals with type 2 diabetes might deserve a potential, relevant interest. However, performing and interpreting clamp studies in type 2 diabetes is “challenging,” requiring experience and skill, as one has to acknowledge the great heterogeneity of this population, particularly with respect to variations in insulin sensitivity and endogenous insulin secretion, which might affect largely insulin PD. The proper PK/PD study in patients with type 2 diabetes requires a crossover design 20 where the influence of different confounders and bias is reduced as each crossover patient serves as his or her own control (see below).
The drawback of studying insulin PD in subjects with diabetes is the need for an adequate preparation of subjects prior to clamps, in order to have comparable, stable, baseline plasma glucose and insulin levels. This is obtained with an intravenous insulin infusion, the so-called “insulin feedback,” which usually is commenced at least 4–6 h prior to the study of insulin administration. 21
During this phase, insulin is usually infused at variable rates, according to an empiric feedback principle, regulated on the basis of frequent (3–7 min) plasma glucose measurement. 21 In subjects with type 2 diabetes, the intravenous insulin is usually withdrawn at least 2–3 h prior to the subcutaneous insulin injection because these subjects can maintain euglycemia based on their endogenous insulin secretion. However, in subjects with type 1 diabetes, the intravenous insulin infusion is continued until, and for a short time, after the subcutaneous injection of test insulin and then progressively decreased and finally withdrawn in parallel with the initiation of the glucose-lowering effect of the insulin. Concurrently, intravenous infusion of glucose is commenced to maintain the euglycemic status. The plasma glucose target of a clamp glucose has to be reached ideally at least 1 h before trial insulin administration, without any glucose infusion.
The “insulin feedback” is the most critical part of a clamp study, as it might heavily affect the subsequent PK/PD interpretation of the tested insulin. For instance, an “overinsulinization” during this phase could have a relevant impact on glucose requirement during the first part of the clamp, influencing insulin sensitivity, and overestimating the subsequent insulin action, thereby making interpretation of PD data not accurate. Conversely, an “underinsulinization” during the feedback phase would probably translate into an easy “escape” of blood glucose from the target value during the first part of the clamp, before insulin action takes place.
The study design
It is important to accurately standardize experimental study conditions (injection time, duration of fasting, changes in physical activity) in order to reduce inter- and intra-individual differences in insulin sensitivity, but the best way to minimize the impact of the heterogeneity of subjects with type 1, and to a larger extent with type 2, diabetes mellitus on the accuracy of results is to perform a crossover design. 20 Body weight, types and regional distributions of adiposity, endogenous insulin secretion, and duration of disease are only a short listing of all the conditions that may influence insulin action, leading to huge interindividual differences in PK and PD. Therefore, in particular when the study comprises a head-to-head comparison between different insulin preparations, it is certainly more important to conduct crossover, not parallel group, study design, 22 which reduces the sources of bias and confounders by removing the inter-subject variation. 20 Unfortunately, this has not been always the case. Looking back to recent literature, only a few studies have been performed using a crossover design both in type 1 23 –26 and, more surprisingly, in type 2 diabetes, where only a novel observation is available, 27 in addition to another study comparing insulin lispro protamine suspension with glargine and detemir, 28 which is of limited utility given the insulin dose, which is far from clinical relevance (0.8 U/kg) for most patients.
However, a parallel study design can be the choice when the number of replicates is high, in experimental designs investigating intra-individual variability of insulin action. 22
Two other points are of critical importance in the study design for a proper interpretation of a clamp study: the single-dose design versus steady-state condition and the timing of injection of the tested insulin.
The single-dose design has been adopted by the vast majority of studies, 17,23,29 –32 whereas only a few, more recently published articles have examined PD profiles in a steady-state condition (i.e., after several days of subcutaneous administration of study insulin). 24 –26,33 Needless to say, the steady-state design more closely mirrors the clinical setting than the single-dose evaluation, thus allowing a better assessment of basal insulin PK/PD. In fact, the PK/PD are not directly comparable when obtained from these two experimental conditions, as they might differ substantially. This has been clearly demonstrated by recent studies in which glargine has shown a relevant longer duration of action after 1 25 or 2 weeks of its use 24 compared with the first injection. 23
The timing of injection of the tested insulin during a clamp study might also importantly affect PD data. Injection time across studies has been different, varying from the early morning 32 to the afternoon 23 and the evening; 17,24 some articles have not clearly reported it. 22,26,30 Nevertheless, this information is crucial, as timing of injection might promote insulin action that superimposes or, conversely, counteracts the diurnal changes in insulin sensitivity. In other words, if during a clamp study basal insulin has been injected in the morning, assuming the clamp duration is 24 h, presumably the end of insulin action would have been affected or even truncated by the concurrency of the dawn phenomenon, 34 the morning after.
This concept has been focused on in a recent study, in patients with type 2 diabetes, in whom basal insulins were administered at bedtime and in steady-state conditions, thus mimicking the real life of patients. 27 Clamp duration was prolonged to 32 h. The study showed an increasing metabolic activity for glargine and NPH during the afternoon, reaching a time to maximum GIR of 16–18 h after injection, likely because of the contribution of greater insulin sensitivity at that part of the day, whereas a sensible reduction in the GIR requirements was noted in the morning 10–12 h after injection, 34 in coincidence with the lower insulin sensitivity at dawn. 27
The glucose clamp technique
Nowadays glucose clamp studies can be either performed manually 9,12,23 –25,29,31,32,35 or by means of an automated procedure, the so-called “artificial pancreas.” 4,10,13,22,30,36,37 When performed manually, GIR is regulated by the investigator from blood glucose measurements taken at regular intervals. Conversely, with the “artificial pancreas,” GIR is adjusted automatically, on the basis of continuous blood glucose measurement, by means of a direct negative feedback algorithm.
For these reasons, the studies performed with the “artificial pancreas” are not immediately comparable with those using the “manual clamping” because of several differences: among others, the “artificial pancreas” measures blood glucose, and not plasma glucose; its glucose sensor drifts over short periods of time; it may be associated with suboptimal arterialization of blood samples; it has a 5–10-min lag between glucose reading and subsequent glucose infusion; and it is based on a fixed algorithm, which results in quite large excursions of GIR on a minute-by-minute basis, requiring a robust “smoothing” algorithm for its analysis and interpretation.
Conversely, the manual clamping allows frequent measurement of glucose in well-arterialized plasma samples, by means of a validated method whose accuracy is ensured over time by a rapid calibration process, and shows lower GIR variability, compared with the Biostator (MTB Medizintechnik, Ulm, Germany), thus requiring a much “softer” smoothing. However, manual clamping does not rule out a potential investigator-related bias, which does not pertain to the artificial pancreas. Therefore it is not surprising that these two methods might potentially yield different results; what is surprising is that no study has directly compared insulin profiles obtained by both methods in the same subjects.
Considering the above observations, when taken together, we believe that regulatory authorities should definitely move to a standardization of PK/PD insulin studies in diabetes, especially in the light of what has been stated by the European Medicines Agency, which deems data gained by the euglycemic clamp technique of critical relevance in assessing therapeutic properties of different products. 38
PK/PD of Basal Insulins in Type 1 Diabetes
The first evidence of the striking difference in the PD profile between NPH and glargine came from an early study in type 1 diabetes. 23 After subcutaneous injection of a therapeutic dose (0.3 U/kg), GIRs with NPH reached a peak of 3.4 mg/kg/min 5 h after administration, whereas rates were nearly constant with glargine from 3 h onward, reaching barely 1 mg/kg/min. 23 A considerably earlier end of action was described for NPH (14 h) compared with glargine (22 h), whose metabolic activity was still present at end of study (24 h) in 16 out of the 20 patients studied. 23
All subsequent studies have confirmed the remarkable, less pronounced peak of activity of glargine regardless of whether the research was performed in healthy individuals 4,35 or subjects with type 1 22 –25 or type 2 27,30,32 diabetes.
Despite that, the definition of “flat” and “peakless” used in the study by Lepore et al. 23 to characterize glargine PD has been criticized, 15,19,39 and several suggestions have been proposed for a more adequate description of insulin profile, such as “waxing and waning” 39 or “gentle rise and fall.” 19 However, while “flat,” in the case of glargine action profile, does not surely meet the Webster's dictionary definition, 39 no one could argue against the evidence that it appears nearly peakless compared with the discernible peak of activity of NPH, 4–6 h after administration. 23
The day-long duration of action of insulin glargine has been substantially described by all studies, which consistently reported a mean duration of action close to 24 h, and exceeding 24 h at steady state, 24 –26 supporting the once-daily administration of glargine to avoid the risk of hypoglycemia due to overlapping doses every 12 h. 24,25,36
Determining the PK and PD properties of detemir has been more difficult compared with glargine owing to its relatively lower affinity for the insulin receptor compared with human insulin. 40 Therefore, initial studies focused on finding the dose equivalence with human insulin as well as proportionality of dose–response effects with a detemir:NPH molar ratio of 1:1. 12,13,41 Moreover, because the PK of detemir are difficult to determine as measurement of its concentration in plasma does not distinguish among the bioavailable (free) and albumin-bound fractions in the circulation, the majority of the studies report only on the PD profile of detemir.
After careful replication of the original clamp methodology of Lepore et al., 23 Plank et al. 29 demonstrated a dose–response effect with detemir in patients with type 1 diabetes. A dose of detemir at 0.4 U/kg achieved maximal action at 7–10 h with a (mean) end of action of almost 22 h and a total duration of action up to 20 h. 29 Higher doses of 0.8 and 1.6 U/kg extended the end and duration of action to nearly 24 and 23 h, respectively, but a clear peak of action appeared, similar to that of NPH in previous studies. 4,22 Direct comparison with NPH was subsequently done by Wutte et al., 31 who compared 0.15, 0.30, and 0.60 U/kg for both detemir and NPH and reported similar dose–effect proportionality and bioequivalence between the two insulins. In addition, detemir exhibited a peak action profile 31 similar to that demonstrated earlier by Plank et al. 29
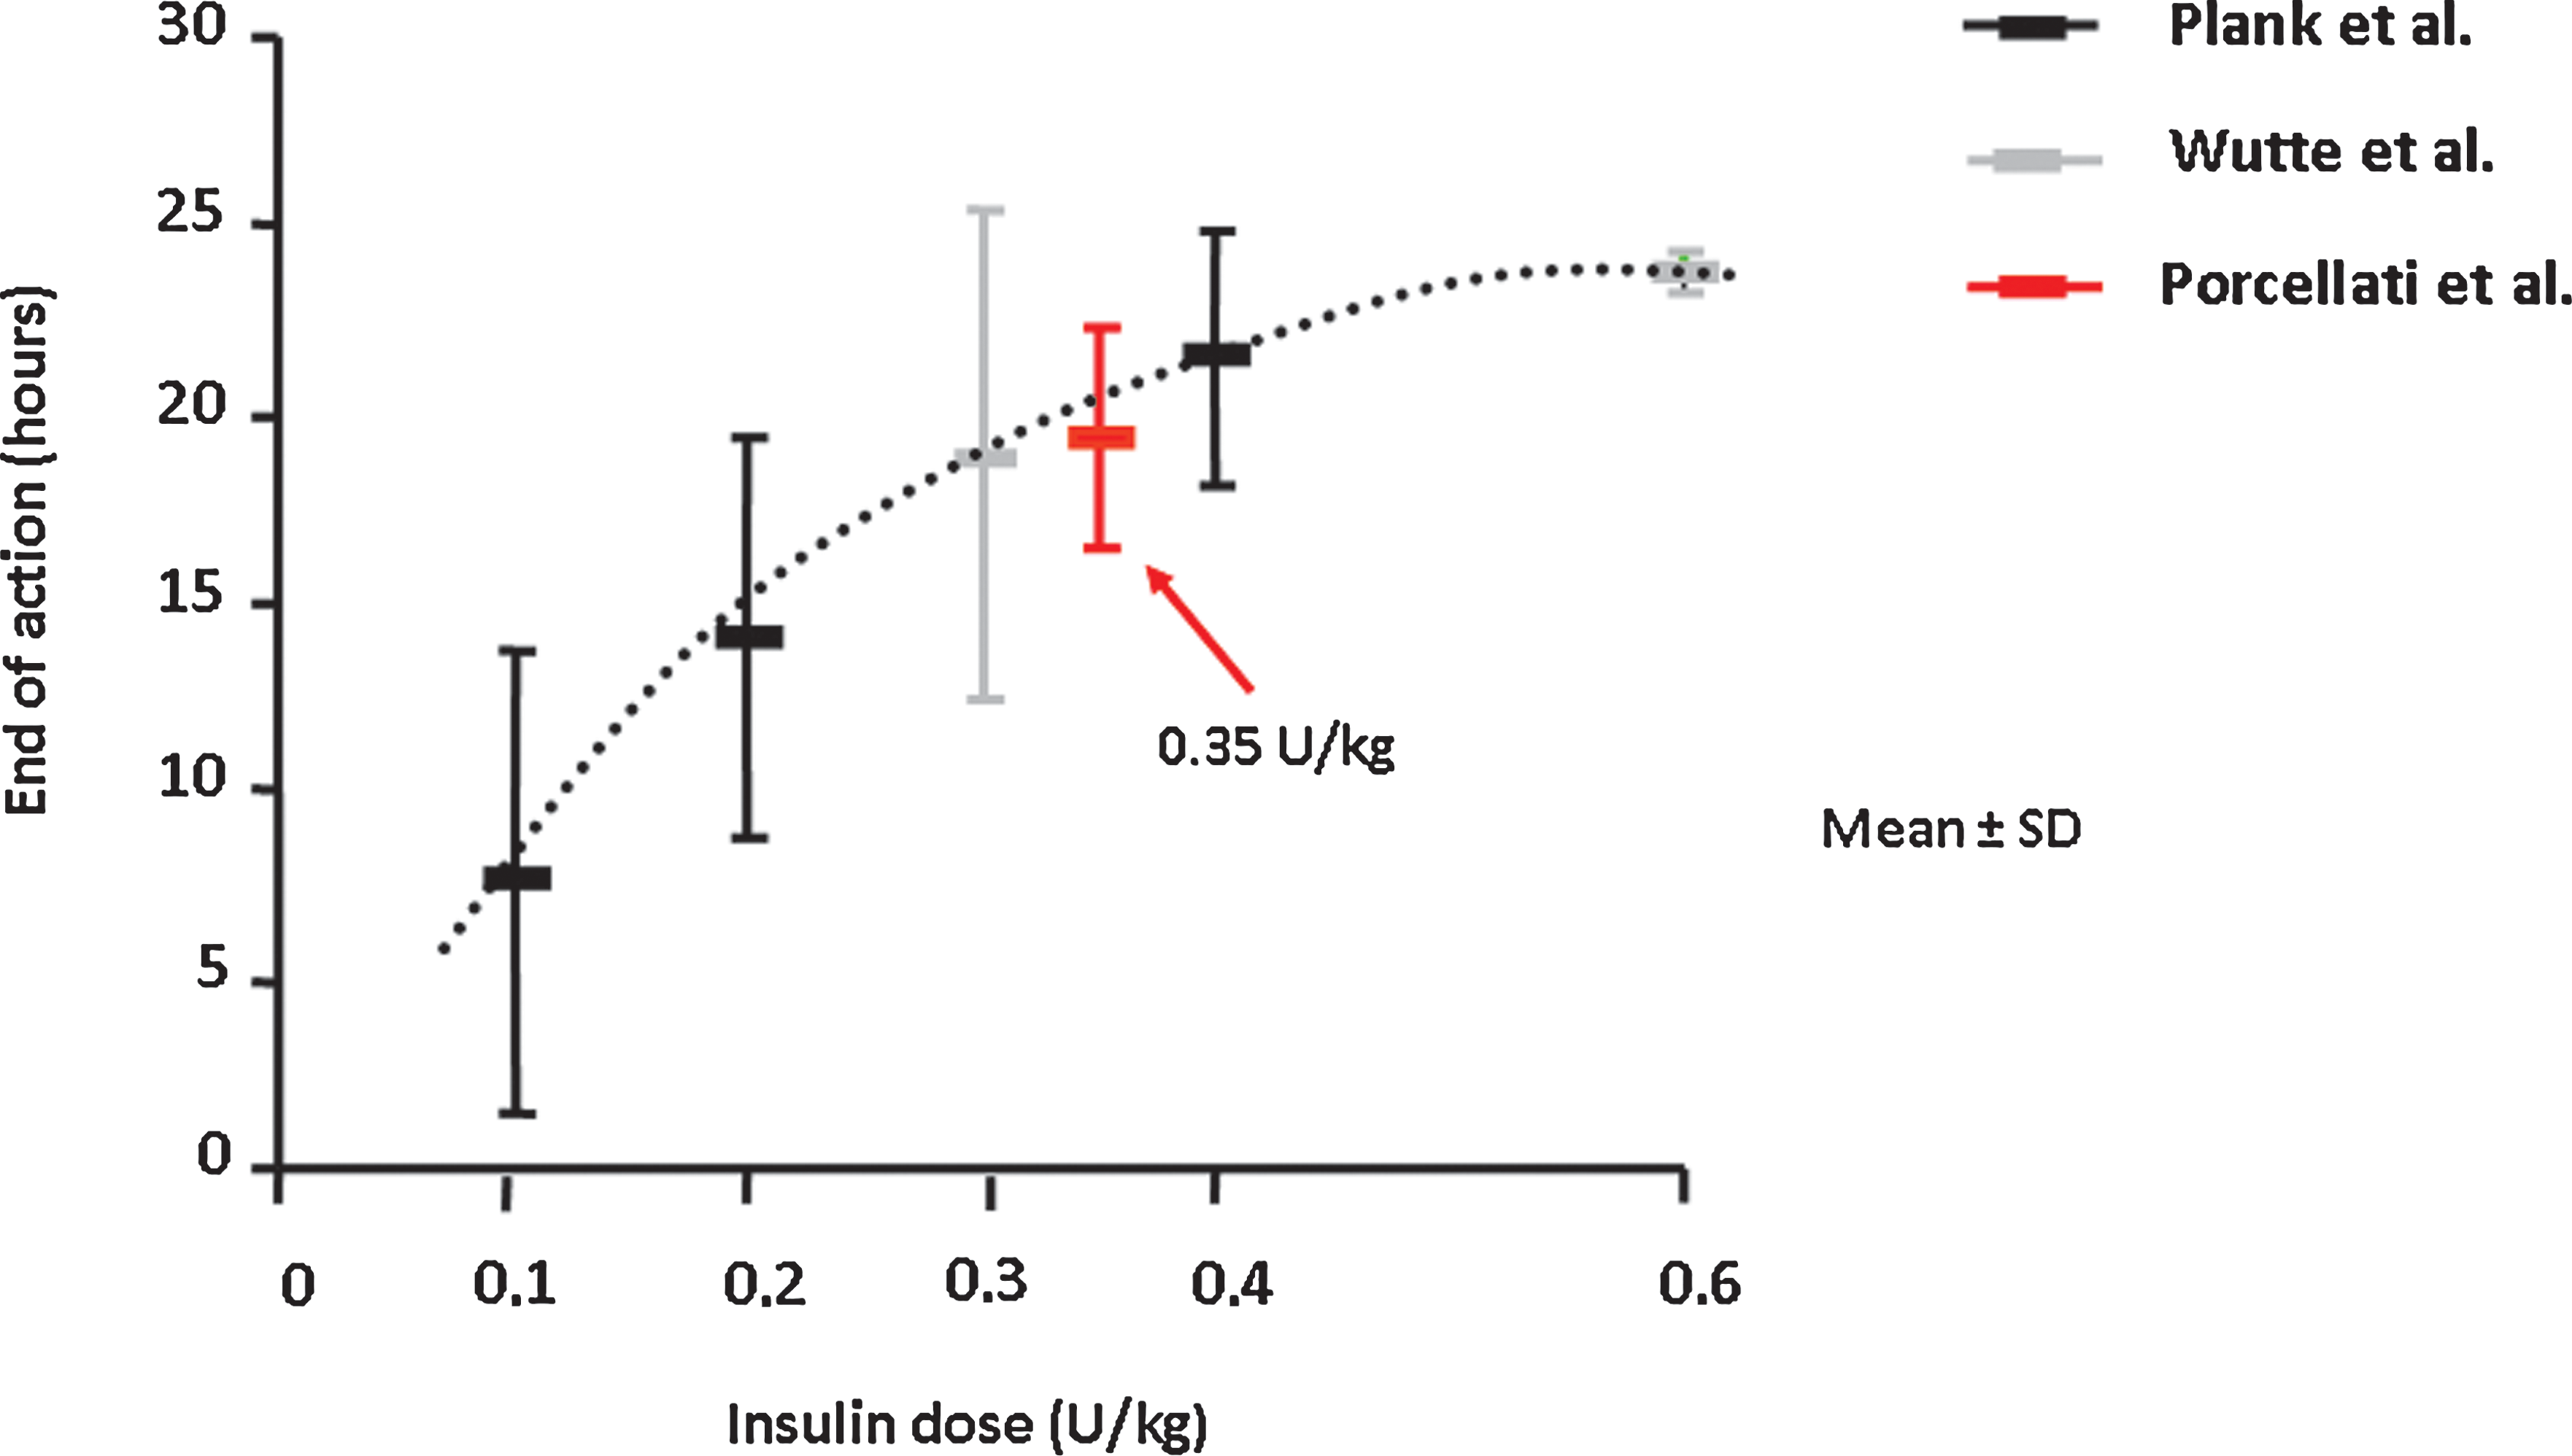
To date only one “head-to-head” comparison of the PK and PD of detemir and glargine has been performed in individuals with type 1 diabetes at steady state (2-week treatment), in a randomized, crossover, double-blind study. 24 At therapeutic doses of 0.35 U/kg, both basal insulin analogs showed similar effects for the initial 12 h after injection; subsequently, whereas the end of action (defined as the time at which plasma glucose was >8.3 mmol/L) for glargine extended to 24 h (range, 23–24 h), that for detemir (median) was 17.5 h (range, 16–24 h). Overall, the mean value of end of action was 19.4 h, which fits well in the detemir dose–response curve described in previous studies adopting similar clamp methodology 8,29,31 (Fig. 2). Estimated total insulin activity, as calculated from GIR/24 h, was 30% lower for detemir in comparison with glargine. 24 Perhaps the most interesting data were those related to the antilipolytic action of the two basal insulins, showing a remarkable lower effect for detemir with an earlier and greater increase in free fatty acids and ketones even during the initial 12 h of study, at which time activities of detemir and glargine on glucose metabolism were equivalent 24 (Fig. 3).
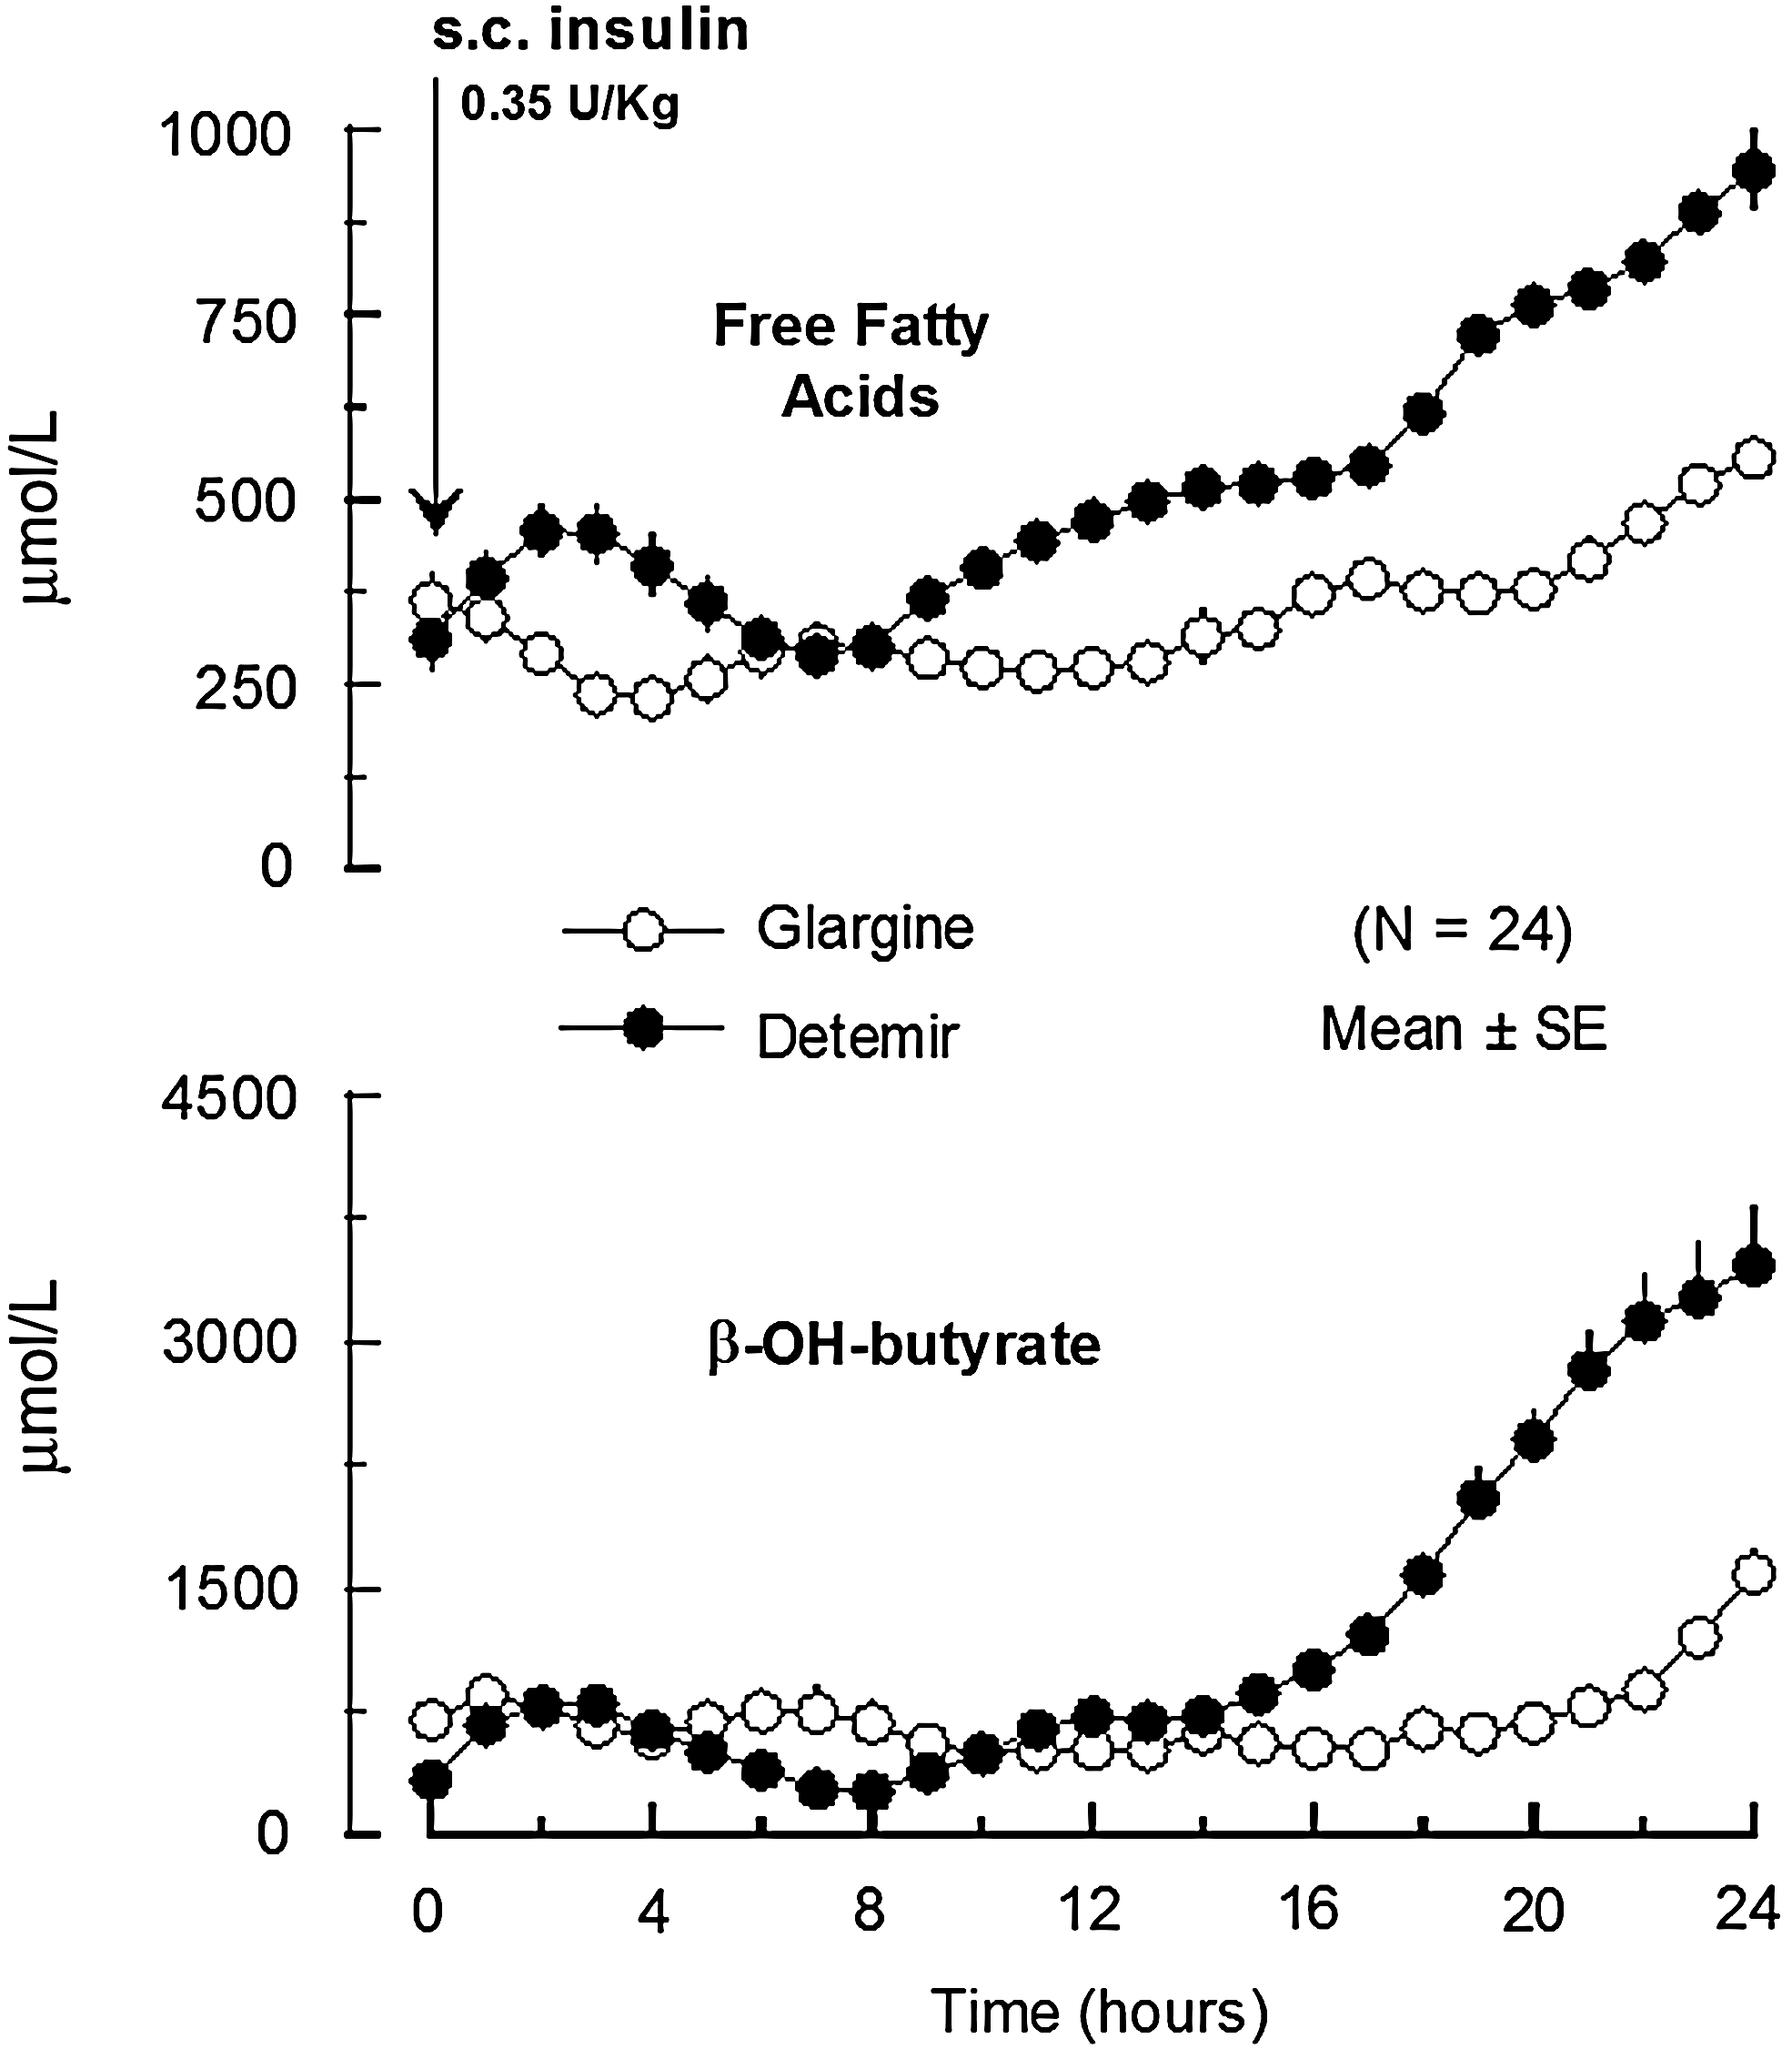
Levels of plasma free fatty acids and β-hydroxybutyrate after subcutaneous (s.c.) injection of insulin detemir or insulin glargine. 24
It is notable that the study by Bock et al., 26 also comparing glargine and detemir in type 1 diabetes reproducing the technique of Porcellati et al., 24,25 has confirmed duration of action for glargine to be close to 24 h, and even longer at steady state, but shorter for detemir at steady state than after the first injection (23.3 and 25.9 h, respectively), with the latter being longer than previously reported. 8,24,29 This might be due to either the greater dose of insulin (0.4 U/kg vs. 0.35 U/kg) and, perhaps, to significant residual C-peptide levels in some patients, which could have differently affected the outcomes, in the end suggesting the relevance of crossover and not parallel group study design. 26 Therefore, in type 1 diabetes at a clinically relevant dose of 0.30–0.35 U/kg, the duration of action of detemir 24,29,41 is less than 20 h, which is considerably shorter than with glargine. 22,24,25
Glargine and detemir have also been studied for variability, as the soluble pharmaceutical formulation of the two long-acting insulin analogs might lead to lower variability in both PK and PD, as resuspension prior to injection is unnecessary, thus eliminating a significant source of variability. 7,42 While the variability of effect between subjects is reported in all clamp studies, only a few have addressed the issue of within-subject variability, which typically is better investigated in a crossover study, with replicated clamps, where subjects need to be studied more than once with each treatment.
A significant reduction in between-subject variability for glargine compared with NPH has been described both in healthy volunteers 4 and in individuals with type 1 diabetes. 23 Scholtz et al., 35 with a parallel-group replicate-design study, showed similar levels of within-subject variability between glargine and NPH in healthy volunteers. A parallel-group with replicates design was also adopted by the only available study in type 1 diabetes, by Heise et al., 22 comparing glargine, detemir, and NPH, which indicates that both insulin analogs have a smoother action profile and appear less variable than NPH (coefficient of variation of the area under the curve for GIR0–24h, 68%), with detemir showing lower values (27%) compared with glargine (48%). However, the study has a number of flaws; for instance, the GIR was initiated before the subcutaneous insulin in several subjects in response to excess intravenous insulin infusion, which makes the interpretation of PD data of this “artificial pancreas” study difficult. 22 Therefore additional studies are required to give an answer to the question of intra-subject variability in type 1 diabetes.
Nevertheless, a recent observation is noteworthy, comparing a new-generation acylated insulin, insulin degludec, with glargine in a parallel-group study, which apparently has showed a lower within-subject variability for the former compared with the latter, implying that reduced within-subject variability might be an intrinsic characteristic of albumin-binding insulin analogs. 33 Nevertheless, the within-subject variability of insulin glargine was unexplainable, being much higher (coefficient of variation of area under the curve for GIR0–24h, 82%) than that shown earlier. 22
PK/PD of Basal Insulins in Type 2 Diabetes
Limited information on PK and PD of basal insulins is available in individuals with type 2 diabetes. It is surprising that the PK and PD of the world's most popular insulin, NPH, have not been studied in type 2 diabetes, with a few exceptions. 17,37 However, these studies are either confounded by concurrent intravenous insulin and/or limited by a short observation period comparing NPH with only one long-acting insulin analog 17,37 or by examining exclusively subjects without diabetes, not type 2 diabetes.
In a study comparing the PK and PD properties of glargine and biphasic insulin aspart, 32 12 patients with type 2 diabetes were randomized to treatment with 0.25 U/kg biphasic insulin aspart (twice a day 12 h apart) or 0.50 U/kg insulin glargine given at 08:30 h. A much flatter post-injection profile was observed following insulin glargine than after each injection of biphasic insulin aspart, whose GIR increased, reaching a distinct peak approximately 3–5 h post-injection. 32
More recently, the dose–response characteristics of insulin glargine have been evaluated in obese (body mass index 36±2kg/m2) patients with type 2 diabetes mellitus. 43 The study comprised a crossover design, during which the effects of five different, increasing doses (0, 0.5, 1.0, 1.5, or 2.0 U/kg) of glargine were investigated in 20 subjects, using the 24-h euglycemic glucose clamp technique, under the “first injection” condition. The data showed clearly that a single subcutaneous injection of glargine has a duration of action of at least 24 h, with no discernible peak action for increasing doses. In addition, glargine lowers plasma glucose by a predominantly hepato-specific action, without targeting muscle glucose uptake, in line with the concept that basal insulin in physiology exerts its effects primarily at the liver (hepato-specificity) and adipose tissue level. 43
Comparative PD findings were reported in a recent study comparing glargine with detemir in persons with type 2 diabetes. 30 This study involved a parallel-group design, with participants randomized to receive either glargine (n = 14; 0.4, 0.8, or 1.4 U/kg) or detemir (n = 13; 0.4, 0.8, or 1.4 U/kg) in random order, on separate days. 30 The overall shape of the GIR profiles was comparable among all three insulin preparations, and duration of action was increased with rising doses of all insulin preparations, without major differences between insulins. Nevertheless, the group given detemir had less evident suppression of endogenous insulin secretion at doses of 0.4 and 0.8 U/kg, which might have contributed to the apparently similar PD of the two analogs. Accordingly, the difference in plasma C-peptide might indicate either lower potency of detemir versus glargine or different baseline characteristics of the two groups. Endogenous glucose production was slightly higher with detemir than with glargine (0.4 U/kg, 295 ± 344 vs. 211 ± 265 mg/kg; 0.8 U/kg, 610 ± 563 vs. 519 ± 427 mg/kg). 30
However, as stated above, given the heterogeneity of individuals with type 2 diabetes mellitus, studies with a crossover design are needed to better examine the similarities and differences between the action profiles of basal insulins administered at clinically relevant doses.
This was done by Lucidi et al. 27 in a comprehensive study that compared PK/PD of detemir, glargine, and NPH in persons with type 2 diabetes, in a crossover fashion, at steady state, and at therapeutic doses (0.4 U/kg). Insulin was injected subcutaneously at the usual time of everyday life (i.e., 22:00 h). Clamps were prolonged to 32 h, to more adequately describe duration of action of basal insulins. The study showed several remarkable differences among the three basal insulins at the level of glucose and lipid metabolism, and also in terms of suppression of pancreatic islet α- and β-cell function.
Regarding glucose metabolism (Fig. 4), glargine shows a greater potency versus NPH, and to a greater extent versus detemir, with an overall insulin activity (GIR [area under the curve for 0–32 h was the primary end point of the study]) greater with glargine than NPH by 31% and detemir by 42%. However, the study points out also qualitative differences in terms of time course among the three insulins. 27 After subcutaneous injection at 22:00 h, NPH exhibits a peak activity at about 04:00 h, mirroring the risk of nocturnal hypoglycemia. Subsequently NPH decreases in activity to a nadir at about 09:00 h (Fig. 4). This is commonly referred to as the “dawn phenomenon.” Conversely, both insulin glargine and detemir do not show peak activity overnight, with virtually no change in insulin activity/plasma glucose at that part of the day. However, in the second half of the study, from 14:00 h on, GIR requirements for NPH and glargine are greater than those for detemir up to the end of the study. Likely, this was the combined effect of longer activity of NPH and glargine compared with detemir, along with afternoon increased insulin sensitivity in type 2 diabetes (Fig. 4). All basal insulins are hepato-specific because at their clinically relevant doses, the insulin effect on glucose metabolism results in suppression of endogenous glucose production, not stimulation of glucose utilization (Fig. 4). Glargine has greater effects on suppression of lipolysis than NPH and detemir. Compared with detemir only, glargine causes more suppression of C-peptide and glucagon concentrations. In addition, it has a longer duration of action with lower variability across subjects. 27 Indeed, a post hoc data analysis performed on the same study demonstrated another finding suggesting the importance of the crossover design in this population. As expected, GIR of basal insulins was inversely correlated with adiposity, expressed by body mass index, although a statistical significance was achieved only with detemir. Among the three insulins examined, detemir exhibited the lowest PD action and weakest effect in restraining endogenous glucose production as adiposity increases, compared with NPH and glargine. So, it is interesting that basal insulins appear to diverge in their glucose-lowering effect with increasing body mass index. 44
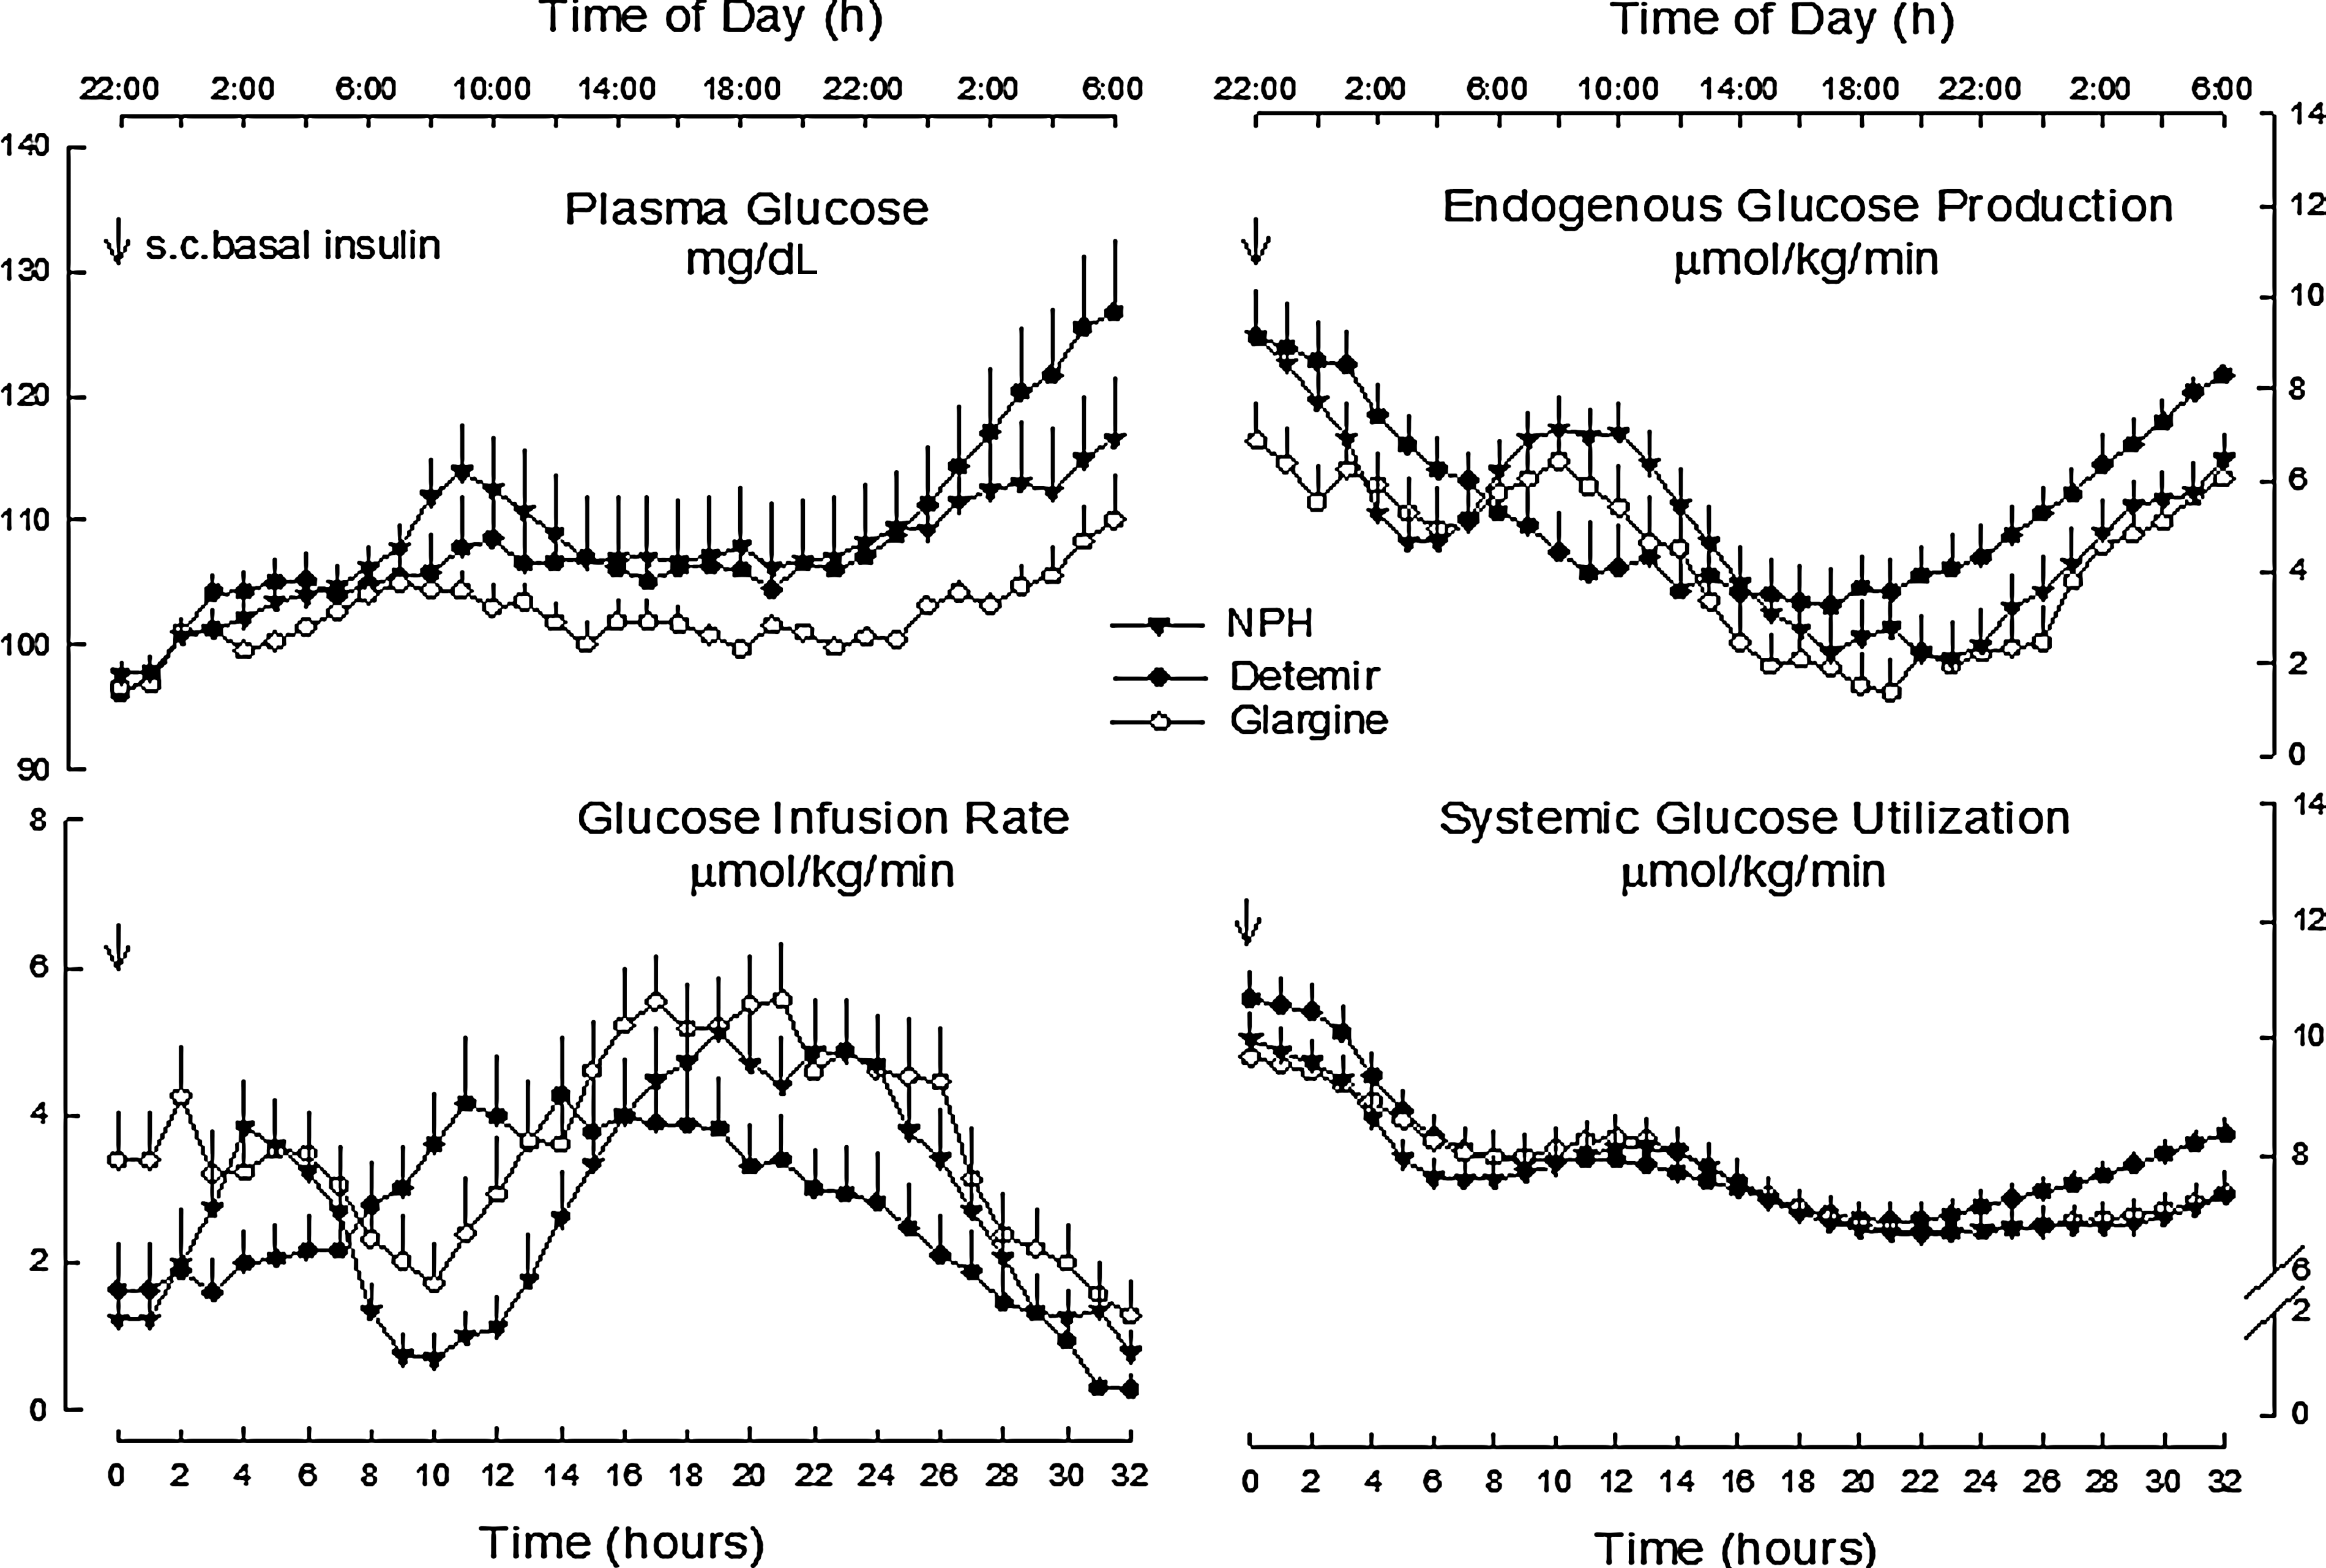
Plasma glucose, rates of glucose infusion, and rates of endogenous glucose output and utilization after subcutaneous (s.c.) injection of insulin NPH, detemir, and glargine. 27
Conclusions
The two long-acting insulin analogs, glargine and detemir, have represented clinically relevant advances over NPH in optimizing basal insulin substitution, thus making achievable tighter blood glucose control, without an increased hypoglycemic risk. Longer duration of the insulin effect and smoother action profile are shared by both analogs, as main benefits over NPH. However, findings, obtained from glucose clamp studies, clearly indicate that the two long-acting analogs differ in both their PK and PD profiles, with differences varying according to patients' metabolic and demographic characteristics.
Insulin glargine shows a greater metabolic activity and a longer duration of action compared with detemir, both in type 1 diabetes as well as in type 2, although to a lesser extent in the latter. The lower metabolic potency of insulin detemir translates into lower antilipolytic and antiketogenetic effects. These findings would suggest the need for a higher dose of insulin detemir and/or a twice-a-day administration in the majority of subjects with type 1 and in a large part of type 2 diabetes, to achieve an equivalent response in terms of glycemic control to that of glargine. It is notable that this is in line with what clinical data have consistently and repeatedly shown.
On the other hand, insulin detemir seems to have a lower within-subject variability in the metabolic effect, likely the expression of an intrinsic characteristic of albumin-binding insulin analogs.
While there is some disagreement, the most reliable and unquestionable argument in favor of the above observations comes from those studies in which once-daily insulin glargine, in a multiple daily injection regimen, has been compared with continuous subcutaneous insulin infusion, the “gold standard” of basal insulin replacement. 45 –48 Similar studies are indeed lacking for insulin detemir.
Footnotes
Author Disclosure Statement
F.P. and C.G.F. have received grants from various companies (Sanofi-Aventis, Eli Lilly, Bristol Meyer Squibb, Novartis, and Merck Sharp & Dohme) for participating at meetings and congresses. Both authors have received honoraria for scientific advising (Sanofi-Aventis and Eli Lilly). G.B.B. has received honoraria from Sanofi-Aventis, Eli Lilly, Mannkind, Merck Sharp & Dohme, and Novartis. F.P., G.B.B., and C.G.F. have no conflict to declare in relation to this review article.