
Abstract
The independent contribution of postprandial glucose (PPG) excursions to the overall glucose exposure and its role in the development of both micro- and macrovascular complications of diabetes remain subject to continuing debate in type 2 diabetes. Discussion continues on whether postprandial hyperglycemia is the main contributor to the overall hyperglycemia in fairly well-controlled individuals, whereas basal hyperglycemia becomes the preponderant contributor in poorly controlled patients. The concern about the role of PPG as a risk factor for diabetes complications is related to the controversial data obtained in individuals with impaired glucose tolerance. It remains, however, that the total glucose exposure as reflected by hemoglobin A1c (HbA1c) levels is an undoubted major vascular risk factor. Excluding the contribution of PPG is nonsensical. In support of this position is the fact that the absolute impact of PPG on HbA1c, expressed as percentage levels of HbA1c, remains constant at 1% across the HbA1c continuum in non–insulin-treated type 2 diabetes patients. This key feature clearly depicts the absolute contribution of PPG in contrast to its relative contribution and better explains why PPG contributes to the excess of glycation with the basal hyperglycemia.
Introduction
A few years ago, we reported 1 that the relative contribution of PPG to the overall hyperglycemia is particularly marked in well-controlled type 2 diabetes patients, whereas fasting plasma glucose becomes preponderant as glycemic control deteriorates. Therefore, these results suggest that attention should be paid to the management of PPG in patients who are relatively well controlled (hemoglobin A1c [HbA1c] <7–7.5%) in order to reach HbA1c less than 6.5% as currently recommended by the American Association of Clinical Endocrinologists and the International Diabetes Federation. 24,25 As striving to achieve tight glycemic control with near-normal concentrations of glucose is one of the main challenges in the treatment of patients with type 2 diabetes, 26 –29 it seems reasonable to implement therapies aimed at reducing PPG especially when prandial glycemic disorders are preeminent.
The development of new drugs such as incretin modulators and mimetics 30 –33 has expanded our therapeutic armamentarium by combining two favorable properties: a beneficial effect on PPG regulation and a minimal risk for hypoglycemia. However, several questions remain to be addressed, particularly those concerning the therapeutic approach to moderate PPG excursions in patients who exhibit unsatisfactory diabetes control. In such patients, it would be important to know whether the management of PPG excursions is optional, recommended, or mandatory. To answer to this question, it is necessary to know in which patients with type 2 diabetes PPG excursions are major contributors to the overall glycemic control. Recently members of the A1c-Derived Average Glucose study added further to the debate by questioning whether different methodologies for assessing PPG excursions contributed to the discrepancies observed in the literature. 2
In the present review, we try to gain an additional insight into this debate by first looking at the lessons provided by both physiological and pathophysiological studies and second by using accepted methodologies such as continuous glucose monitoring for estimating PPG contributions to overall glycemic control. The latter objective can be achieved by quantifying the absolute impact of PPG excursions on HbA1c at different levels of diabetes control. The present review is designed to address these issues.
How to Define PPG Increments? A Compromise Between What Is Observed in Normal Physiology and in Type 2 Diabetes
In diabetes patients, the postprandial state as defined by the period of hydrolysis and absorption of dietary carbohydrates has no reason to be different from what is observed in individuals without diabetes except when gastric emptying is delayed. The mean duration can be set at approximately 4 h after the beginning of a meal. 34,35 However, the PPG excursions are greater and of longer duration in subjects with diabetes than in individuals without diabetes. 36,37 The discrepancies between the duration of physiological versus pathophysiological PPG excursions raise questions as to which method should be used for assessing PPG increments. As increments should integrate both the magnitude and duration of PPG excursions, the area under the curve (AUC) above a baseline value seems to be the most appropriate approach. Therefore, the calculation of the vertical component of glucose excursions requires defining what we mean by a baseline value. As in diabetes patients daytime preprandial values are different from the fasting values measured after a 12-h overnight fast 37 (Fig. 1), the best method for assessing postprandial excursions is to set the baseline value for each meal at the level of the preprandial value (i.e., the level observed just before the beginning of the meal) (Fig. 1). In addition, the calculation of the horizontal component requires defining the time interval during which AUC of glucose concentration should be calculated. One of the two main options that can be proposed is determining the moment at which the glycemic profile returns to baseline, but this time is subject to inter-meal, inter-patient, and inter-day variability. 36,37 In an attempt to avoid such uncertainties in the determination of the most appropriate interval of time during which the calculation of AUC should be performed, the best option, even though not ideal, is to take as reference the definition of postprandial states (i.e., the 4-h period of hydrolysis and absorption of dietary carbohydrates 34 ), provided that the time interval between two consecutive meals is greater than 4 h.
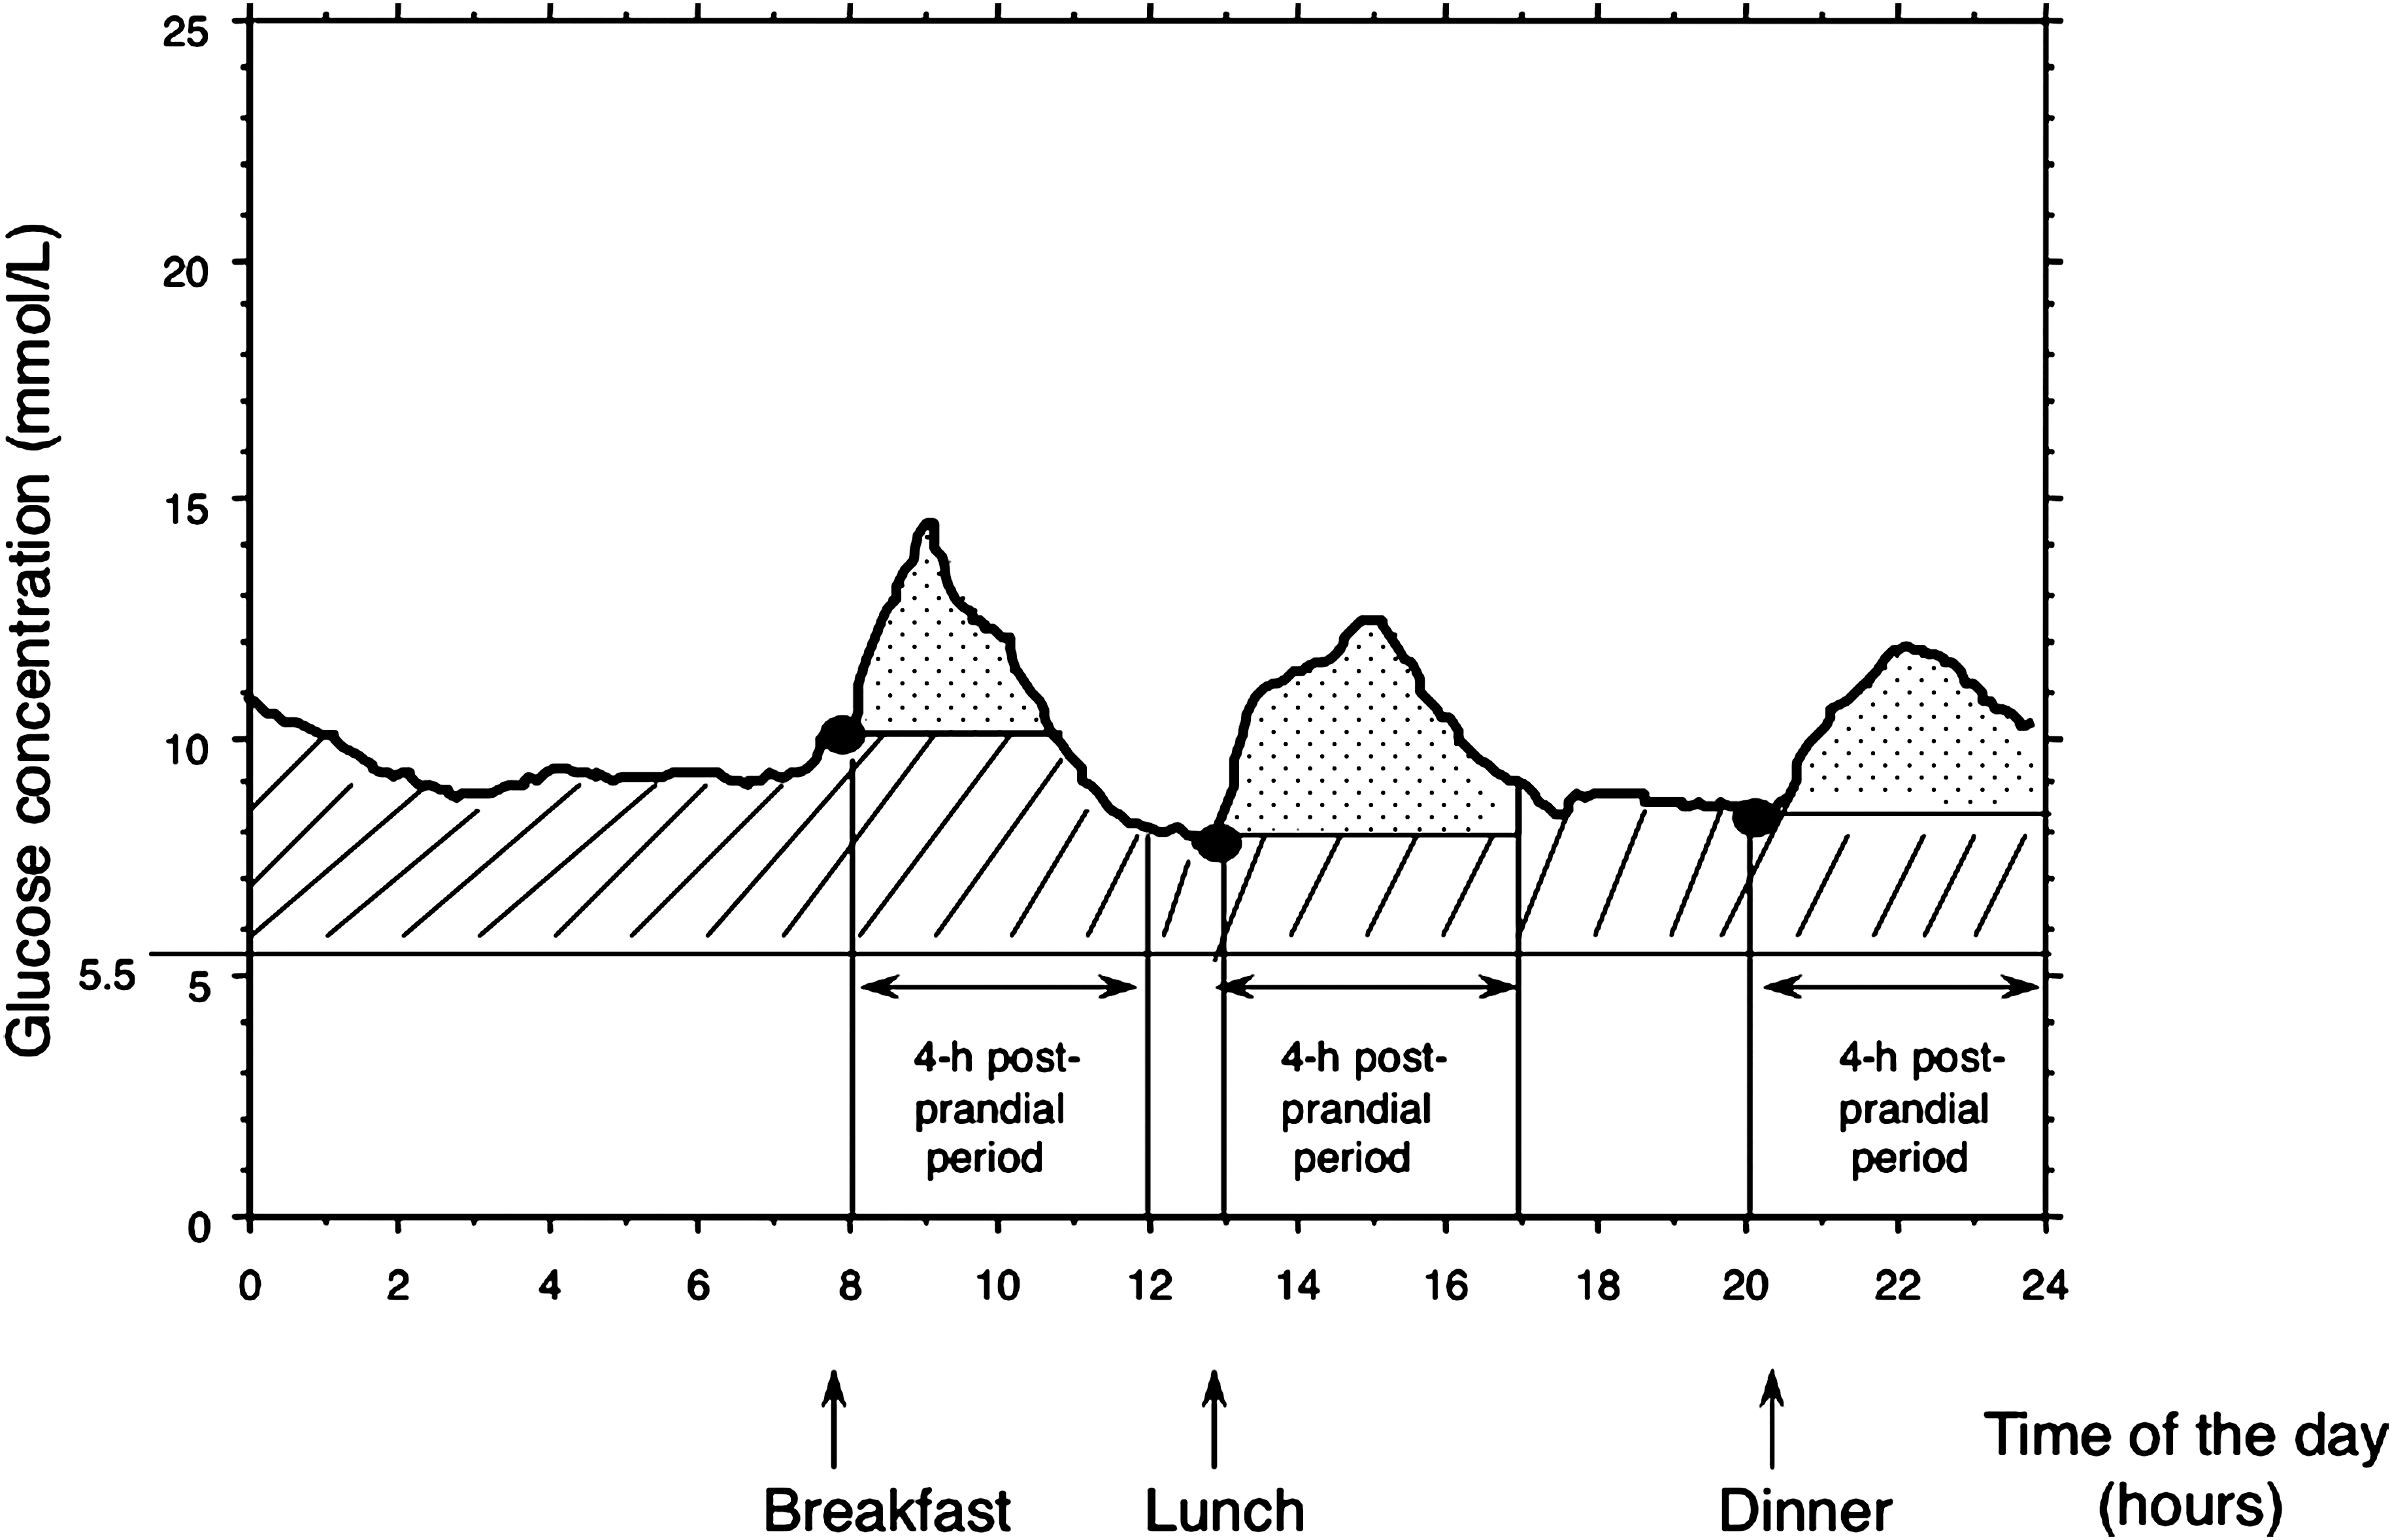
Postprandial glucose excursions are assessed by calculating the areas under the curve over a 4-h period after the beginning of each meal and above each baseline (premeal) value. Postprandial and basal hyperglycemias are indicated by the dotted and hatched areas, respectively.
Besides Postprandial Hyperglycemia: Basal Hyperglycemia, the Second Component of Glucose Exposure
The above-mentioned preliminary remarks on the definition of postprandial hyperglycemia lead to the second component (i.e., the basal hyperglycemia). It is commonly accepted that the glycemic control of patients with type 2 diabetes proceeds from a complex “alchemy” in which the respective contributions of postprandial and basal hyperglycemia have been a subject of debate.
38
–40
HbA1c, the “gold standard” for assessing glucose homeostasis, is an integration of both prandial and basal glucose variations over a 3-month period.
41,42
From a mathematical point of view, the theory can be formulated as follows:
43
where prandial G(t) and basal G(t) are the time courses of basal glucose and PPG, respectively.
In clinical practice, the glycemic control of persons with type 2 diabetes can schematically be depicted by the “glucose triad” whose components include HbA1c and prandial and basal glucose levels. At present, it seems that the best assessment of glycemic control is provided by determination of all of the three above-mentioned components. Recommendations that have been published by professional organizations in different countries for the three parameters not only differ across the world, but also within the same country. 44
The next question to be raised is to define the word “basal hyperglycemia.” Basal hyperglycemia is the component that remains after the prandial hyperglycemia has been subtracted from the overall hyperglycemia. In subjects with diabetes, this corresponds to the overall additional glucose exposure above the physiological glucose exposure as observed in normal individuals. If the overall normal glucose exposure is defined by an HbA1c lower than 5.7%, according to the new standards that were published by the American Diabetes Association in 2010, 26 the proportion of HbA1c above 5.7% corresponds in diabetes patients to the overall additional hyperglycemia, which can be further divided into its two subcomponents: the prandial and basal hyperglycemia. As soon as these two components of hyperglycemia were identified, diabetologists have paid increasing attention to their respective contributions to the overall hyperglycemia in persons with type 2 diabetes. 1 –3 The recent development of new therapies specifically aimed at reducing PPG 30 –33,45 –47 has further increased the interest for studying the complex relationship between the contributions of prandial and basal hyperglycemia.
Lessons from Noncontinuous and Continuous Glucose Profiles
Many data have provided information for the ongoing debate as to whether fasting glucose and PPG contribute or not in an equivalent manner to the overall hyperglycemia in type 2 diabetes. 1,16,48 –51 We have observed that post-lunch and extended post-lunch plasma glucose values in non–insulin-treated type 2 diabetes patients correlated better with overall glycemic control represented by HbA1c than did pre-breakfast and pre-lunch glucose levels. 48 However, in similar patients, Bonora et al. 49 reported that plasma preprandial glucose concentrations were more strongly related to HbA1c than postprandial concentrations, whereas Rohlfing et al. 51 reported that a better correlation with HbA1c was obtained for post-lunch and mean daily glucose concentrations. More recently, Borg et al., 2 using the results of the A1c-Derived Average Glucose study, 52 concluded that preprandial glucose values had a larger impact on HbA1c levels than postprandial values. These study-to-study discrepancies are clearly due to the fact that simple or multiple regression analysis is not appropriate for studying the relative contributions of fasting glucose and PPG to overall hyperglycemia represented by HbA1c. This is not surprising because it is well recognized from a statistical point of view that establishing a relationship between a dependent variable and several explanatory variables is not permitted when the latter are intercorrelated. In the above situation, HbA1c level is the dependent variable, and glucose values at different time points are the explanatory variables that are intercorrelated for obvious reasons. As a consequence, it is necessary to use other methodologies. Measurement and comparison of incremental area under noncontinuous or continuous glucose profiles have rapidly emerged as the most appropriate approaches for solving the question of the respective contributions of basal and prandial hyperglycemia.
The Four-Point Diurnal Glycemic Profile: A Tool for Integrating the Different Daytime Periods and for Calculating the Contributions of Fasting and Prandial Glucose
The rationale of the four-point glycemic profile was designed to assess blood glucose concentrations during the fasting (at 8 a.m.), postprandial (at 11 a.m. and 2 p.m.), and postabsorptive (at 5 p.m.) periods. 1 The relative contributions of fasting and postprandial hyperglycemia to the overall hyperglycemia were assessed over the diurnal period of daytime by using a calculation previously described. 1 From the analysis of the four-point glycemic model, we found that whatever the quality of the diabetes control, PPG made a substantial contribution to the overall hyperglycemia. However, when patients were divided into five subgroups, according to the quintiles of HbA1c, we found that PPG levels made the highest contribution (70%) in the lower quintile (HbA1c <7.3%) (i.e., in patients with well to moderately controlled diabetes). 1 By contrast, fasting hyperglycemia appeared as the main contributor to the overall diurnal hyperglycemia in patients with more poorly controlled disease (HbA1c ≥9.3%). 1 For all patients who had HbA1c levels ranging between 7.3% and 9.3%, the contributions of fasting and postprandial hyperglycemia were approximately equivalent. These results summarized in Figure 2 reconcile the controversy observed in the literature. It can therefore be concluded that the relative contributions of fasting glucose and PPG to the overall hyperglycemia (HbA1c) can be depicted by a continuous spectrum from fair to poor control in subjects with type 2 diabetes. As these findings were subject to discordant interpretations and opinions, 2,53 the contribution of PPG must be determined using unquestionable calculations made from the data of continuous glucose monitoring.
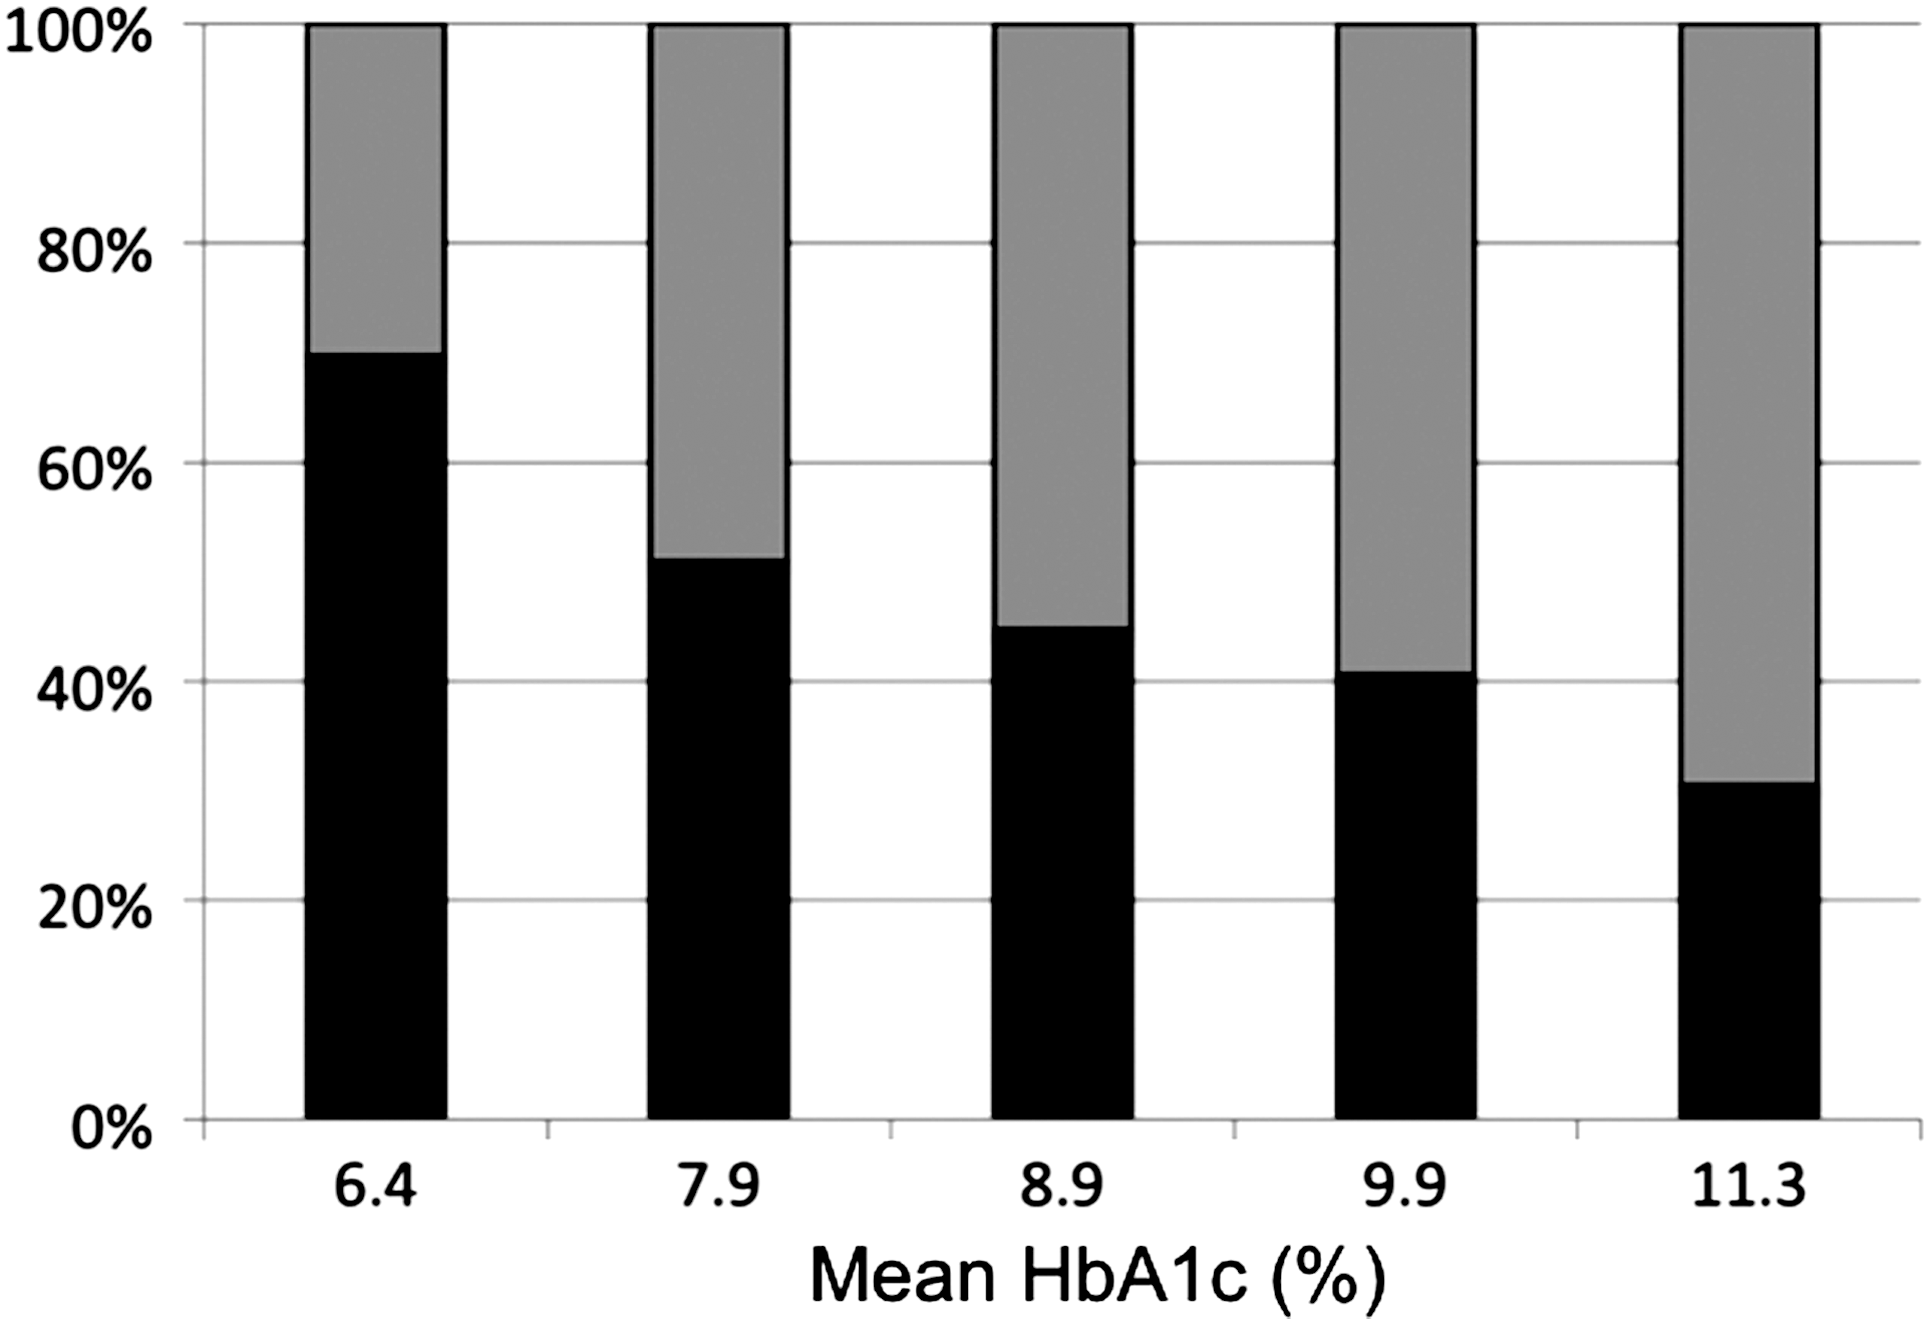
Relative contributions of fasting (gray columns) and postprandial (black columns) hyperglycemia to the overall hyperglycemia (expressed as percentages) over the diurnal period of daytime with worsening diabetes in non–insulin-using type 2 diabetes patients. Adapted from Monnier et al. 1 The determinations were made by calculating the area under a four-point glycemic profile with blood glucose sampling at 8:00 a.m. (pre-breakfast), 11:00 a.m. (late post-breakfast), 2:00 p.m. (post-lunch), and 5:00 pm (extended post-lunch). HbA1c, hemoglobin A1c.
Continuous Glucose Monitoring: An Improved Tool Calculating the Contributions of Basal Glucose and PPG to Overall Hyperglycemia
The use of such new technologies as continuous glucose monitoring systems 54 has permitted us to confirm the earlier findings using the four-point glycemic profile. By analyzing the 24-h glucose profiles of non–insulin-treated type 2 diabetes patients investigated at different levels of HbA1c, we observed that the deterioration of glucose homeostasis progressed from predominantly postprandial to fasting hyperglycemia, following an approximate three-step process. 37 A near-normal glycemic profile was observed only in patients with HbA1c <6.5%, supporting the recommendations of both the International Diabetes Federation 25,55 and the American College of Endocrinology/American Association of Clinical Endocrinologists. 24,56 Moreover, once HbA1c levels were elevated beyond 6.5%, a deterioration of the glycemic profiles was observed, 37 represented by an abnormal elevation of postmeal glucose levels alongside pre-breakfast glucose levels within the normal range, provided that the HbA1c did not exceed 7%.
The second step in the natural history of type 2 diabetes relates to the period that corresponds to the “dawn phenomenon” 57 and the “extended dawn phenomenon,” when there is an overproduction of glucose overnight by the liver. 58 This deterioration was evident when HbA1c levels ranged from 7% to 8%. Initially, there is a steady and progressive increase in glucose levels at the end of the nocturnal period and, second, by sustained post-breakfast glucose excursions over the entire morning period.
The final and third step was observed in patients with HbA1c >8% characterized by accentuated hyperglycemia during both the diurnal and the nocturnal periods. Furthermore, in most of the subgroups, we found that the postmeal glucose excursions were more marked after breakfast than after either lunch or dinner, indicating that postmeal glucose excursions are not equivalent throughout a normal day.
These observations highlight the difficulty of reaching a consensus in terms of PPG targets. We need to remember that the basal and fasting hyperglycemia states are different and that the calculation of postprandial increments should not be limited to postprandial excursions above fasting but should be extended to postprandial increments in excess of preprandial values at breakfast, lunch, and dinner.
Without due consideration to the above arguments and by using a seven-point noncontinuous glycemic profile based on self-monitoring of blood glucose before each meal, at 2 h after meals and at bedtime, Riddle et al. 53 recently suggested that the PPG contribution to the overall hyperglycemia is much more less than seen in our previous observational studies. The contribution of PPG excursions was determined by calculating the area under the glycemic profile above the pre-breakfast glucose value (baseline). Basal hyperglycemia was assessed from the area comprised between the baseline value as defined above 100 mg/dL (upper limit of normal according to the new standard of the American Diabetes Association 26 ). Despite inter- or intra-individual variations due to fluctuations in patients' habits, 37 the mean pre-lunch and pre-dinner values are usually lower than the mean pre-breakfast value in people with type 2 diabetes, especially when treated with oral hypoglycemic agents alone (Figs. 1 and 2). As a consequence, the PPG contribution is underestimated. In addition, these authors used the 2-h postmeal glucose as the peak value for calculating postprandial excursions.
By using a continuous glucose monitoring system, we have demonstrated that the postmeal glucose peak occurs earlier and that the maximal value is usually observed from 60 to 90 min after the beginning of the meal, especially at breakfast (Fig. 1). 37 It is therefore not surprising that the contribution of PPG was reduced.
Last but not least, intriguing and discordant results were observed in patients with an HbA1c <8% according to whether they were investigated before or after the introduction of a basal insulin therapy. The relative contribution of PPG was only 24% in the first situation, increasing to 58% after 24 weeks on insulin. These findings could be due to the fact that the seven-point glycemic profile did not provide any information during the nocturnal period, especially at the time of the dawn phenomenon. Therefore we conclude that the continuous glucose monitoring represents an essential tool for evaluating the relative contributions of basal glucose and PPG to overall hyperglycemia over a 24-h period. In addition, the continuous glucose monitoring has permitted a readjustment of the time frame of PPG and setting its optimal testing at 90 min after the beginning of a meal instead of 120 min, as used previously. 55
Assessments of the Absolute Impact of PPG Increments on HbA1c
The overall glucose exposure in a given individual can be estimated by calculating the total area under the 24-h glycemic profile above zero: AUCTotal. Postprandial increments (i.e., AUCpp) were measured as discussed above, by calculating the AUC above the preprandial value over a 4-h period after the start of each meal. 59,60 Accordingly, the absolute impact of PPG increment to HbA1c can be defined as the proportion of HbA1c (total glucose exposure) due to the PPG exposure using the following simple equation: HbA1c × (AUCpp/AUCTotal).
This mathematical approach was applied to the investigation of the 140 non–insulin-using individuals with diabetes who were included in our previous study published in 2007 in Diabetes Care. 37 The subcutaneous interstitial glucose was continuously monitored on an ambulatory basis over a period of 3 consecutive days. 59,60 The patients were divided into five subgroups according to HbA1c levels 60,61 and by using the same criteria as in the publication of 2007. 37 As illustrated in Figure 3, 59,60 in all groups of patients who had an HbA1c level >6.5%, the absolute impact of PPG excursions on HbA1c was constant at approximately 1%. The absolute contribution of PPG excursions was found to be less at 0.7% in those who were well controlled with an HbA1c level <6.5%. The fact that the absolute impact of PPG on HbA1c remains essentially constant at 1% across all groups of non–insulin-treated type 2 diabetes patients with HbA1c ≥6.5% provides a simple and generalizable description of the contribution made by the PPG excursions to the overall glucose exposure.
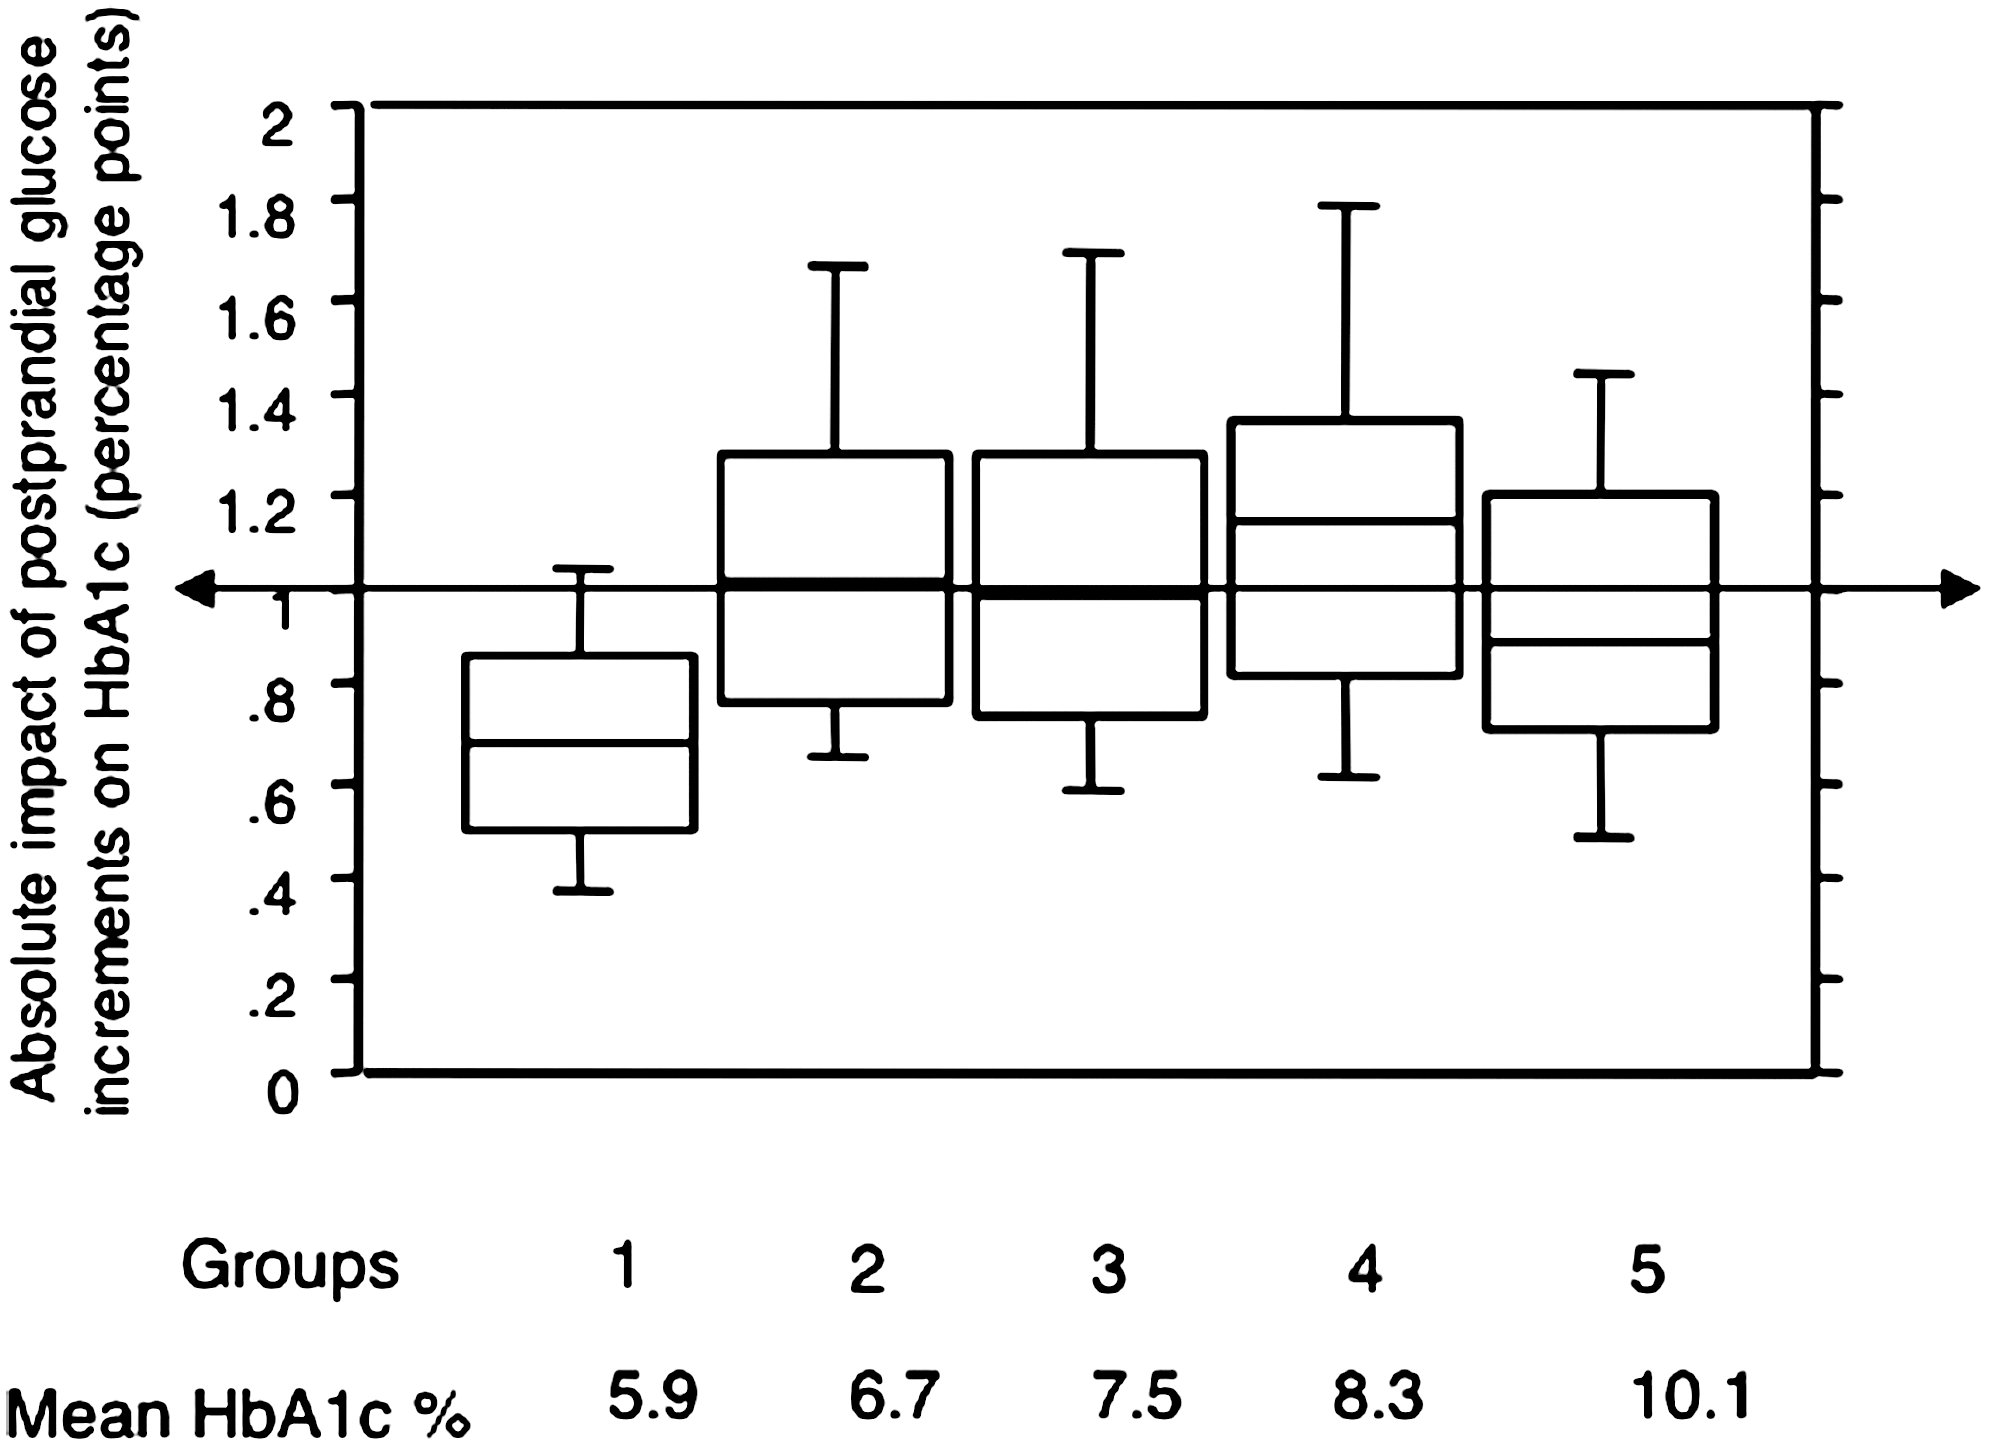
Absolute impact of postprandial glucose increments on hemoglobin A1c (HbA1c) (percentage points, medians with interquartile ranges, 10th and 90th percentiles) with worsening diabetes in non–insulin-using type 2 diabetes patients. Data are from Monnier et al. 59,60 The determinations of postprandial glucose area under the curve (AUCpp) were made according to the method depicted in Figure 1. The overall glucose exposure was estimated by calculating the total area under the glycemic profile above zero (AUCTotal). The absolute impact of postprandial glucose to HbA1c is defined as the proportion of HbA1c due to the postprandial glucose exposure: HbA1c × (AUCpp/AUCTotal). The patients were divided into five subgroups according to their HbA1c levels: group 1, <6.5%; group 2, 6.6–6.9%; group 3, 7–7.9%; group 4, 8–8.9%; and group 5, ≥9%.
Furthermore, calculating the absolute impact of PPG to overall glucose exposure represents a real advantage because the overall glucose exposure is calculated from the area above zero. This calculation does not require any assumption on the definition of the upper limit of normal for basal (fasting) glucose and HbA1c. By contrast, the assessment of the relative contribution is dependent on the levels chosen for the fasting plasma glucose. This fact can lead to inconsistent results. 2 For instance, the contribution of basal glucose can be either overestimated or underestimated according to whether the upper limit of fasting plasma glucose is set at 100 mg/dL (new definition) 26 or at 110 mg/dL (before 2003). 61
These remarks do not exclude the use of the term relative contribution for clinical practice purposes. Consider the overall hyperglycemia as the glucose exposure above the normal glucose exposure in individuals without diabetes that can be defined as 5.7% in terms of HbA1c according to the new standards of the American Diabetes Association. 26 The total glucose exposure above normal can be further divided into its two components: the absolute prandial hyperglycemia (AUCpp) and basal hyperglycemia. One can easily understand that the relative contribution of PPG to the overall hyperglycemia decreases progressively with increasing HbA1c.
A very simple theoretical calculation can help for demonstrating such a statement. Consider five subgroups of patients at different levels of mean HbA1c 7%, 8%, 9%, 10%, and 11%, respectively, and assume that 5.7% is the upper limit of normal HbA1c in persons without diabetes. 26 As the PPG contributes 1% to the HbA1c level in all these five subgroups, 59,60 the relative contributions of PPG (as a percentage) to the overall hyperglycemic increment is 77% (1/[7 − 5.7] × 100) in the first subgroup, 43% (1/[8 − 5.7] × 100) in the second, 30% (1/[9 − 5.7] × 100) in the third, 23% (1/[10 − 5.7] × 100) in the fourth, and 19% (1/[11 − 5.7] × 100) in the fifth. The relative contributions of basal hyperglycemia, expressed as percentage of the overall hyperglycemia, can be easily calculated by differences (100 − relative PPG contribution) (Fig. 4). These contributions are close to those found in the work that we have published in 2003 (Fig. 2). 1 All these observations confirm that the relative contribution of PPG is predominant in patients exhibiting a more satisfactory level of diabetes control based on HbA1c, whereas basal glucose becomes the major contributor in poorly controlled diabetes patients.
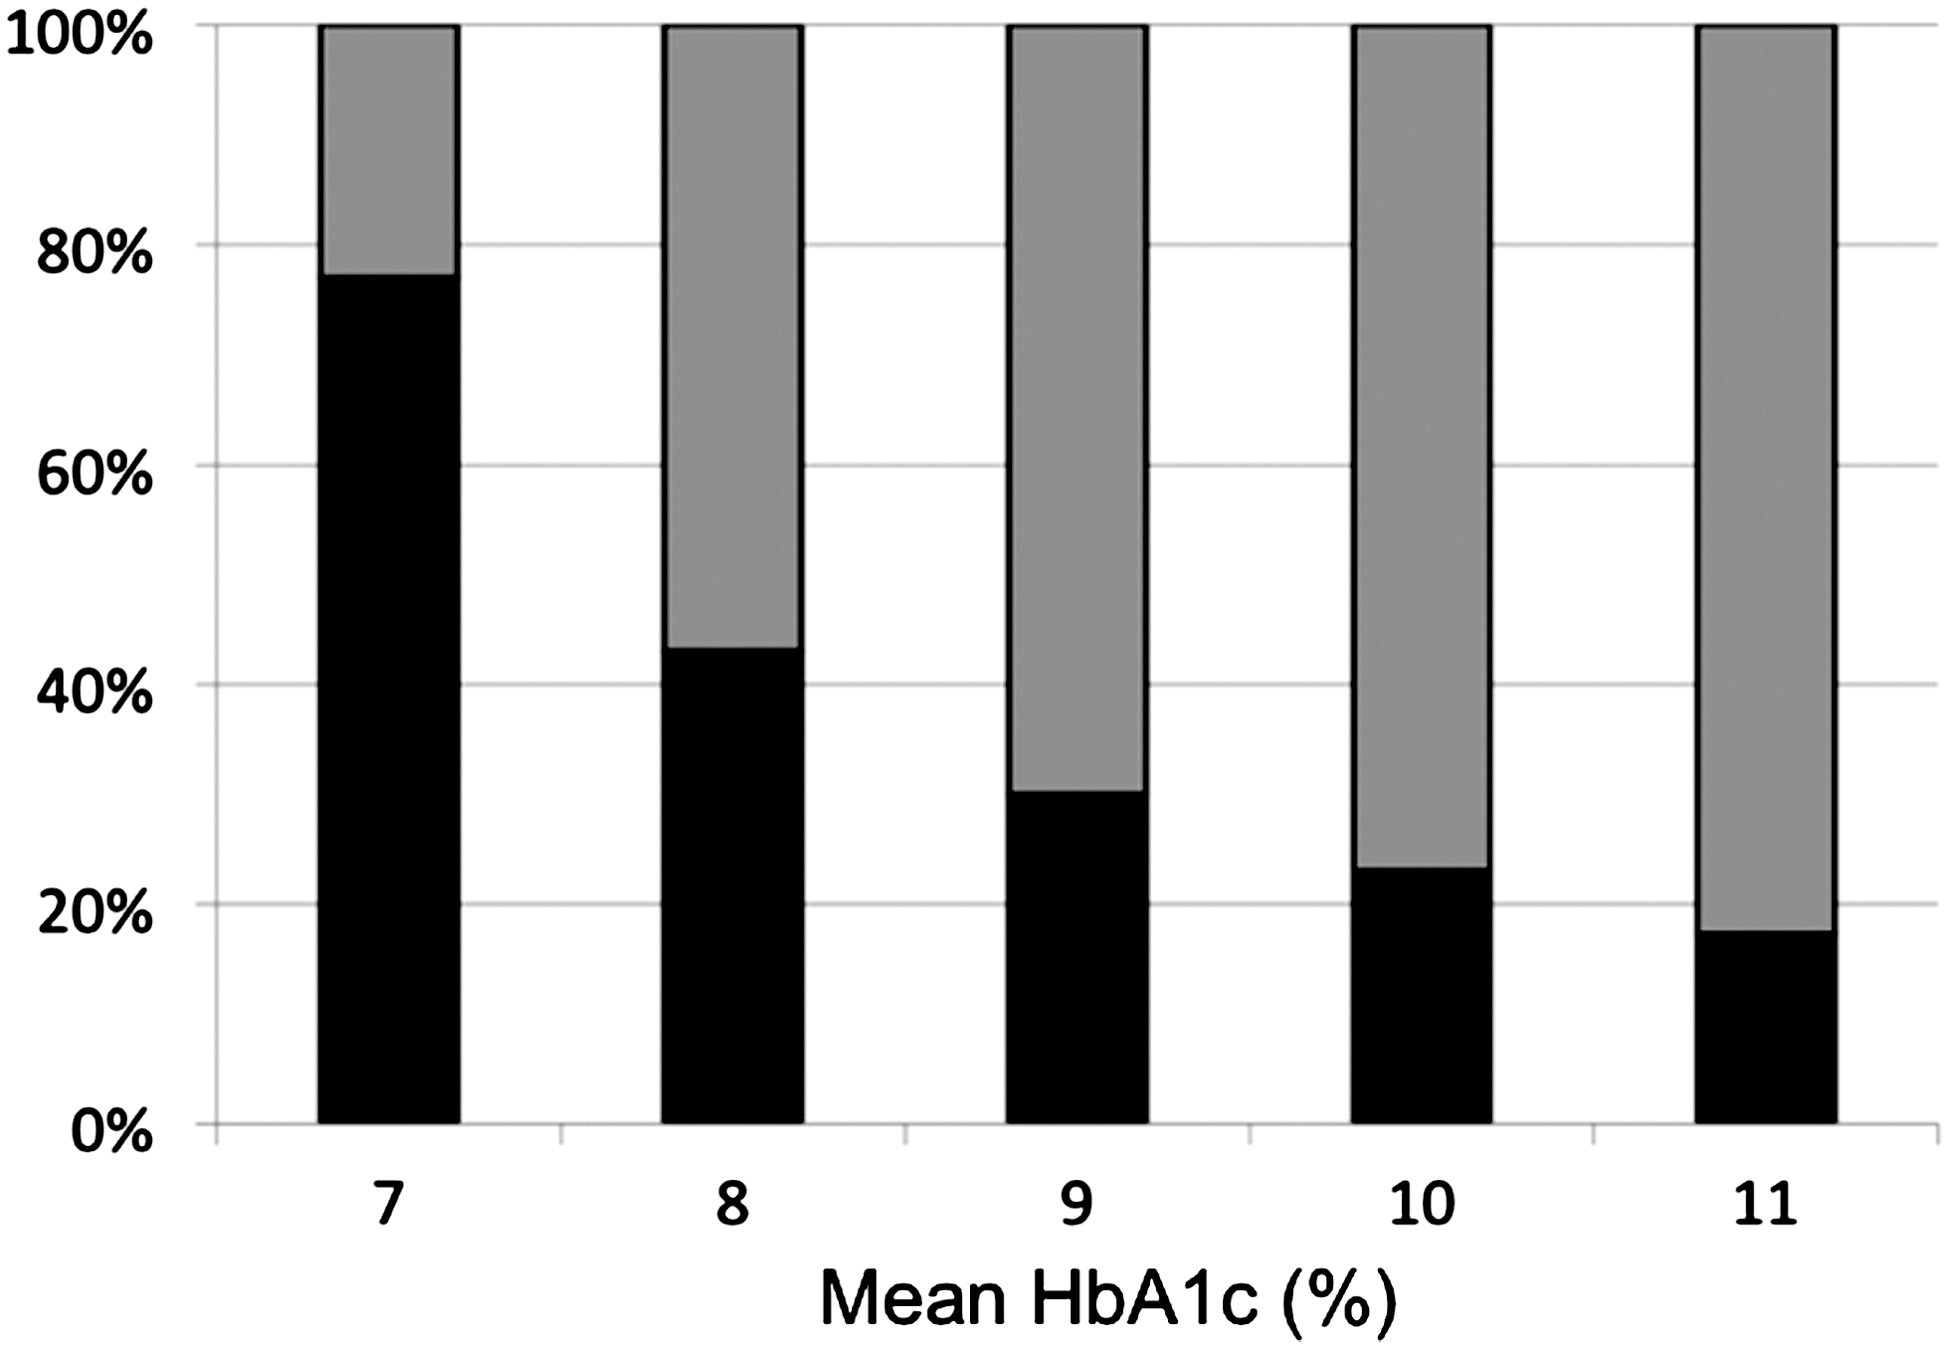
Theoretical relative contributions of basal (gray columns) and postprandial (black columns) hyperglycemia (expressed as a percentage of overall additional hyperglycemia) at different levels of hemoglobin A1c (HbA1c): 7%, 8%, 9%, 10%, and 11% (authors' unpublished data). The upper limit of normal for HbA1c was set at 5.7%. The impact of the overall additional hyperglycemia expressed as a percentage of HbA1c in a given diabetes patient was assessed from the difference between the HbA1c level and 5.7%. As the absolute impact of postprandial glucose (as a percentage value of HbA1c) is constant at 1% across the continuum of HbA1c levels, as soon as HbA1c is greater than 6.5%, the relative contribution of postprandial glucose (as a percentage) can be expressed as (1/[HbA1c −5.7]) × 100. The relative contribution of basal hyperglycemia (as a percentage) is calculated by difference: 100 − relative postprandial glucose contribution (%). This figure should be compared with Figure 2.
Even though it has been demonstrated that the oxidative stress is activated during glycemic excursions (e.g., postprandial states 12,62,63 ), some diabetologists continue to question the possible deleterious effects of both glucose variability and postprandial hyperglycemia. 64 The potential impact of a consistent 1% increase in HbA1c by postprandial surges is far from being negligible when we consider that a 1% reduction in HbA1c has been found to be associated with a reduced risk of 14% for myocardial infarction and 37% for microvascular complications. 65 The role of PPG excursions as an important component factor of glucose exposure, and thus of excessive glycation, cannot therefore be refuted, even by those who deny that oxidative stress, a consequence of excessive glycemic excursions, has no part to play in the pathogenesis of vascular diseases. 64 We therefore consider that the 1% absolute impact of PPG on HbA1c is one of the key features of hyperglycemia in subjects with non–insulin-requiring type 2 diabetes with an HbA1c between 6.5% and 7.5%. Further deterioration in glycemic control is accompanied by a constant absolute but a diminishing relative contribution by PPG to HbA1c levels. Ignoring all these aspects would be prejudicial for implementing treat-to-target therapies.
Returning to the question of “What are the respective impacts of postprandial and basal glucose in type 2 diabetes?,” there is “consensus” that HbA1c represents a major risk factor for the development or progression of diabetes complications. There is, however, continuing dissent about the role of PPG. It should be noted that the NAVIGATOR study was conducted in individuals with impaired glucose tolerance and treated with nateglinide, a drug that failed to improve glucose excursions after an oral glucose challenge. 20 As a consequence it remains hazardous to extrapolate such results to the situation of persons with frank type 2 diabetes. Confirmation or refutation of the role of PPG in diabetes will arise from future long-term studies with such drugs as incretin modulators or mimetics that directly target PPG in persons with type 2 diabetes. For the moment, the HEART2D trial 66 remains the only well-controlled prospective study that has attempted to evaluate the effects of either basal and prandial insulin regimens on such “hard” outcomes as prevention of additional cardiovascular events after acute myocardial infarction in patients with type 2 diabetes. The two insulin regimens caused similar falls in HbA1c, and no difference in cardiovascular events was detected between the two groups treatments. As a consequence, the debate remains wide open, 67 and further studies are certainly warranted to know whether it is more appropriate to target basal or prandial hyperglycemia. The clinical practice seems to indicate first that the best approach is to target both glycemic disorders and second that the decision for choosing the most appropriate therapy should be taken at an individual level according to the glycemic profile of the patient.
Footnotes
Author Disclosure Statement
All authors declare no competing financial interests.