
Abstract
Objective:
We evaluated effects of unmasking of continuous display of continuous glucose monitoring (CGM) on quality of glycemic control and glycemic variability.
Methods:
We reanalyzed CGM data from 85 patients using a 7-day glucose sensor. Glucose values were “masked” during the first week but “unmasked” during the next 2 weeks. We evaluated 48 criteria for quality of glycemic control, including mean glucose, SD, percentage of values within-, above- or below- specified ranges, Schlichtkrull's
Results:
Unmasking CGM displays resulted in rapid, highly statistically significant improvement in 29 indices, including percentage within, percentage above, and percentage below target range, mean glucose, SD, SD of daily means, MODD,
Conclusions:
Continuous access to display of CGM sensors dramatically improved 29 indices of glycemic control and glycemic variability.
Introduction
Continuous glucose monitoring (CGM) with real-time display of interstitial fluid glucose to the subject has been shown to significantly reduce hemoglobin A1C 1 –4 in individuals with both type 1 and type 2 diabetes, in both well- and poorly controlled subjects, and in patients using multiple daily injections or continuous subcutaneous insulin infusion. Garg and co-workers have previously shown that CGM with real-time display resulted in statistically significant changes in the glucose distribution, with reduced frequencies at extremely high and low values combined and increased frequency at the center of the distribution. 2,3 In view of concerns that glycemic variability might play a role in the pathogenesis of complications of diabetes 5 –11 and due to progressively increasing usage of CGM, there is need for improved methods to characterize variability in CGM data.
Methods
Data
Data were obtained from 85 patients who utilized a 7-day CGM sensor (SEVEN™ System, DexCom, Inc., San Diego, CA) for three consecutive 1-week periods. 2 Display of CGM data was masked during Period 1 but unmasked during Periods 2 and 3 and continuously available to the subject. Characteristics of the patients and details of the study protocol have been reported previously. 2
Measures of quality of glycemic control and glycemic variability
We computed 20 measures of quality of glycemic control and 28 measures of glycemic variability. Indices of glycemic control included the grand mean of glucose values,
12,13
the percentages of values above various thresholds (170, 200, or 250 mg/dL), below various thresholds (80 or 50 mg/dL), or within specified ranges (80–200, 70–180, or 80–140 mg/dL),
2
Schlichtkrull's
We also computed 28 measures of glycemic variability, including the overall SD (SD or SD
New measures of glycemic variability
Several types of SD values were calculated using a new approach based on the principles underlying analysis of variance.
16,17
We calculate: (1) an overall SD or SD
Statistical analysis
Results were available from 85, 84, and 83 subjects in Periods 1, 2, and 3, respectively. We performed an analysis of variance of the data to obtain estimates of several new types of SD.
16,17
We compared the results from the three periods using a general linear model to establish overall statistical significance, followed by Student's t tests (paired within individuals) comparing Periods 2 and Period 3 with Period 1. We used Wilcoxon two-sample tests to evaluate the robustness of results with respect to the need for assumptions regarding gaussianness of distributions. We used correlation coefficients and a correlation matrix to examine the interrelationships among the measures of quality of glycemic control and of glycemic variability (see Supplementary Appendix at
Results
A total of 365,533 glucose values were obtained of the maximally expected 495,936, or 74%.
Euglycemia
Figure 1A shows the change in percentage of glucose values within the ranges 80–200, 70–180, and 80–140 mg/dL after unmasking of the CGM sensor display in Periods 2 and 3 relative to the corresponding percentages during the control period, Period 1, when the sensor was masked. There was a rapid and highly statistically significant improvement: all three P values were <0.0001. The percentage improvement was slightly higher when using a relatively stringent criterion (80–140 mg/dL) rather than a relaxed criterion such as 80–200 mg/dL. There was a corresponding statistically significant increase (improvement) in the %GRADE
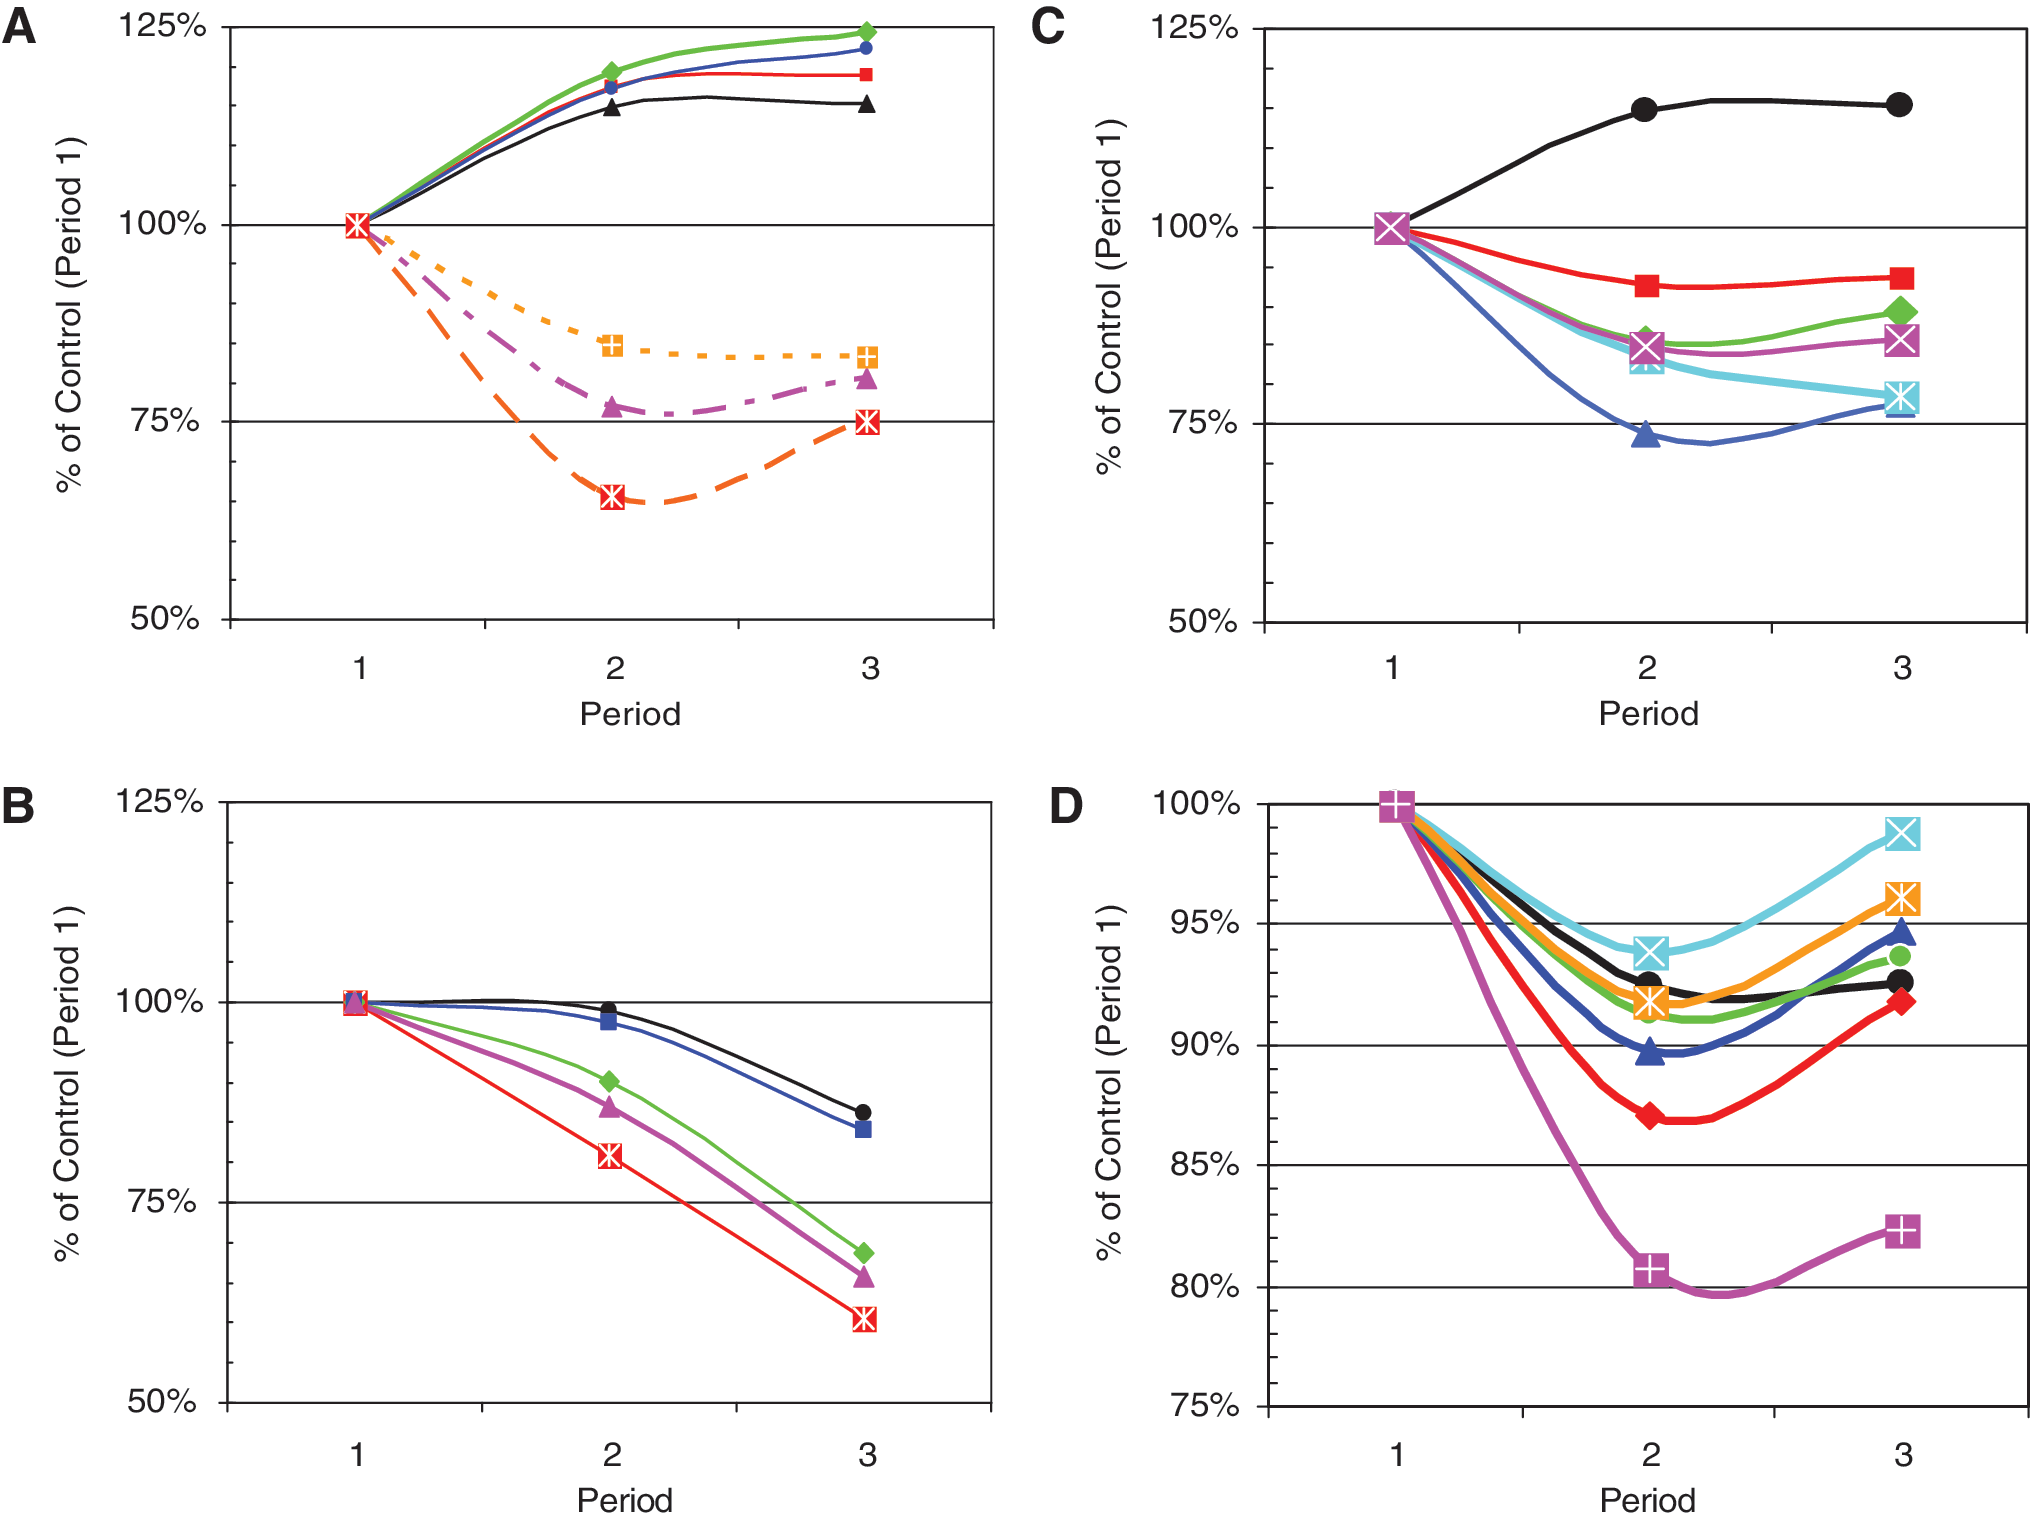
Response to unmasking of CGM sensor output during Weeks 2 and 3, expressed as percentage of corresponding value during the control period (Week 1). P values for paired comparisons (within individuals) between Period 1 and Period 3 are as indicated. (
Hyperglycemia
Figure 1A shows the reduction in percentage of hyperglycemic values using criteria of 180 and 250 mg/dL (P < 0.0001 and ∼0.01, respectively). There were corresponding decreases in the Hyperglycemia Index (P ∼ 0.001) and HBGI (P < 0.0001).
Hypoglycemia
Figure 1B shows the changes in measures of hypoglycemia in response to unmasking of the CGM display. We show results for percentage of glucose values <80 and <50 mg/dL. As was the case for hyperglycemia, using a more stringent criterion (<50 mg/dL) results in a larger percentage change relative to control (Period 1). We also examined the Hypoglycemia Index, LBGI, and %GRADE
Quality of glycemic control
Figure 1C shows the trends in several additional criteria for quality of glycemic control:
Glycemic variability
Figure 1D shows the response of several criteria for glycemic variability, including the “classical” measures MAGE and MODD, a recently introduced measure, CONGA
Figure 1 shows the results grouped by functional category (quality of glycemic control, glycemic variability). Results for all criteria examined, ranked in order of statistical significance, are summarized in the Supplementary Appendix, Tables A1 and A2, at
The results for 20 criteria for quality of glycemic control are summarized in the Supplementary Appendix, Table A1, at
There was a statistically significant improvement in 13 of the 28 criteria for glycemic variability when comparing Period 3 with Period 1 (see Supplementary Appendix, Table A2, at
Fifteen measures of variability did not show a statistically significant change between Period 1 and Period 3 (see Supplementary Appendix, Table A2, at
Interrelationships among criteria
We identified a number of relationships among the criteria being used for glycemic control and for glycemic variability. There was a linear relationship between percentage of values within the range 80–200 mg/dL and the five parameters:
The measures of glycemic variability within days are highly correlated among themselves and with the overall variability: there are high correlations among MAGE, CONGA
Discussion
Effects of continuous display of CGM
The present analysis demonstrates that the unmasking of continuous monitoring of glucose results in highly statistically significant improvement in many parameters of glycemic control (Fig. 1A–C) (see Supplementary Appendix, Table A1, at
The IGC and “percentage between 80 and 200 mg/dL” were the most sensitive criteria. The latter criterion is robust with respect to selection of target range despite its theoretical limitation that it does not consider the severity of departures of the glucose values outside the target range. In contrast, several other criteria (
Variability
Use of CGM with real-time display resulted in a reduction in total variability, SD
Differences in “sensitivity” of alternative criteria to detect changes
There were statistically significant changes in 29 of 48 parameters of glycemic control and glycemic variability when the display of glucose values was unmasked (see Supplementary Appendix, Tables A1 and A2, at
It would be advantageous if a criterion can combine information from both hypo- and hyperglycemic events. Criteria such as “percentage below 50 mg/dL” or “percentage above 180 mg/dL,” Hypoglycemia Index, Hyperglycemia Index, LBGI, and HBGI only consider one aspect of the glucose values. When these can be combined with the information reflecting the percentage of values in the target range and on the other side of the target range (as in
Comparison with previous methods of analysis
The present data set had been analyzed previously
2
using the frequency distribution of glucose values, examining the changes in the frequency of glucose values in the tails of the distribution. That analysis pooled results from multiple individuals. In the present approach, we use each individual subject as his or her own control. Many of the observed comparisons have Student's t values of 3, 4 or 5, corresponding to P values of P < 0.001 to P < 0.00001—truly impressive levels of statistical significance (see Supplementary Appendix, Tables A1 and A2, at
Explanations for the observed changes in variability
Using feedback from real-time CGM data, the patient can avoid excessively long or severe excursions into the hyper- or hypoglycemic regions, thus “trimming the tails” of the distribution. This will reduce variability between days (MODD, CONGA
The rank order of the
Clinical application of new measures of glycemic variability
The present study illustrates several concepts and introduces new terminology to help physicians and patients describe and utilize the information in complex glycemic patterns. These concepts can potentially help improve communication between physician and patient.
16,17
These approaches to measurement of glycemic variability are expected to be useful when evaluating therapeutic interventions, e.g., medical therapy, islet cell or pancreatic transplantation, or closed loop feedback control. One can monitor changes in individual patients using these criteria relative to their previous or baseline values, using each patient as his or her own control to monitor changes with time and responses to therapeutic interventions. It will be important to obtain normative data on multiple patient populations (e.g., type 1 and type 2 diabetes, patients using multiple daily injections or continuous subcutaneous insulin infusion, patients using various therapeutic regimens, and for patients with various levels of glycemic control as reflected in their hemoglobin A1C). One could then categorize patients as being in excellent, good, fair, or poor control in terms of a subset of the parameters shown in Figure 1 and in Supplementary Appendix, Tables A1 and A2, at
Selection of criteria to characterize glycemic variability
In view of the plethora of criteria that are currently available as augmented by the new methods described here
16,17
and the high degree of correlation among them (see Supplementary Appendix, Tables A3–A5 and Figs. A1–A4, at
Conclusions
Use of CGM with continuous display improves 29 indices of quality of glycemic control and glycemic variability, including improvements in mean glucose (Mean
Footnotes
Acknowledgments
The authors thank Bradley S. Matsubara, M.D. for many helpful suggestions. We thank Katherine H. Nakamura, Ph.D. for her excellence in computing the extensive and meticulous statistical analyses. Mr. Lucas Bohnett developed software for calculation of MAGE.
Author Disclosure Statement
David Rodbard, M.D. has served as a consultant to DexCom, Inc. Tim Bailey, M.D. has conducted clinical research studies and served as a speaker for DexCom, Inc. The original 2 and the present studies were supported by DexCom, Inc., San Diego, CA.
References
Supplementary Material
Please find the following supplemental material available below.
For Open Access articles published under a Creative Commons License, all supplemental material carries the same license as the article it is associated with.
For non-Open Access articles published, all supplemental material carries a non-exclusive license, and permission requests for re-use of supplemental material or any part of supplemental material shall be sent directly to the copyright owner as specified in the copyright notice associated with the article.