
Abstract
INTRODUCTION
A major worldwide health burden is caused by atopic dermatitis (AD), a chronic inflammatory skin disorder marked by intense pruritus and eczematous lesions. 1 Epidemiological data consistently demonstrate the rising prevalence of AD, especially in industrialized nations, affecting up to 20% of children and 10% of adults, with an increasing trend observed globally over the past few decades. 2 Lipid metabolism is essential for maintaining skin barrier integrity, and disturbances in lipid profiles have been linked to the pathogenesis of AD. 3 Studies have shown that patients with AD exhibit significant alterations in skin and systemic lipid composition, including abnormalities in ceramides, free fatty acids, and cholesterol, all of which are critical for maintaining the stratum corneum barrier.4B5 -7 This barrier dysfunction is believed to facilitate the penetration of allergens, microbes, and other environmental irritants, thereby triggering and exacerbating the inflammatory responses characteristic of AD. 8 Also, it has been confirmed that sweat metabolites and serum overlap in lipid profiles. 9 The correlation between lipid abnormalities and AD severity suggests that lipid metabolism plays a fundamental role in disease manifestation and progression.
Apolipoprotein B (ApoB) is a vital protein in lipid metabolism, serving as the primary structural component of atherogenic lipoproteins, including low-density lipoprotein (LDL), very low-density lipoprotein (VLDL), and intermediate-density lipoprotein (IDL). 10 ApoB is responsible for the assembly and secretion of these lipoproteins, which are crucial for the transport of lipids, including cholesterol, throughout the body. 11 Given the role of ApoB in lipid transport and metabolism, it is hypothesized that ApoB may influence skin lipid composition and thus contribute to the pathogenesis of AD. However, the direct relationship between ApoB and AD remains unclear and underexplored, with existing studies limited by small sample sizes and inconsistent findings.
The current study aims to address this gap in knowledge by leveraging data from the UK Biobank (UKB), a large-scale, prospective cohort study that includes over 450,000 participants from the general population. Understanding the association between ApoB and AD could open new avenues for intervention.
METHODS
Study Population
The study cohort was derived from UKB, a sizable prospective cohort that enrolled more than 500,000 people between the ages of 37 and 73 between 2006 and 2010. 12 To investigate the relationship between ApoB levels and the incidence of AD, we applied specific inclusion and exclusion criteria as detailed in Figure 1 of our study. The initial cohort consisted of 502,357 participants across the United Kingdom. Participants with a history of AD at baseline were excluded to focus on incident cases, resulting in a population of 491,958 individuals eligible for inclusion. This article is based on the UKB’s approved research no. 104784.

Flowchart of participant inclusion and exclusion criteria used to investigate the relationship between apolipoprotein B (ApoB) levels and atopic dermatitis (AD) incidence.
To ensure the accuracy and reliability of our findings, only those participants with complete records of blood-measured ApoB levels were included, further narrowing the study population to 457,351 individuals. Additionally, participants with missing demographic or clinical data, including Townsend deprivation index (N = 564) and body mass index (BMI) (N = 1,822), were excluded from the final analysis. Thus, the study population comprised 454,974 participants, with 3515 developing AD during the follow-up period, while 451,459 participants remained free of AD (Fig. 1).
Measurement of ApoB
Peripheral blood ApoB levels were measured using two complementary methods provided by the UKB: standard blood biochemistry and nuclear magnetic resonance (NMR) spectroscopy. Blood samples were collected at baseline, processed, and stored under standardized conditions. The biochemistry assays measured ApoB using immunoturbidimetric analysis on a Beckman Coulter AU5800, which quantifies ApoB levels as a component of total lipoprotein particles. 13 NMR spectroscopy was employed as a more detailed method to characterize lipoprotein particles, providing an alternative assessment of ApoB that reflects its role in lipid metabolism. 14 These dual measurements ensured the robustness and accuracy of the ApoB data used in our analyses.
Covariates
A range of covariates was included in the analysis to account for potential confounding factors. Demographic characteristics such as age, sex, and the Townsend deprivation index—a measure of socioeconomic status—were self-reported by participants at baseline. Lifestyle factors, including smoking status, alcohol consumption, and BMI, were also self-reported and collected during the baseline assessment. The UKB’s comprehensive dataset further allowed for the inclusion of comorbid conditions, which were self-reported and included cardiovascular disease, diabetes, cancer, and hypertension. The use of lipid-lowering medications, another critical covariate, was also self-reported by participants.
These covariates were selected based on their established associations with both lipid metabolism and AD, ensuring that our analysis accounted for a broad range of factors that could influence the relationship between ApoB and AD. The completeness and accuracy of the UKB data provided a robust basis for the inclusion of these variables in our models.
Follow-Up and Outcome Assessment
The follow-up period was defined as the time from baseline (ie, date of enrollment) to the first diagnosis of AD. Participants were followed longitudinally, with AD diagnosis records acquired through linkage with primary care records, a reliable and validated source of clinical outcomes in the UKB. AD diagnosis was primarily confirmed via hospital records from England, Scotland, and Wales, with additional cases linked to self-reports, primary care, and death registers.12,15 AD diagnoses (L20.8 and L20.9) were recorded using the International Classification of Diseases codes. The primary outcome of interest was the time to the first diagnosis of AD during the follow-up period. Participants who did not develop AD were censored at the time of their last follow-up, whichever occurred first.
Statistical Analysis
The statistical analysis was designed to rigorously evaluate the association between ApoB levels and the incidence of AD while controlling for the covariates mentioned above. The study population’s baseline characteristics were first summarized using descriptive statistics, stratified by ApoB levels (median) during follow-up. To evaluate group differences, continuous variables were compared using t tests, while categorical variables were compared using chi-square tests. To investigate the relationship between ApoB levels and the risk of developing AD, we employed Cox proportional hazards regression models. These models allowed us to estimate hazard ratios (HRs) for AD associated with ApoB levels, adjusting for potential confounders, including demographic factors, lifestyle behaviors, comorbidities, and medication use. Schoenfeld residuals were used to test the proportional hazards assumption, and interactions between ApoB and key covariates were explored to assess potential effect modification. We modeled a potential nonlinear link between ApoB levels and AD risk using restricted cubic splines (RCS). RCS offers a flexible approach to capture nonlinear associations, allowing for the identification of potential thresholds or plateaus in the risk associated with varying levels of ApoB. This method was particularly valuable given the hypothesized complex relationship between lipid metabolism and skin barrier function in AD. Subgroups and a series of sensitive analyses were also performed to duplicate the results of the main analysis, including comparing the effects of ApoA and ApoB, using NMR-measured ApoB to replace immunoturbidimetric ApoB, and further adjusting lipid medication uses. R software (version 4.0.5) was used for all statistical analyses, and a significance level of P < 0.05 was applied for all tests.
RESULTS
Baseline Characteristics
The baseline characteristics of the study population, which comprised 454,974 participants in total, are shown in Table 1. Based on their median ApoB levels, these participants were split into two groups: those with median ApoB levels below (n = 226,931) and those with median ApoB levels at or above (n = 228,043). The research participants’ average age was 56.55 years (±8.09), and the average age of those in the higher ApoB group was slightly older (56.98 ± 7.68) than those in the lower ApoB group (56.11 ± 8.46) (P < 0.001) (Table 1).
Demographic and Clinical Characteristics of the Patients With Atopic Dermatitis Stratified by Median ApoB Level
t test.
Chi-square test.
The bold numbers indicate significant data.
ApoB, apolipoprotein B; BMI, body mass index; CVD, cardiovascular disease; HBP, high blood pressure; SD, standard deviation.
The Townsend deprivation index, a measure of socioeconomic status, was also significantly different between the two groups, with the higher ApoB group having a slightly lower mean Townsend index (indicating lower deprivation) compared with the lower ApoB group (P < 0.001) (Table 1). BMI was higher on average in the high ApoB group (27.75 ± 4.56) compared with the low ApoB group (27.07 ± 4.97), and this difference was statistically significant (P < 0.001) (Table 1). The distribution of sex, ethnicity, smoking status, alcohol consumption, and the presence of comorbidities (such as cancer, diabetes, cardiovascular disease, and hypertension) also showed significant differences between the two groups, suggesting that these factors were associated with ApoB levels.
Association Between ApoB and AD Risk
Table 2 outlines the results of the multivariable Cox proportional hazard models assessing the association between ApoB levels and the incidence of AD. In Model 1, which was a crude analysis, ApoB levels above the median were associated with an HR of 0.94 (95% confidence interval [CI]: 0.88–1.00, P = 0.055) compared with ApoB levels below the median (Table 2). This association became statistically significant in Model 2 (HR: 0.93, 95% CI: 0.87–0.99, P = 0.038), which adjusted for age, sex, ethnicity, and the Townsend index. Further adjustments in Models 3 and 4, which included lifestyle factors such as BMI, smoking, alcohol consumption, and comorbidities (cancer, diabetes, cardiovascular disease, and hypertension), consistently showed that higher ApoB levels were associated with a reduced risk of developing AD (Model 4 HR: 0.93, 95% CI: 0.87–0.99, P = 0.031) (Table 2). When ApoB was treated as a continuous variable, the inverse association with AD risk was even more pronounced. Each unit increase in ApoB (g/L) was associated with a 26% reduction in the hazard of developing AD in the fully adjusted model (HR: 0.74, 95% CI: 0.64–0.86, P < 0.001) (Table 2). These findings suggest that higher ApoB levels may be protective against the development of AD, with the effect being consistent across different levels of adjustment.
Results of Multivariable Cox Proportional Hazards Models Evaluating the Association Between Apolipoprotein B Levels and Atopic Dermatitis Incidence
Model 1: Crude.
Model 2: Adjust: Age, sex, ethnicity, and Townsend.
Model 3: Adjust: Age, sex, ethnicity, Townsend, BMI, smoke, and alcohol.
Model 4: Adjust: Age, sex, ethnicity, Townsend, BMI, smoke, alcohol, cancer, diabetes, CVD, and HBP.
The bold numbers indicate significant data.
ApoB, apolipoprotein B; BMI, body mass index; CVD, cardiovascular disease; CI, confidence interval; HR, hazard ratio; HBP, high blood pressure.
Subgroup analyses were conducted to explore potential interactions between ApoB levels and various covariates, including sex, ethnicity, smoking status, alcohol consumption, the presence of comorbidities, and age (dichotomized at 60 years). As shown in the supplementary subgroup table, no significant interactions were detected, indicating that the inverse relationship between ApoB levels and AD risk was consistent across these subgroups (P for interaction >0.05 for all variables) (Supplementary Table A1). This consistency suggests that the protective effect of higher ApoB levels on AD risk is robust and not substantially modified by these factors.
Linear Associations Between ApoB and AD Risk
Figure 2 presents the results of the RCS analysis, which was used to explore the potential nonlinear relationship between ApoB levels and AD risk. The RCS analysis confirmed that the relationship between ApoB and AD risk was linear, with a consistent decrease in AD risk as ApoB levels increased (P for linear trend <0.001, P for nonlinearity = 0.803) (Fig. 2). The absence of a significant nonlinear component suggests that the protective effect of ApoB increases uniformly with higher levels of the protein, without any threshold effects or plateaus.
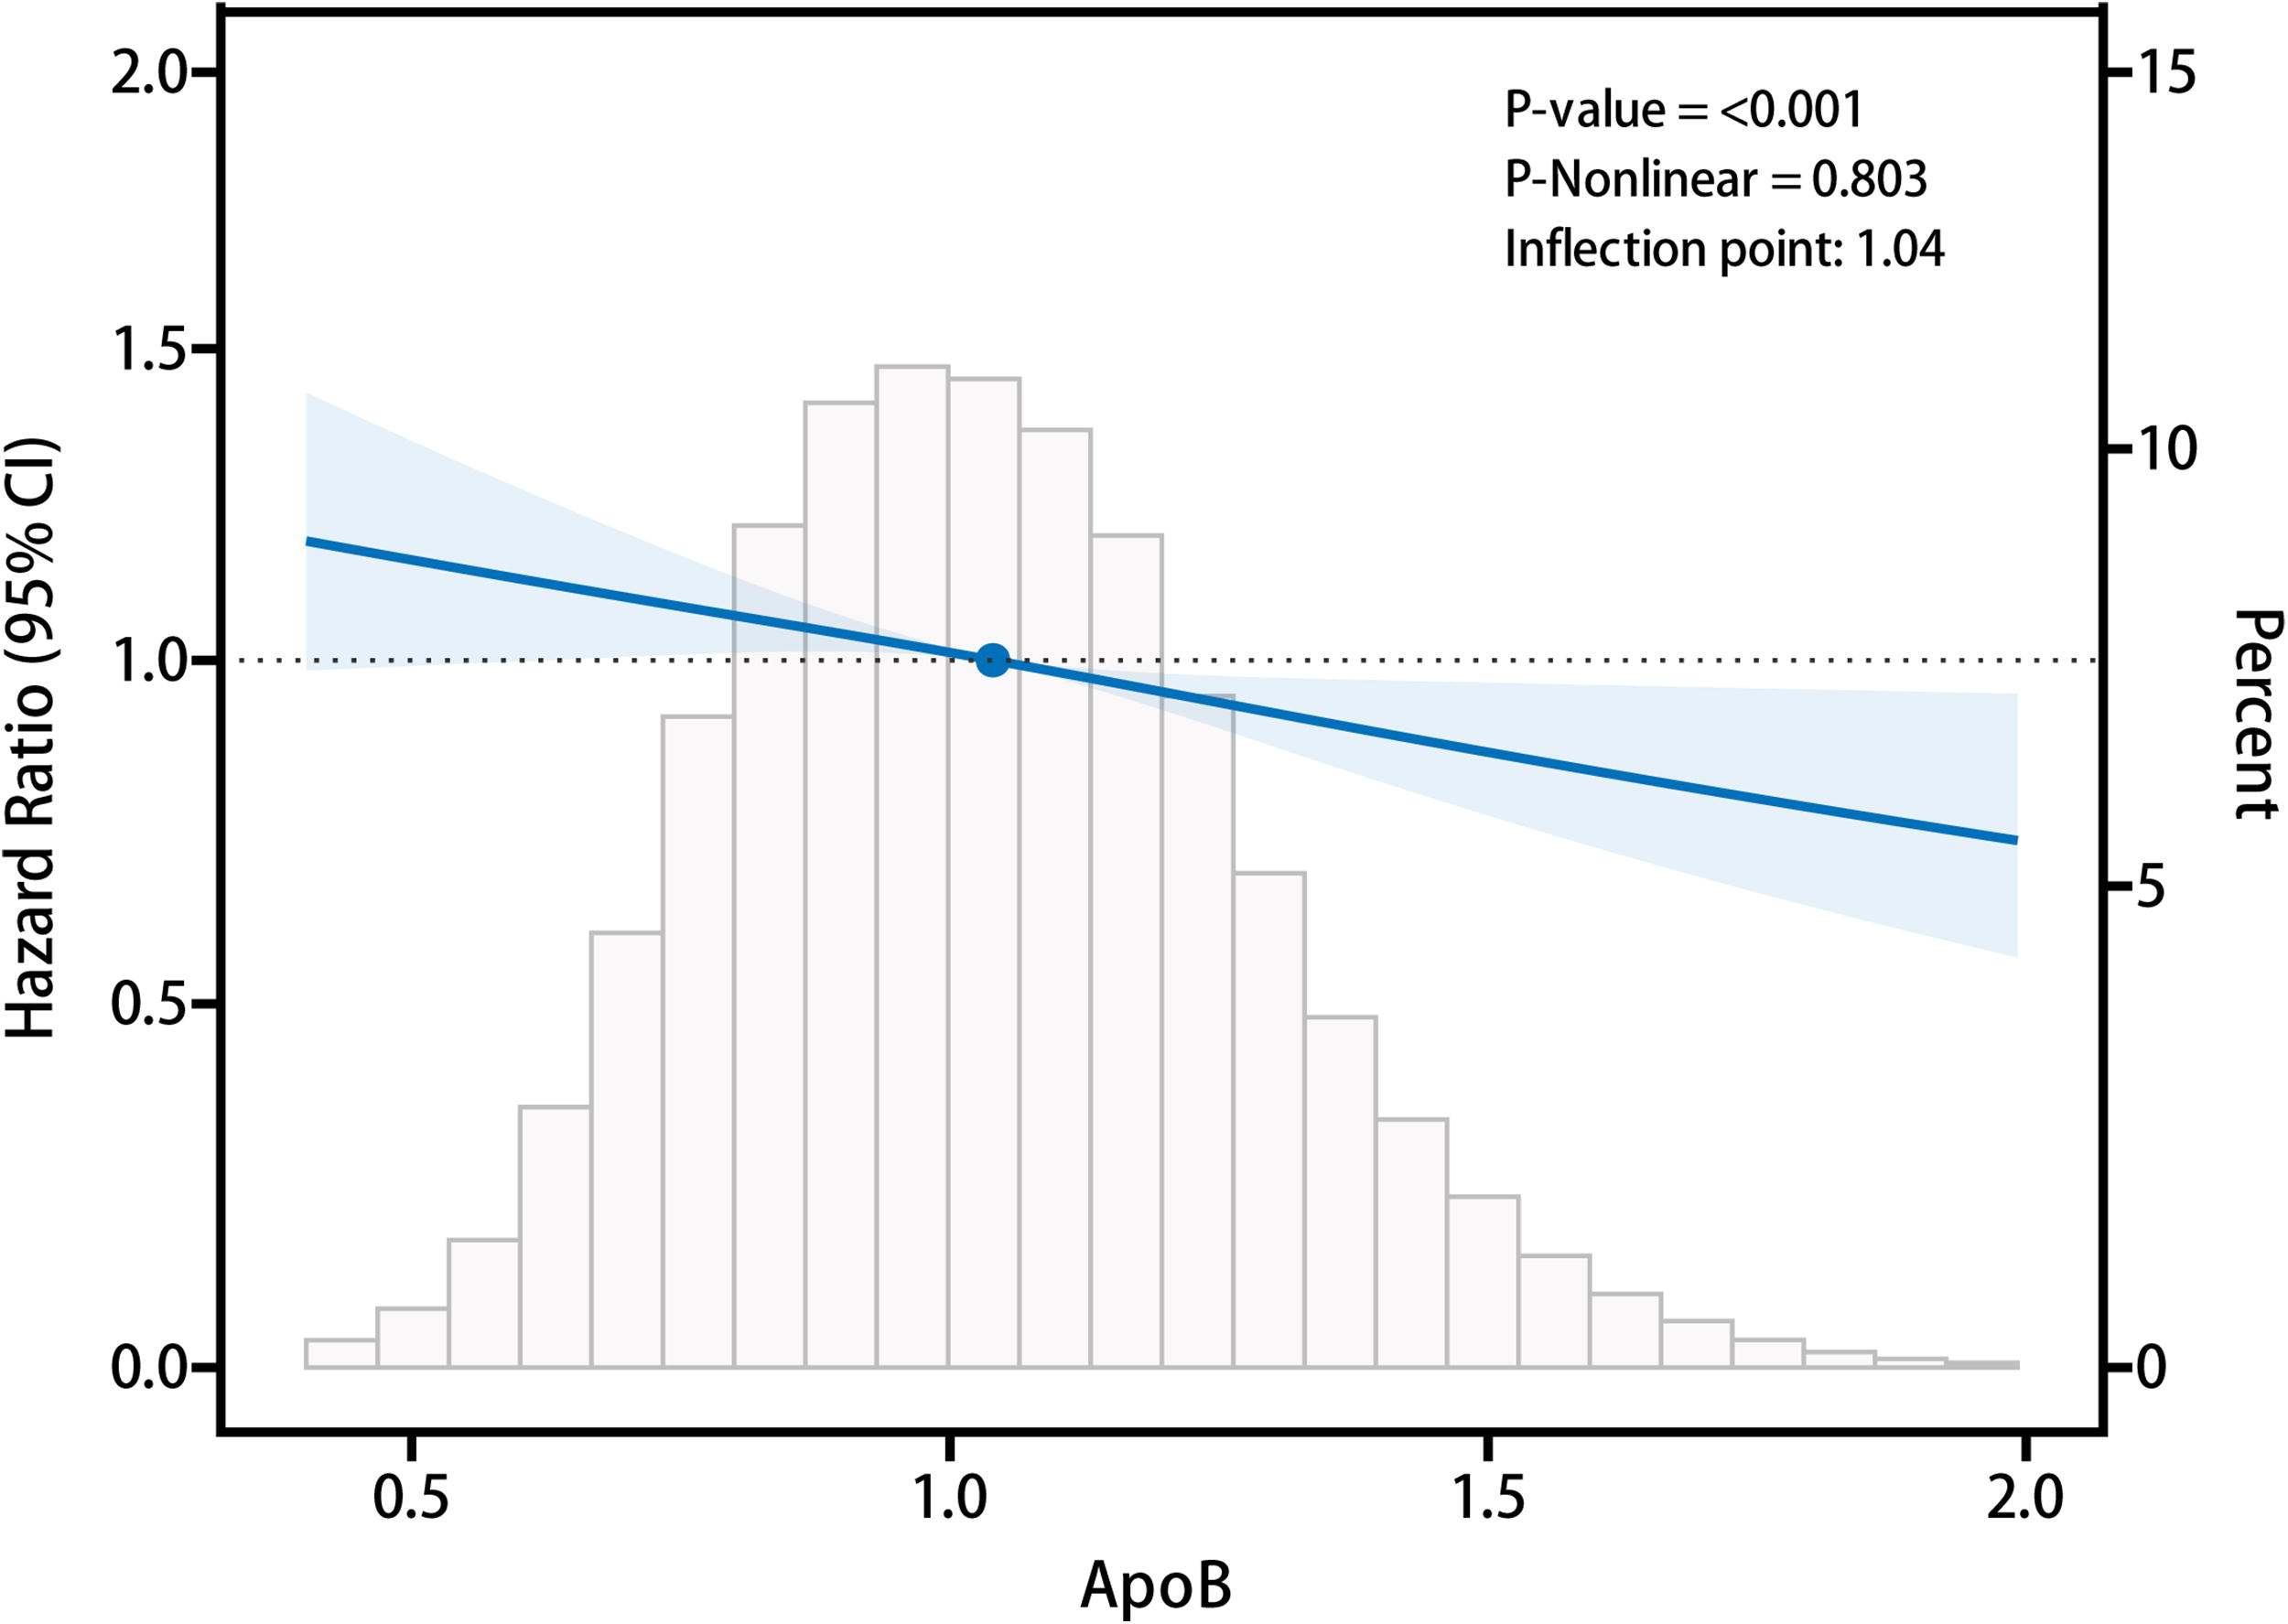
The restricted cubic spline (RCS) analysis assessing the association between ApoB levels and AD risk. ApoB, apolipoprotein B; AD, atopic dermatitis.
Sensitivity Analyses
Several sensitivity analyses were performed to ensure the robustness of the findings. First, additional adjustments were made for the use of lipid-lowering medications, which did not materially alter the results, indicating that the observed association between ApoB and AD was independent of lipid-lowering therapy (Supplementary Table A2). Second, we examined the association between apolipoprotein A (ApoA) and AD and found no significant relationship, highlighting the specificity of the ApoB–AD association (Supplementary Table A3). Last, we repeated the primary analysis using ApoB levels measured by NMR spectroscopy instead of standard blood biochemistry (Supplementary Tables A4–A8 and Supplementary Fig. A1). The results from this analysis were consistent with those obtained using the biochemistry-based ApoB measurements, further supporting the robustness of our findings.
DISCUSSION
In this large-scale, prospective cohort study, we have established, for the first time, a significant inverse association between ApoB levels and the risk of AD. This finding is particularly noteworthy given the robust nature of the data derived from the UKB, which includes over 450,000 participants and a comprehensive range of demographic, lifestyle, and clinical covariates. The consistency of our results across various models, sensitivity analyses, and subgroup analyses underscores the potential importance of ApoB as a novel protective factor against AD. This study fills a critical gap in the existing literature, where the role of lipid metabolism in AD pathogenesis, particularly the involvement of ApoB, has been underexplored.
The innovative aspect of our study lies in its scope and methodological rigor. Previous studies examining lipid metabolism and AD have largely focused on smaller populations or specific lipid fractions, without addressing ApoB specifically or the full spectrum of potential confounding factors.5,16 By leveraging the extensive dataset provided by the UKB, we were able to control for a broad spectrum of variables, including demographic factors, lifestyle behaviors, comorbidities, and medication use, ensuring that the observed association between ApoB and AD is robust and reliable. Furthermore, the use of both standard blood biochemistry and NMR spectroscopy for ApoB measurement enhances the validity of our findings.
The inverse relationship between ApoB levels and AD risk observed in our study may suggest that higher ApoB could potentially be associated with a lower risk of developing AD, though this finding requires further validation. Several hypothetical mechanisms could be proposed to explain this association; however, these remain speculative and necessitate additional investigation, as no scientific literature currently validates them as the reasons for this inverse relationship. First, ApoB is a crucial component of atherogenic lipoproteins, including LDL, VLDL, and IDL, all of which are involved in lipid transport and metabolism. Higher levels of ApoB may be associated with more efficient lipid transport and turnover, which could positively influence the lipid composition of the skin barrier. A well-maintained lipid barrier is essential for preventing trans-epidermal water loss and protecting against external allergens and irritants that can trigger or exacerbate AD. Moreover, recent research has suggested that certain lipids, such as ceramides, play a key role in skin barrier function, and disturbances in these lipids are a hallmark of AD. 17 Thus, it is plausible that higher ApoB levels could theoretically support an optimal skin lipid profile, reducing AD risk. However, this mechanism lacks direct empirical support and requires further study. Second, there is emerging evidence to suggest that systemic lipid metabolism can influence the microbiome of the skin. 18 ApoB might impact the skin’s microbiota composition by modulating the lipid content of the skin surface, which in turn could affect the balance of microbial populations. A balanced microbiome is crucial for skin health, and dysbiosis has been implicated in the pathogenesis of AD. 19 Higher ApoB levels might therefore contribute to a healthier microbiome, reducing the likelihood of AD onset. Nevertheless, this idea remains conjectural, with no established evidence linking ApoB to microbiome changes in the context of AD. In summary, while our study provides preliminary clinical evidence of an inverse relationship between ApoB levels and AD risk, the mechanistic explanations remain unconfirmed and need further biological research.
Despite the strengths of our study, several limitations should be acknowledged. First, the observational nature of our study precludes definitive conclusions about causality. While we observed a significant association between higher ApoB levels and reduced AD risk, we cannot rule out the possibility of residual confounding or reverse causation. For example, individuals with subclinical or early-stage AD might alter their lifestyle or medication use in ways that affect their ApoB levels, thus influencing the observed association. Second, although the UKB provides a rich dataset, certain variables were self-reported, which introduces the potential for recall bias or misclassification. For instance, information on lifestyle factors such as smoking, alcohol consumption, and medication use was self-reported, and inaccuracies in these data could affect the study results. However, the large sample size and the consistency of our findings across multiple models and sensitivity analyses suggest that the impact of such biases is likely to be minimal. Third, while our study included adjustments for a wide range of covariates, there may still be unmeasured confounders that we could not account for. Last, the generalizability of our findings may be limited by the demographic characteristics of the UKB cohort, which is predominantly composed of individuals of European ancestry. Further studies in more diverse populations are necessary to confirm whether the observed associations hold across different ethnic groups and geographic regions. At the same time, the age range of the participants in the UKB cohort is 37–73 years old, which may not be entirely consistent with the age distribution of AD. More studies in the young population are needed for validation.
CONCLUSION
In conclusion, this study provides compelling evidence for an inverse association between ApoB levels and the risk of developing AD in a large, well-characterized cohort in the UKB population. Our findings suggest that higher ApoB levels may be protective against AD, potentially through mechanisms involving enhanced lipid metabolism, reduced inflammation, and a more balanced skin microbiome. These results not only add to the expanding body of literature on the role of lipid metabolism in skin health but also highlight ApoB as a potential biomarker or therapeutic target for AD prevention and management.
References
Supplementary Material
Please find the following supplemental material available below.
For Open Access articles published under a Creative Commons License, all supplemental material carries the same license as the article it is associated with.
For non-Open Access articles published, all supplemental material carries a non-exclusive license, and permission requests for re-use of supplemental material or any part of supplemental material shall be sent directly to the copyright owner as specified in the copyright notice associated with the article.