
Abstract
Background:
Visualization of proteins and subcellular structures such as nuclei and cell organelles using fluorescent dyes or fluorescently tagged antibodies (immunostaining) have been a cornerstone of biological research. However, the current quantification method involves time-consuming and labor-intensive manual counting using ImageJ software. These issues tend to introduce unintentional biases, inconsistencies, and are not feasible for large datasets. While published ImageJ macros address the efficiency issue, they often fail to accurately quantify images with diverse biological assays.
Method:
Here, we introduce AutoCount, an open-source ImageJ macro, designed to accelerate the quantification of fluorescently labeled images. AutoCount integrates fluorescence intensity maxima with area thresholding, ensuring precise segmentation and quantification across diverse experimental conditions. This macro requires only three user inputs relative to other similar scripts that require >10 user inputs.
Results:
AutoCount significantly improves efficiency, reducing the analysis time of 100 images by 10-fold for high-confluency images (>80%) and 3- and 6-fold for low (<50%) and medium (50–70%) confluence, respectively. Notably, its accuracy was not significantly different relative to manual counts. We showcased AutoCount's accurate quantification of cell viability (live/dead) and pluripotency efficiency (OCT4+ and NANOG+)—two of the multiple applications of a cell-counting program. Importantly, all these validations showed no significant differences relative to manual counts.
Conclusion:
By bridging the gap between manual accuracy and the efficiency demanded by modern research workflows, AutoCount provides a robust, versatile, and user-friendly solution for fluorescence image analysis.
Introduction
The detection of proteins or subcellular organelles using fluorescence microscopy is a routinely used assay for examining biological processes, including the analysis of tumor microenvironment, cell migration, proliferation, etc.1–8 To evaluate the significance of these biological processes under a given condition, an accurate and unbiased quantification method is essential.9,10 Currently, a widely adopted method involves the manual counting of individual cells using the multi-point tool in ImageJ software.11,12 Although effective and meticulous, the manual method is highly labor-intensive and time-consuming, particularly for large datasets. Even so, many researchers prefer to rely on manual counting due to its perceived accuracy.13 While cell counting tools with automation have been developed in the recent past, many of these methods are hindered by complex user interfaces and are application specific.9,14,15 These limitations emphasize the need to develop and validate an efficient, automated method that is both user-friendly and accurate.
ImageJ, a widely adopted open-source software, provides an ideal platform for this endeavor.12 Its built-in functions, including thresholding, watershed segmentation, and particle analysis, have already enabled users to perform cell counting. These functions can be integrated into custom macro code, thereby facilitating the development of fully automated, transparent, and user-friendly workflows.12 Although several cell counting macros have been developed for ImageJ, they are mostly optimized for specific imaging modalities.14,16,17 For instance, the Cell Colonies Edge (IMJ Edge) macro uses edge detection to count non-overlapping cells in both brightfield and fluorescent images.14 While effective for images with low cell density, this approach exhibits significant limitations for images with high density. Other methods that employ pixel intensity-based segmentation encounter fewer segmentation errors, thereby offering a promising solution to quantify images.18 For instance, Grishagin proposed macros utilizing pixel intensity- or threshold-based calculations to detect cells.19 Although these methods are accurate, they are optimized for brightfield images, hence, have limited application.
Another ImageJ macro, CmyoSize, combines intensity maxima-based segmentation with thresholding to analyze both size and number of cardiomyocytes with accuracy.20 However, like Grishagin, CmyoSize is limited to hematoxylin and esoin (H&E)-stained images, hindering its application to fluo-rescent images.20 Furthermore, this macro uses a shape filtering method to define cardiomyocytes, ultimately restricting its applicability to other nonfluorescent cell types and image contexts.21–23 Similarly, other auto-mated ImageJ-based cell counting macros are tailored to specific cell types, morphologies, or confluences, restricting their broader utility across diverse research contexts.21–23 These limitations underscore the need for an automated ImageJ macro that is suitable for diverse applications. Such a tool should combine the strengths of existing approaches—such as intensity-based methods and thresholding—while minimizing their respective weaknesses with a high degree of user transparency, accessibility, and accuracy on par with manual quantification.
Building upon the existing challenges and limitations, we developed a new ImageJ macro, AutoCount by combining the intensity peak detection and image thresholding developed in the bright field models for fluorescent image analysis. AutoCount is built with flexibility and scalability in mind that seamlessly adapts to different cell types, staining techniques, and image qualities, offering users the ability to fine-tune parameters for their unique datasets. Furthermore, its batch-processing capability enables efficient analysis of large image sets, ∼10-fold reduced analysis time, high-throughput workflows, and precision. In this study, we demonstrate the usage of AutoCount in three independent biological systems, including (1) accurately quantifying the cell number at varying cell confluence; (2) reliably quantifying live/dead cells for cell viability assays in three experimental conditions; and (3) evaluating pluripotency of hiPSC colonies using immunostaining for OCT4 and NANOG. Notably, all these validations showed no significant differences relative to manual counts. By offering a tool that is both robust and user-friendly, AutoCount bridges the gap between the accuracy of manual counting and the efficiency demanded by modern research workflows, addressing a critical unmet need within the scientific community.
Methods
The detailed information (raw code, step-by-step procedure) about the AutoCount macro is provided in the supplementary information section. The AutoCount macro can be downloaded freely from GitHub, https://github.com/Ahmed-M-Sharara/AutoCount.
Human Induced Pluripotent Stem Cells (hiPSC) culture and hiPSC-derived cardiomyocytes (hiPSC-CMs) differentiation
hiPSC cells were cultured in matrigel-coated plate by using mTeSR1 medium (Stem Cell USA, #85850). Differentiation of hiPSC to cardiomyocyte was induced as previously described.24 Briefly, 0.5 × 10⁶/well single cell suspension was seeded in matrigel-coated 12-well plate in mTeSR1 media supplemented with Rho-associated protein kinases (ROCK) inhibitor Y-27632 (10 lM) (Selleck Chemicals, #S1049). Upon 90–100% confluency (day 0), the media was replaced with RPMI/B27 minus insulin (Gibco #A18956-01) containing 7 lM CHIR99021 (Sigma Aldrich, SML1046). After 48 h (day 2), the media was replaced with RPMI/B27 minus insulin containing 7.5 lM of IWP2 (Tocris #3533), and on day 4, the fresh RPMI/B27 minus insulin media was added. On day 6, the media was replaced with fresh RPMI/B27 containing insulin supplement (RPMI/B27þins) (Gibco, #17-504-044). Subsequently, the media was changed at every 2 days interval. On day 11, hiPSC-CMs were trypsinized with 0.25% trypsin for 16 min at 37 C and replated at a 1:3 ratio in a matrigel-coated plate in media supple-mented with ROCK inhibitor (10 lM). Between day 13 and 16, hiPSC-CMs were enriched using noglucoseDulbecco's Modified Eagle Medium (DMEM) (Gibco, #11966025) media supplemented with lactate (4 mM). From day 16, hiPSC-CMs were maintained in RPMI/B27+ins medium with fresh media changes every 3 days. To obtain varying cell density, single cell suspension of hiPSC-CMs was seeded in amatrigel-coated plate. For <50%, 50–80%, and >80% confluence, 40,000–50,000 hiPSC-CMs, 0.1 × 10⁶ hiPSC-CMs, and 0.5 × 10⁶ hiPSC-CMs were replated in a 12-well plate, respectively. After 24 h, fresh RPMI/B27+ins media was added and cultured for 48 h. Subsequently, hiPSC-CMs were stained with live cell fluorescent dye Calcein AM as per the manufacturer protocol, imaged, and then processed for cell count analysis.
Immunostaining
Immunostaining was performed as described elsewhere.25 Briefly, hiPSC cells were seeded in matrigelcoated 12-well plates. Upon 50–70% confluency, cells were washed with 1X Dulbecco's Phosphate Buffered Saline (DPBS) and fixed in the 4% paraformaldehyde solution for 15 min at room temperature. Cells were washed with 1X PBS and permeabilized using 0.2% Triton X-100 for 30 min at room temperature. Subsequently, cells were washed twice with 1X Phosphate Buffered Saline (PBS) and blocked with 50 g/L Bovine Serum Albumin (BSA), 10 g/L glycine, 2% Goat Serum, 0.1% Triton-X-100 (BGST) solution for 1 h at room temperature and incubated with primary antibodies OCT3/4 (1:200; Santa Cruz Biotechnology: #SC-5279) and NANOG (1:200; Cell Signaling Technology: #4903) overnight at 4C. Cells were washed twice with 0.2% Tween-20-PBS and once with 1X PBS and incu-bated with secondary antibodies Alexa Flour 488 (1:400, Invitrogen#A21202) and Cy3 (1:400, Jackson Immunor-esearch#102649-700) for 1.5 h. Cells were washed using 0.2% Tween-20-PBS and stained with 4′,6-diamidino-2-phenylindole (DAPI) (1 lg/ul) diluted in 1X PBS for 10 min. Finally, cells were washed with 1PBS three times and imaged at 20 magnification using EVOS M5000 fluorescent micro-scope (ThermoFisher Scientific).
Human dermal fibroblast cell culture
Human dermal fibroblast (HDF) cells were cultured and maintained in DMEM high-glucose media supplemented with 20% fetal bovine serum (ThermoFisher, Cat# 26140079). For subculturing, HDF cells were trypsinized using 0.25% trypsin for 5 min at 37 °C and split into 1:3 ratio for maintenance and experimental usage.
Live–dead assay (viability assessment)
The live/dead staining was performed as per the manufacturer’s instructions. Briefly, HDF cells were seeded at ∼10,000 cells/cm2 in a 12-well plate (Corning Inc., 353043) for 24 h to allow them to adhere prior to exposing them for various conditions (#1–3) to induce cell death to varying extents. For staining, cells were washed with DPBS (Gibco, 14190-144), followed by the addition of culture media containing fluorescent dyes (1 mL/well), including Calcein AM (0.8 μM; live dye) and Ethidium homodimer-1 (2 μM; dead dye). Subsequently, the cells were incubated at 37 °C for 30 min. After 30 min, the media was replaced with fresh media without dye and imaged using DMi8 Leica Fluorescence microscope (Leica, Wetzlar, Germany). Fluorescent images were processed for green (live) and red (dead) fluorescence. Images were processed using ImageJ software (NIH) and used for analysis. Viability was calculated as a total number of green cells divided by the total number of live+dead (green+red) cells and shown as percentage.
Manual analysis
Manual cell counting was conducted by two independent experts using the images with varying cell density. Both used similar quantifying parameters to include or exclude cells such as excluding the cell debris or partially visible cells and were deemed unsuitable to include into quantification. These same parameters were applied for the analysis of live–dead assay as well as analysis of the nuclear immunostaining, as shown in Fig.4. To assess error rates, the average cell counts from both manual counters were used to normalize the discrepancies observed in the outputs from AutoCount analysis for three images at each confluence level. For the efficiency measurements shown in Fig.2, a single image was analyzed five times to obtain an average processing time (converted to minutes and scaled to estimate the time required to analyze 100 images for a given confluence level). The procedure was repeated with a second image to confirm the reliability of the estimates for quantifying 100 images.
Statistical analysis
Multiple images were used for analysis. All the analysis was performed >3-10 times by two independent investigators. Statistical significance is denoted as follows: *p< 0.05; **p < 0.01; ***p < 0.001. Group comparisons were performed using two-way analysis of variance (ANOVA) with the Holm-Sidak’s multiple comparisons test and unpaired t-tests using the Mann–Whitney method, as appropriate, using GraphPad Prism (GraphPad® Software, Inc.). All the statistical analysis was conducted using GraphPad Prism version 9.3.1 (GraphPad Software, La Jolla, CA, USA). Error bars represent standard deviations. Analyzed data are shown as mean± SD.
Results
Step-by-step description of AutoCount macro
Most of the existing automated cell counters are tailored toward specific tasks, such as quantifying neural projections, sparse colony detections, etc.14,16,21,22 Furthermore, a limitation of many macros is their tendency to either under-segment or over-segment particles in a given image, resulting in inaccurate quantification and rendering them error-prone.14,26
To address these issues, we have developed an easy-to-use ImageJ macro, AutoCount, that requires only three user inputs derived from a single representative image. These inputs are then applied to automatically quantify the entire dataset with high precision. These inputs include (1) minimum prominence value, (2) minimum threshold parameters, and (3) minimum particle size.
Defining the input parameters for image analysis
In addition to the step-by-step user prompts in the macro itself (Fig.1A and B), we have provided an easy-to-follow step-by-step protocol to guide users through the selection of input parameters (supplementary information). Fig.1B gives an overview of the process. Upon running the macro, the user is first prompted to choose the folder containing the images for analysis. Ensure that this folder is named either “green,” “red,” or “blue,” depending upon the fluorescence channel used during image acquisition. AutoCount automatically processes the representative image, first by splitting the color channels and selecting only the relevant channel based on the fluorescence used. For instance, when using 488/GFP filters for green fluorescence, the green channel image is selected, and the red and blue channel images are discarded. The channel color is then reintroduced to the 8-bit transformed image by the look-up option to ensure the fluorescence signal is correctly represented for further analysis. Next, to optimize intensity-based segmentation, the contrast of the image is adjusted. This is done to enhance the ability of ImageJ’s “Find Maxima (user input#1)” function to detect maxima for segmentation. The “Find Maxima” function operates by identifying pixel intensity peaks, which correspond to a potential identifier, based on a user-defined prominence value. This enables the segmentation process to accurately differentiate individual particles even at confluent culture conditions. Next step involves determining the minimum threshold value. In consultation with the segmented image, the threshold value (user input#2) is adjusted to select the particle occupied area while avoiding non-specific selection. Next, the image with the threshold input is automatically overlaid with the segmented image derived from the “Find Maxima” function, creating a merged image (Fig.1B). This binary representation facilitates the “Analyze Particles” function in ImageJ, simplifying the identification and quantification of particles within the field of view (FOV).
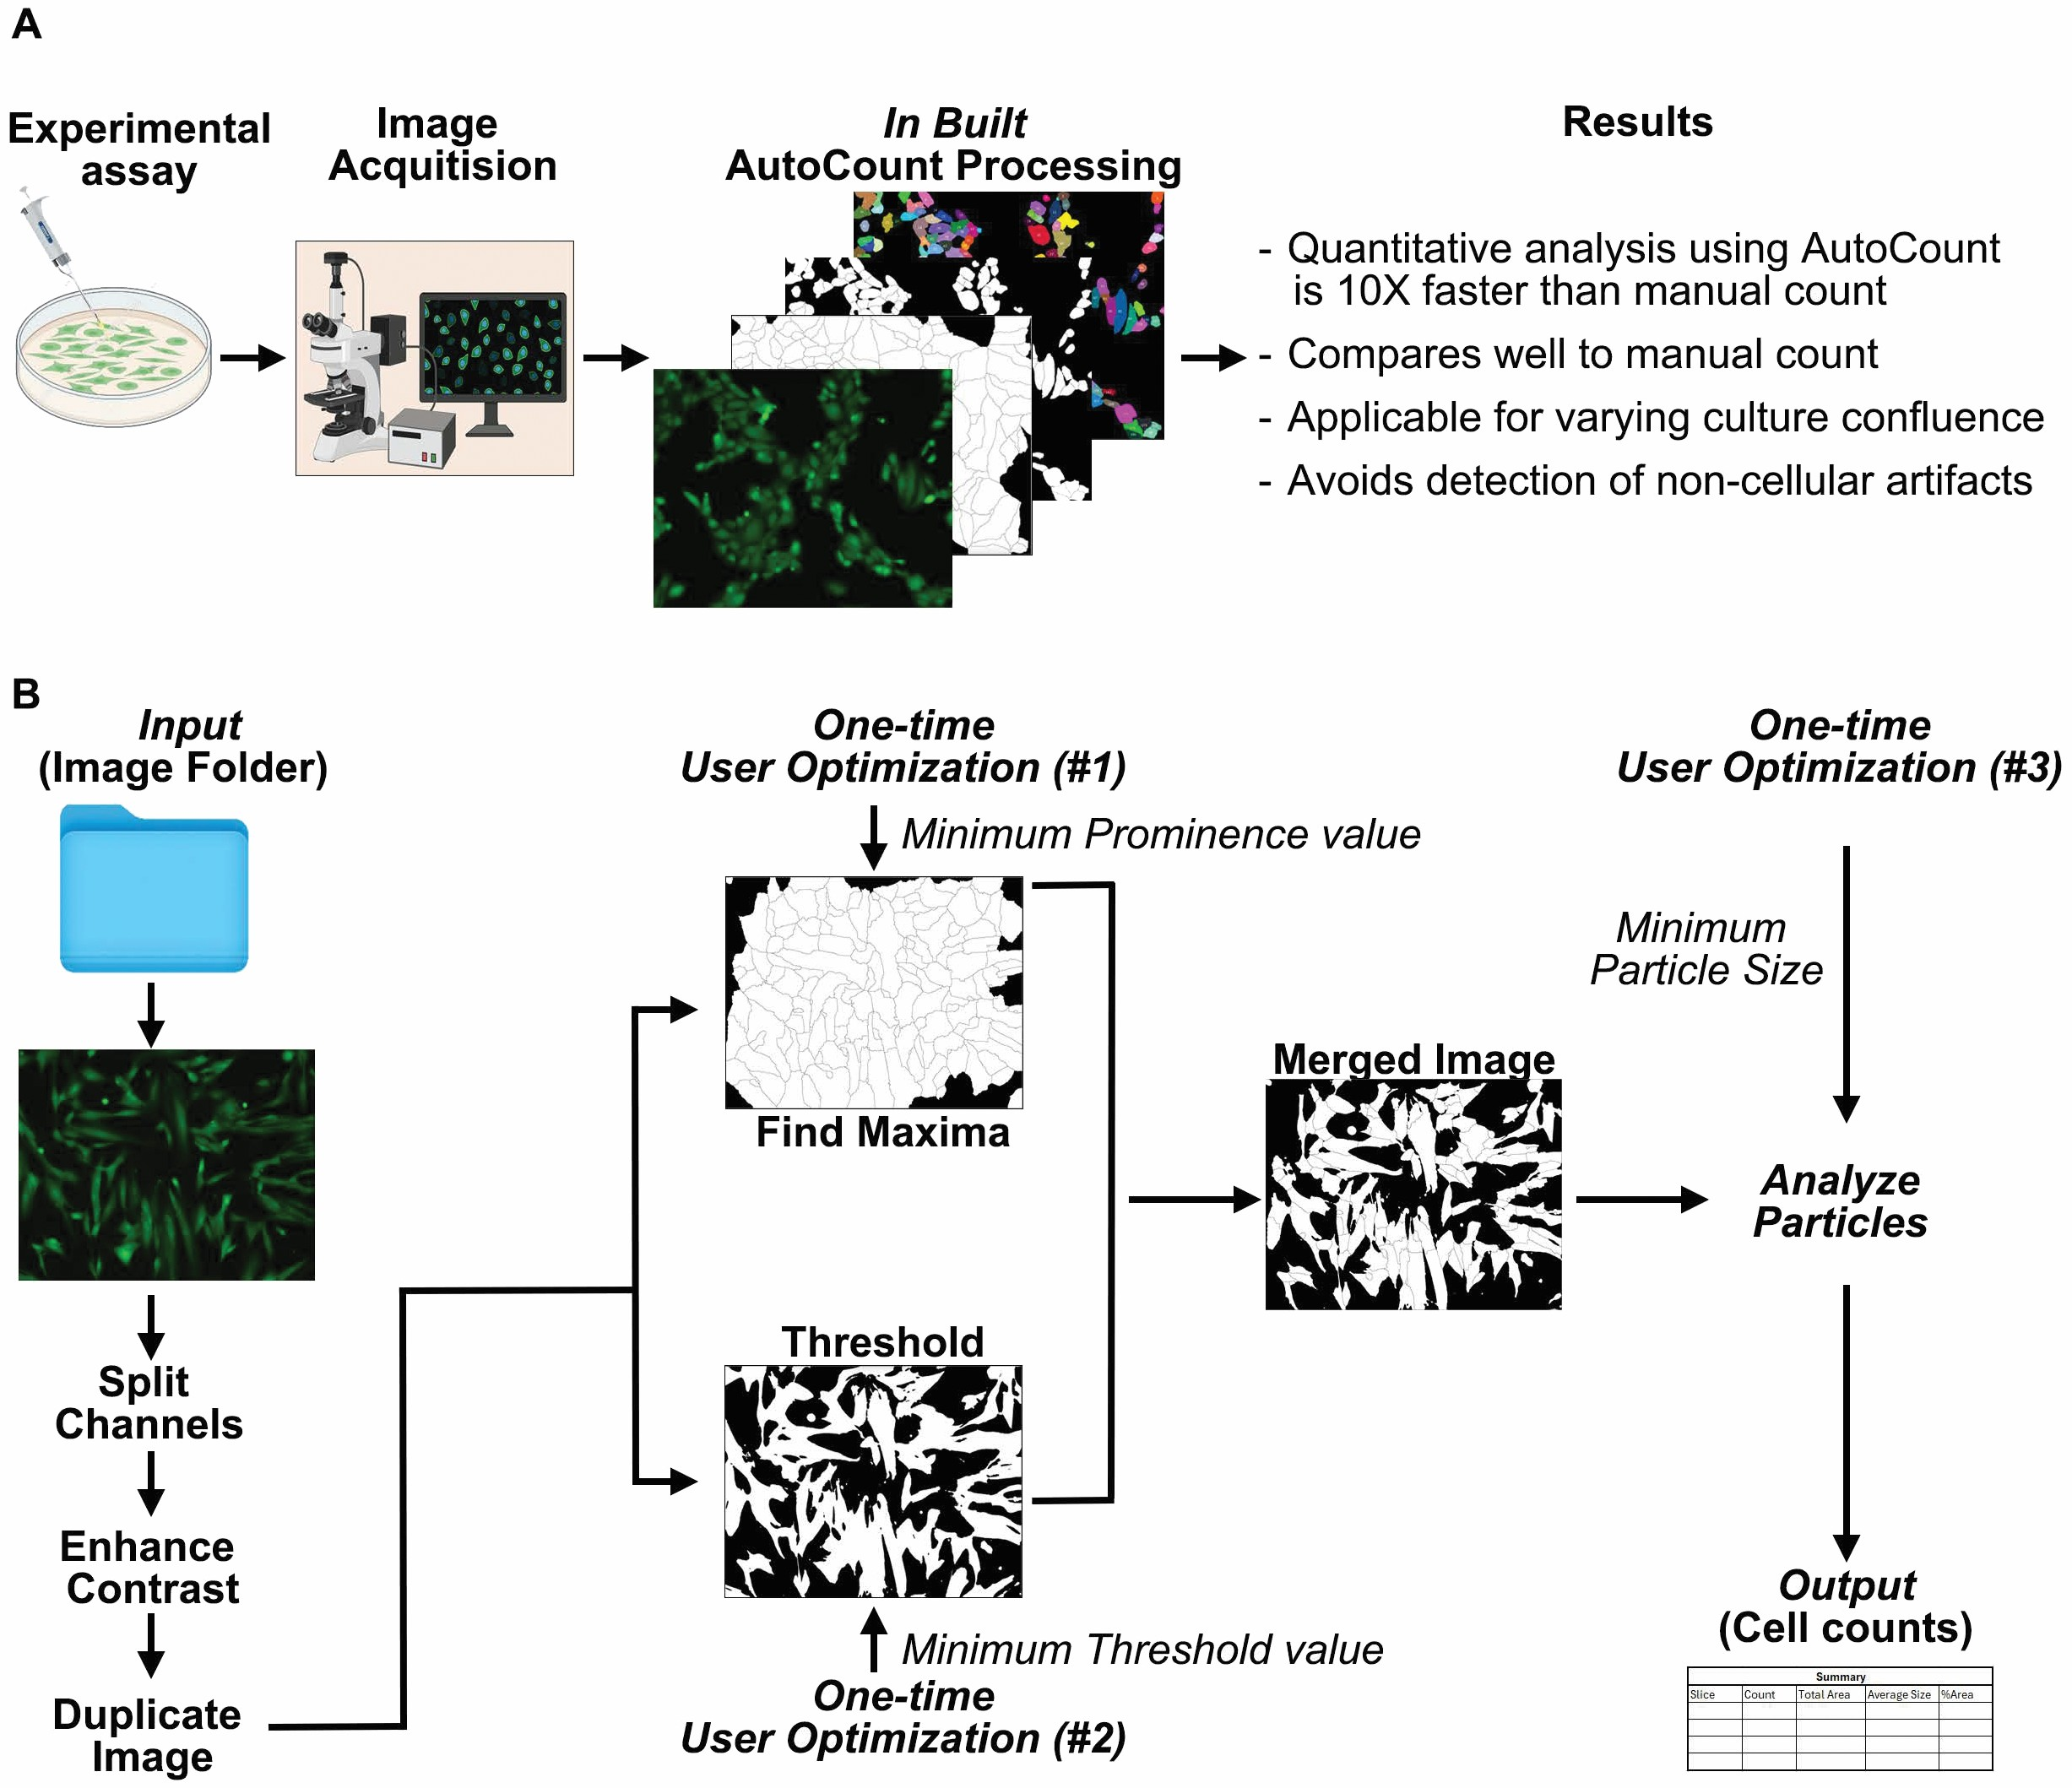
Overview and stepwise demonstration of AutoCount macro. (A) Integration of AutoCount into standard research workflows as an analysis program post-image capture, with key benefits highlighted. (B) Stepwise demonstration of AutoCount’s processing stages and user optimizations for a representative fluorescent image. These steps are in-built into the macro and completely automated. For AutoCount operations, user needs to define only three parameters for the representative image only. Image folder as input involves series of images for single channel. As input#1 and #2, user defines the minimum prominence value and minimum threshold value, respectively. Once assigned, a segmented merged image is generated for analysis. At this point, user defines the input#3 to analyze particles and quantification. The output generated is a summary table containing cell counts, together with other parameters.
The “Analyze Particles (user input #3)” function utilizes parameters such as particle perimeter and area to filter which objects should be counted. For quantifying the merged image, ensure the circularity as 0.00–1.00 and enter a user-defined approximate smallest particle size to ensure appropriate counting of the particles. Upon completion, the system generates a table that displays the quantified particles for each image, with each entry clearly labeled by the original image name. Users can also obtain a labeled segmented image by following the supplementary information. This process is repeated iteratively for all images in a batch and for every batch specified by the user. For each new batch, the user redefines the optimized parameters for thresholding, prominence, and minimum particle size to ensure tailored analysis for varying experimental conditions. This iterative and customizable approach allows for robust and precise quantification across diverse imaging datasets (Fig.1B).
Validation of accuracy and efficiency of AutoCount
We validated the AutoCount with the gold-standard method, manual count.27,28 First, we tested whether the AutoCount macro proficiently works at multiple cell densities ranging from low (<50%) to high (>80%) (Fig.2A). We utilized hiPSC-CMs as these are widely used cell types for cardiovascular drug screening, and their density affects significantly to the drug efficacy.29 We incubated hiPSC-CMs with fluorescent dyes Calcein AM (to label live cells, green) and imaged using Leica Fluorescence microscope at 20× magnification. One of the keys for designing the AutoCount macro was to enhance the speed of image analysis without compromising accuracy. Using the algorithm described earlier, we found that AutoCount could analyze 100 highly confluent images at least 10 times faster than manual count, with similar improvements of approximately 3- and 6-fold for medium- and low-confluence images, respectively (Fig.2B–G). This efficiency demonstrates its adaptability across varying levels of image complexity and cell density. Fig.2B, D, and F illustrates the alignment between the particles identified by AutoCount and that of a manual count expert, reflecting its ability to replicate manual segmentation patterns at all cell density. This capability underscores the strength of AutoCount operating at a significantly faster pace. Although speed is a key advantage, it is not the sole measure of effective analysis. Many macros efficiently process images at different confluences, yet they often compromise accuracy.14,19 AutoCount, by contrast, maintains a balance between efficiency and precision without sacrificing the fidelity of segmentation results.

Comparative analysis of AutoCount’s efficiency vs manual count at various cell density. (A) Determination of hiPSC-CM density: low confluence (<50% area occupied), medium confluence (∼50–60% area occupied), and high confluence (>80% area occupied). For <50%, 50–60%, and >80% confluence, 40,000–50,000 hiPSC-CMs, 0.1 × 10⁶ hiPSC-CMs, and 0.5 × 10⁶ hiPSC-CMs were replated in a 12-well plate, respectively. After 24 h, fresh media was added to each well. Further cells were grown for 48 h, stained with live cell fluorescent dye Calcein AM as per manufacturer protocol and then processed for cell count analysis. (B, D, and F) Left panels: Manual counting of hiPSC-CMs at three confluency levels using multipoint ImageJ tool (yellow crosshair). Crosshairs on the manual count images indicate a count of one cell per crosshair. Right panels: AutoCount macro-processed fluorescent images with each cell are defined by their boundaries. Enclosures on the AutoCount images indicate a count of one cell per enclosure and are shown by numerical value. Note the precise segmentation and identification of cells at all the cellular densities. (C, E, and G) Bar graph showing the efficiency of AutoCount vs manual count at three confluency levels. Quantitative analysis was done using 10 fluorescence images and shown as mean ± SEM. Statistical analysis was preformed using unpaired t-tests using the Mann–Whitney method, ***p < 0.001.
Leveraging a combination of area thresholding and pixel-intensity-based segmentation, AutoCount effectively identifies individual cell bodies within aggregates, addressing a common limitation of edge and area detection-based macros. For example, our analysis showed that IMJ Edge macro detection often under-segments adjacent cell bodies, misclassifying entire clusters as single particles (Fig.3A’’’ and B). On the other hand, AutoCount showed a superior information compared to IMJ Edge. This distinction is evident in Fig.3A’ compared to Fig.3A’’ and A’’’. As expected, the manual counter accurately identifies the cluster of cells in the center of a FOV (Fig.3A’ and B). We also compared AutoCount outcomes with an in-built ImageJ tool, Watershed, as well as another highly used image analysis software, CellProfiler.9,11 We built a CellProfiler pipeline as per the instructions.9 Our analysis revealed that the outcomes using the CellProfiler pipelines were similar to the AutoCount quantification (Supplementary Fig.S1A’’, A’’’’, and B). On the other hand, the Watershed showed segmentation issues, therefore not reliable (Supplementary Fig.S1A’’, A’’’, and B). Overall, these data demonstrate the ability of AutoCount to precisely recapitulate manual quantification.
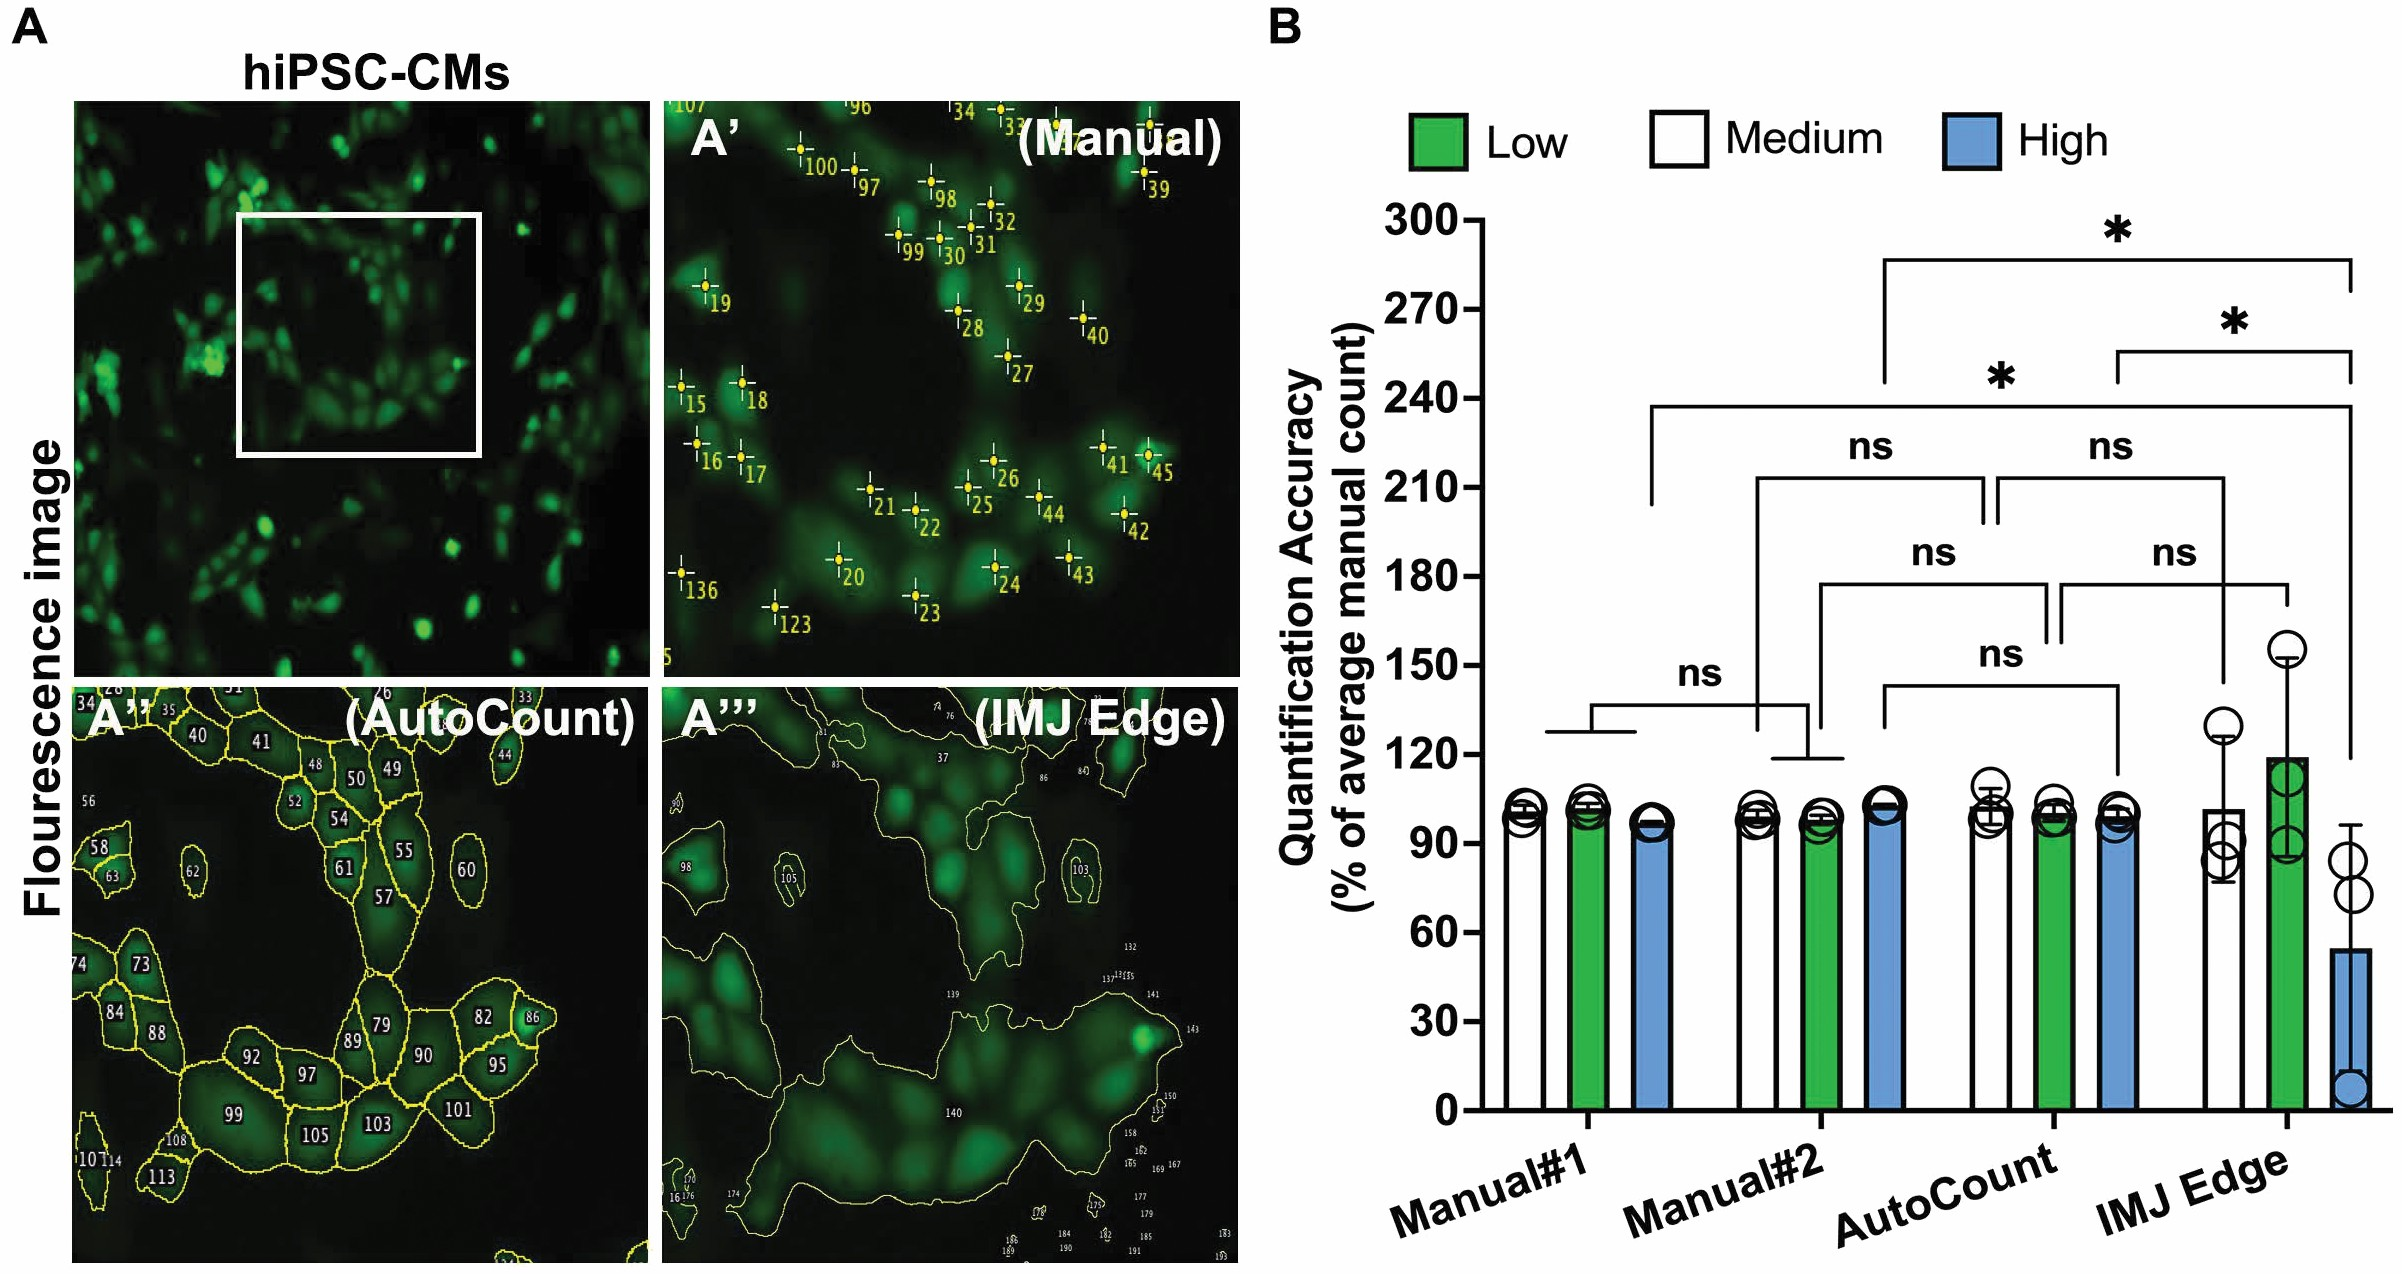
Demonstrating the accuracy AutoCount macro. (A) Fluorescent images showing the ability of AutoCount to segment (yellow lines) and define each cell as a distinct particle (A’’). In comparison, using IMJ Edge for the same image showed one particle for the closely packed cells (A’’’). The image with crosshair refers to the manual counts (A’). The white box area is enlarged to visualize the clear distinction of the segmented particles (the top-left image). (B) Bar-graph showing the comparison of AutoCount and IMJ Edge accuracy normalized to the average of manual #1 and manual #2 expert counters. At least three independent images (n = 3) were used for each analysis. Data are shown as mean ± SEM. Statistical analysis was preformed using two-way ANOVA with Holm-Sidak’s multiple comparisons test; ns: non-significant, *p < 0.05.
Application of AutoCount macro
In this section, we show a few applications of AutoCount macro in an experimental setting.
Quantitative analysis in live–dead cytotoxicity assay using AutoCount
The live–dead assay is a very commonly used procedure for cytotoxic screens.30,31 To test the ability of AutoCount to quantify live–dead cells, we cultured HDF in three different conditions #1, #2, and #3 with varying degree of toxicity. We stained these cells with fluorescent dyes, Calcein AM (a green cytoplasmic stain for live cells) and Ethidium Homodimer-1 (a red nuclear stain for dead cell) for 30 min. Subsequently, we performed fluorescence imaging at 10× magnification, and images were quantified for each category using manual counting and AutoCount protocol. Precisely, AutoCount accurately quantified live and dead cells in all three conditions. Importantly, there was no significant difference from the manual counting quantification, provided comparable experimental results in all of the conditions tested (Fig.4A and B). A detailed breakdown of segmentation accurately demonstrates the fidelity of AutoCount in segmenting the green channel (live dye) and the red channel (dead dye) (Fig.4A, C, and D). These findings underscore the effectiveness of AutoCount in these settings.
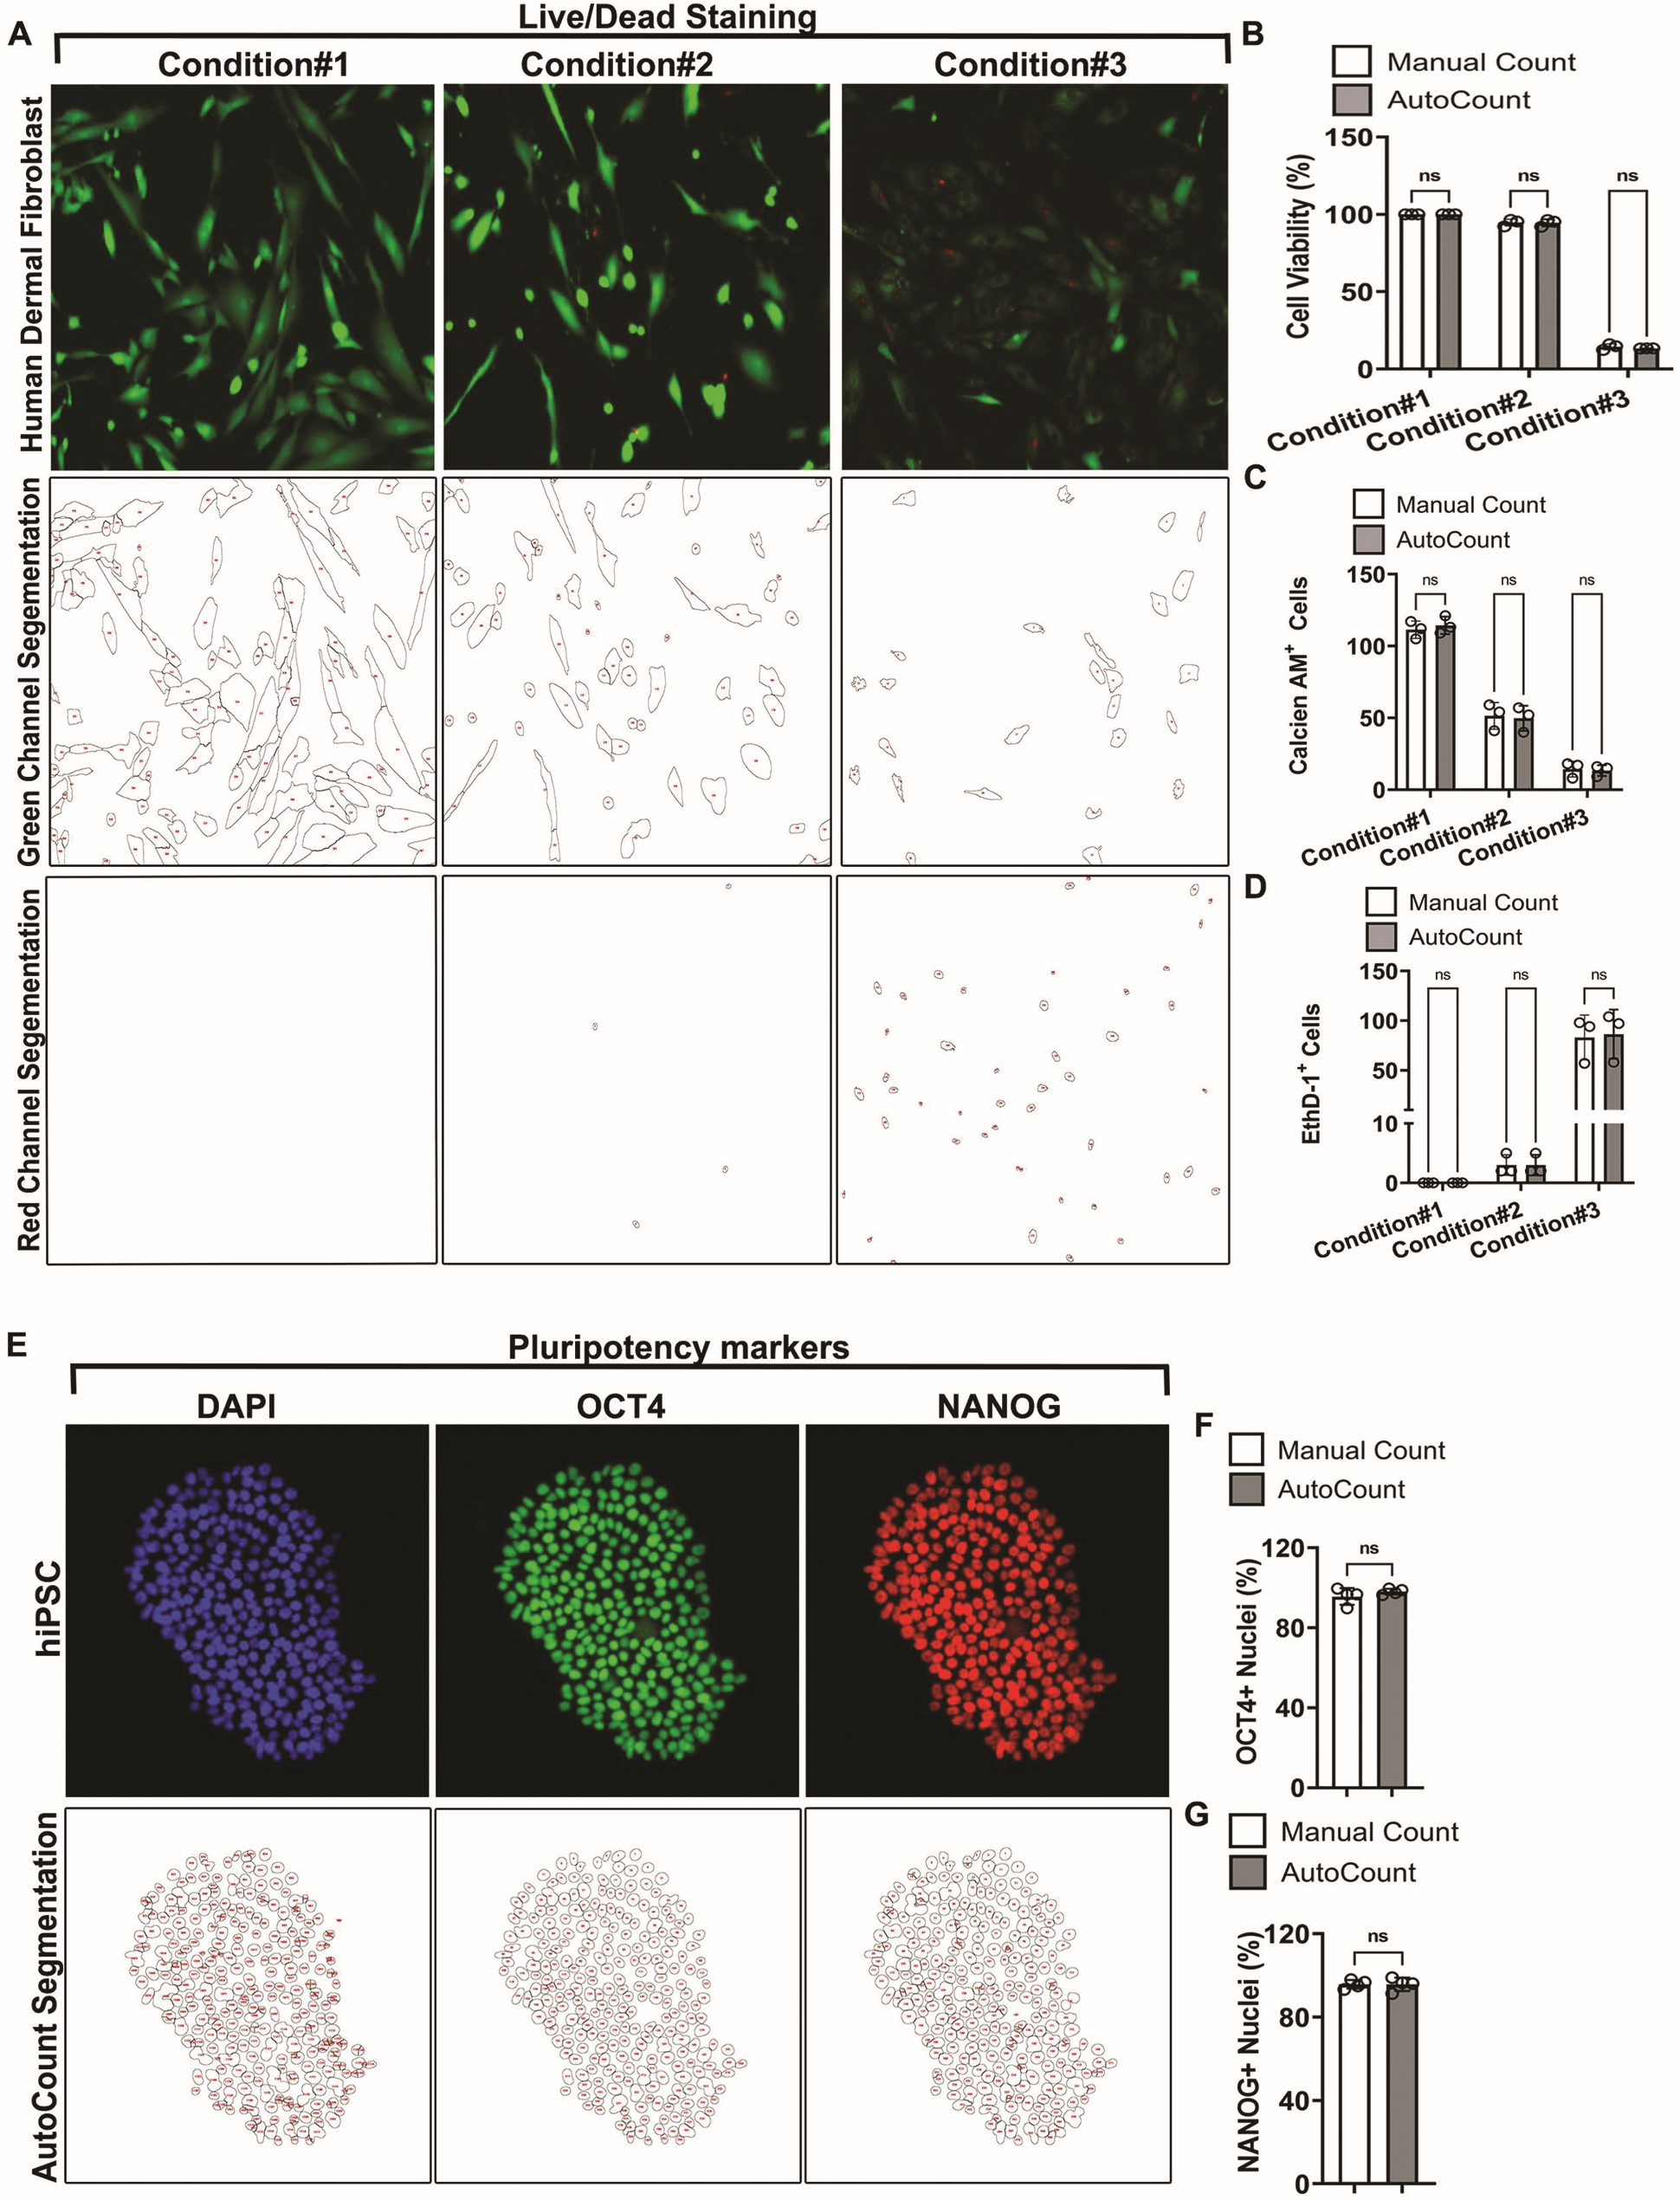
Application of AutoCount macro for live/dead analysis and pluripotency assessment. (A) Representative green- and red-channel-merged images of human dermal fibroblast (HDF) cells obtained from three different culture conditions having varying degree of toxicity. Live cells are stained with Clacein AM (green dye), and dead cells are staining Ethidium Homodimer 1 (red dye). AutoCount macro-processed segmentations of the respective green and red channels for the representative images. Each cell is defined by their boundary, and enclosures on the AutoCount images indicate a count of one cell per enclosure and are shown by a numerical value. Note the precise segmentation (bottom panels for green and red channels) and identification of cells at all the cellular densities. (B) Quantitative analysis of cell viability shown as percent change. Same images were used for manual counting to compare the accuracy of AutoCount. Approximately 163–334 cells were analyzed by manual counting, and 158–343 cells were analyzed using AutoCount. Note that the AutoCount macro precisely quantified the live and dead cells with no significant difference relative to manual count at each condition. (C and D) Quantitative analysis of live cell counts (C) and dead cell counts (D) revealed no significant differences between manual counting and AutoCount. Data are shown as mean ± SEM. ns: non-significant. (E) Immunostaining of hiPSC using pluripotency markers OCT4 (green) and NANOG (red). Nuclei (blue) were stained using DAPI. Bottom panels show the respective segmentations of the immunostained images, providing detailed insights into its segmentation and quantification. (F and G) Bar-graph showing the percentage of OCT4+ (f) and NANOG+ (g) nuclei as assessed by AutoCount in comparison to manual count. At least four independent images (n = 4) were used for each analysis. Note the no significant difference between the quantification by AutoCount vs manual count. Data are shown as mean ± SEM. ns: non-significant.
Quantification of pluripotency using AutoCount
Assaying for pluripotency using immunostaining for OCT4 and NANOG is a routine assay for the maintenance of homogeneous stem cell populations.32,33 We tested the AutoCount macro to evaluate pluripotency in hiPSCs. In these experiments, undifferentiated hiPSCs were stained with pluripotency factors, OCT4 and NANOG, as outlined in the “Methods” section. DAPI (a fluorescent blue stain) was used as a nuclear marker. Imaging was done using the EVOS M5000 Fluorescence microscope at 20× magnification and quantified by manual and AutoCount protocol. We calculated the percentage of OCT4+ and NANOG+ nuclei by normalizing the total number of OCT4+ or NANOG+ nuclei to the total number of DAPI+ nuclei. Once again, AutoCount produced results comparable to manual counting (Fig.4E–G). Fig.4E further demonstrates the define segmentation of the images in both channels, ensuring accurate quantification. These findings underscore the utility of AutoCount as an efficient and reliable tool for image quantification in diverse experimental contexts.
Discussion
This study introduces a new ImageJ macro, AutoCount, designed to standardize and accelerate the quantification of fluorescently labeled images by ∼10-fold. AutoCount demonstrated exceptional efficiency and accuracy, consistently quantifying hundreds of images across a wide range of cell densities and in several test conditions. This reliability highlights AutoCount as a robust tool for automated image analysis, particularly in scenarios requiring the evaluation of high density and for large datasets.
The current gold-standard for manual counting utilizes the multi-point tool in ImageJ.13,27,34 While effective, this method is not suitable for large datasets.35 Several automatic cell counting macros for ImageJ have been developed, however, each suited to their specific need.15,21 In this study, we summarized the few selected cell counting ImageJ macros and compared with AutoCount macro (presented here). Our analysis showed a superior performance of AutoCount relative to others (Table1). Integration of thresholding and pixel intensity methods work as a system of checks and balances, improving segmentation accuracy and mitigating errors in particle detection and counting.
A distinguishing feature of AutoCount is its consistent segmentation accuracy, which differs from IMJ Edge, which relies on edge detection to identify particles.14 While edge detection methods, as employed by IMJ Edge, work effectively for low-confluence images with distinct cell boundaries, its performance declines at high-confluence conditions.14,26 We found that the edge-detection method tends to group adjacent cells into a single unit, thereby, misidentifying individual cells as an entire monolayer. Another ImageJ macro, CymoSize, depends upon the high-resolution H&E images for size determination and again not suitable for dense images.20
An additional advantage of AutoCount is its effective, built-in ability to reduce background fluorescence for quantification. In protocols involving fluorescence imaging, background signals caused by non-specific artifacts or noise are unavoidable and can vary in intensity, potentially compromising the accuracy of quantification.36 AutoCount addresses this issue through three key mechanisms, all of which can be defined by the user to suit their specific datasets. We have incorporated Split Channel tool, which isolates the desired fluorescence while removing background noise originating from overlapping light spectra. The primary minimization step occurs during the thresholding and “Find Maxima” stages, to control the thresholding parameters. During these stages, most background signals are excluded as they lack a defined area vector. This robust check-and-balance system ensures accurate signal segmentation. Furthermore, users can define a minimum particle size threshold to exclude background fluorescence artifacts that may have passed through earlier filters. This final step retains only meaningful signals while eliminating irrelevant noise, significantly enhancing the accuracy and reliability of the analysis. By contrast, other methods such as IMJ edge, despite cell size gating and outlier removal, fail to filter out background signals, compromising the quantification of true fluorescent targets.14 Importantly, this limitation is not due to user-defined parameters, as all parameters for the outlier removal steps were optimized according to the methodology described elsewhere.14 Additionally, the minimum cell size threshold was consistently maintained across all trials for both AutoCount and IMJ Edge. It is important to note that while IMJ Edge showed no statistically significant differences for medium- and low-confluence images, the quantification included background fluorescence signals. We showed that AutoCount can achieve precise and accurate quantification. This effectiveness of AutoCount is further demonstrated for varying confluent images, reinforcing its ability to handle images with different cell densities with precision. Moreover, when compared to the results of two manual experts, AutoCount consistently produced average cell counts with no statistically significant differences.
We demonstrated the utility of AutoCount in two distinct biological systems and assays, highlighting its accuracy and applicability. In the first example, cytotoxicity assays were conducted to assess cell death under three experimental conditions with varying degree of cell death. AutoCount reliably quantified the live–dead cells with no significant differences when compared to manual count. In the second example, AutoCount was used to evaluate pluripotency in stem cells, a critical metric for assessing their pluripotency. Once again, AutoCount delivered results consistent with those obtained through manual analysis, confirming its reliability in handling diverse experimental frameworks. These findings collectively establish AutoCount as a robust and versatile tool for biological quantification across varied research applications. While we have not tested the usage of AutoCount for tissue sections, we propose that this should execute well for the tissue sections as well. Notably, our analysis showed that the outcomes of AutoCount analysis were similar to that of CellProfiler software; however, the major limitation of CellProfiler is the need to generate a defined pipeline prior to use. Therefore, we believe that AutoCount will be a widely used macro.
Additionally, advanced computational approaches have led to the development of several automatic cell counting macros for ImageJ. For example, Lusca employs machine learning to analyze cellular and subcellular neuronal structures.21 Similarly, Automatic Cell Counting with Trainable Weka Segmentation allows for flexible automatic cell counting via object segmentation after user-driven training.15 However, these methods are tailored toward specific cell type or tasks. Similarly, other machine learning programs have been developed for other applications. For example, Cellpose's Cyto2 provides a streamlined method for both training custom cell counting models and utilizing pretrained models developed from user-submitted images.37 However, Cellpose requires a Python installation in addition to ImageJ plugins (BIOP) to use.
Possibility of errors associated with AutoCount
While AutoCount demonstrates high accuracy and shows strong alignment with manual methods, errors (however minimal) can occasionally be encountered. Based on our analysis, these errors are mainly associated with poor image quality such as nonuniform fluorescence intensity. We highly recommend users to capture the images in a similar microscope setting to that of the representative image. Furthermore, close attention is needed to optimize the initial user-defined parameters, including thresholding, prominence, and particle size, to avoid inadequate segmentation. For example, deviations may occur in images with floating cells or with challenging fluorescence patterns. We estimated the error range between 0.4 and 3.2% (Table2). These issues can be avoided by the iterative optimization of user-defined settings to ensure the accuracy and reliability of automated tools like AutoCount in complex quantification tasks.
Conclusion
Overall, this study presents AutoCount, an automated ImageJ macro developed to streamline and enhance the quantification of fluorescent cell images. AutoCount enables efficient batch processing, allowing analysis of hundreds of images with high accuracy. Its optimization ensures effective distinction of adjacent cell bodies and cell monolayers, accommodating various cell densities and assays. AutoCount demonstrates performance comparable to expert manual counts, thereby enhancing reproducibility while reducing subjectivity and bias in image quantification. AutoCount is a freely available tool to use with ImageJ software, making it an accessible and practical solution for researchers in need of automated image quantification.
Superior performance of AutoCount relative to other similar macros
We compared the applications of AutoCount with other macros including IMJ Edge, CymoSize, and protocol published by Grishagin etal. We summarized the applicability of these macros in this table. We found that the AutoCount showed a superior performance relative to other macros in particular for overlapping cells, fluorescence image analysis, and user input parameters. Tick-marks (
Indices of error using AutoCount macro
The table summarizes error rates associated with the use of AutoCount for fluorescent cell quantification. Errors typically fall into two categories: (1) undercounting, often results from the segmentation of overlapping cells as a single cell, and (2) overcounting, typically caused by the quantification of background fluorescence or segmentation of a single cell as multiple cells. This study analyzed error incidence across low, medium, and high cell confluence levels. Low-confluence images exhibited the highest overall error rates across all categories, while high-confluence images demonstrated the lowest error rates except for over segmentation errors, where medium-confluence images displayed the fewest occurrences. Error rates were calculated by quantifying the frequency of each error type in AutoCount segmentation results and normalizing these values against the average counts from two expert manual analyses. Each confluence level was evaluated with n = 3 images. The results highlight the variation in AutoCount performance depending on cell density, providing insights into optimizing its use under different experimental conditions.
Footnotes
Acknowledgments
We acknowledge the help with the fluorescence microscope located in the laboratory of Dr. Brenda Ogle, Department of Biomedical Engineering, University of Minnesota.
References
Supplementary Material
Please find the following supplemental material available below.
For Open Access articles published under a Creative Commons License, all supplemental material carries the same license as the article it is associated with.
For non-Open Access articles published, all supplemental material carries a non-exclusive license, and permission requests for re-use of supplemental material or any part of supplemental material shall be sent directly to the copyright owner as specified in the copyright notice associated with the article.