
Abstract
Risk taking (RT) is an essential component in decision-making process that depicts the propensity to make risky decisions. RT assessment has traditionally focused on self-report questionnaires. These classical tools have shown clear distance from real-life responses. Behavioral tasks assess human behavior with more fidelity, but still show some limitations related to transferability. A way to overcome these constraints is to take advantage from virtual reality (VR), to recreate real-simulated situations that might arise from performance-based assessments, supporting RT research. This article presents results of a pilot study in which 41 individuals explored a gamified VR environment: the Spheres & Shield Maze Task (SSMT). By eliciting implicit behavioral measures, we found relationships between scores obtained in the SSMT and self-reported risk-related constructs, as engagement in risky behaviors and marijuana consumption. We conclude that decontextualized Virtual Reality Serious Games are appropriate to assess RT, since they could be used as a cross-disciplinary tool to assess individuals' capabilities under the stealth assessment paradigm.
Introduction
Risk taking (RT) is a component of the decision-making process in a particular situation that involves uncertainty, in which the subject rationally knows the probability of each outcome for each option.1,2 Decision making is influenced by three main factors: decision features, situational factors, and individual differences.3,4 Within this framework, the role of RT as a component of decision-making process makes this tendency to take risks dependent on decision features, situation factors, and individual differences as well. Several decisional and situational factors have been proposed as RT determinants. Risk and return trade-off, “hot” versus “cold” involvement, and uncertainty seem to be the most well-accepted contextual determinants of RT. 5
Meanwhile, these three contextual elements depend largely on the individual perception and interpretation of the situation. In this context, situation awareness is a stage in the decision-making process, which can influence the final decision. 6 It is described as the perception of the elements that compose the environment, the interpretation of this information, and the projection of possible changes in the near future, 7 and has been seen as a contributory factor in accidents and incidents in different areas. 8
To the extent of our knowledge, individual differences in the RT field, specifically the role of personality traits, have received less scientific attention than the decisional and situational factors. Personality may lead to cognitive and emotional biases in risky decision making, 9 affecting expected benefits, the perception of the risks, and the risk attitude when facing a situation. A biased perception of risk—understood as the subjective evaluation of a risk—can lead to misjudgments of potentially hazardous risk sources, 10 and should be corrected. 11
RT process starts with a deliberation and weighing-up phase. During this stage, the subject thinks about the possible positive/negative outcomes of his/her actions before acting. 12 During this process, personality traits influence the individual's approach to RT, prompting risk-seeking or risk-aversion behaviors. In particular, sensation seeking and impulsivity have been shown to be related to RT as they predetermine the individual's perspective of the reward/risk conflict. 12 This pursuit of intense sensations and experiences, combined with nonreflexive behaviors, may result in daring decisions. Both impulsivity and sensation seeking have been related to RT behaviors in several domains, such as driving, 13 risky sex, 14 substance use, 15 and marijuana consumption. 16 For example, in marijuana consumption, individuals with high impulsivity and sensation seeking have shown to be more likely to consume marijuana, since they present poor inhibitory control and susceptibility to the expected reward.17–19 Although these studies analyze RT behaviors in relation to conducts and habits in specific domains, they provide overall interesting results because they demonstrate that there is a general personal disposition toward RT, which can be generalized to several situations.20,21 In fact, this cross-situation risk factor and its relation to sensation seeking and impulsivity are consistent with personality theories, which argue that personality traits remain fairly stable during different situations. 21 We underline the contribution of this important issue to the final goal of our work, which is to foster the creation of domain-independent RT evaluation tools.
RT assessment is a nonstandardized practice that has been addressed from varying perspectives. Self-report measurement is the method most used for evaluating RT behaviors, although, to our knowledge, no single scale can measure RT from just one point of view. On the one hand, some authors employ self-reported measures based on risk-related psychological constructs, such as personality,22,23 impulsivity, 22 sensation seeking,22,24 and situational awareness. 22 On the other hand, some authors used self-reported daily habits as a measure of RT.12,25 In addition, diverse issues in the use of survey measures have been identified, 26 as well as matching self-report measures with real-world actions may lead to low-validity conclusions. 27
To overcome these issues, an emerging research field is focusing on how psychocognitive states can be assessed in an ecological, nonintrusive, nonbiased way. The approach is termed “stealth assessment” 28 ; and is a process where subjects' performance data are continuously recorded during a game/serious game and, at its end, conclusions are drawn about individual competencies based on the data. In this framework, behavioral tasks can be an alternative method to self-reports that might provide a more ecological and nonbiased response. In RT domain, the most used behavioral tasks are the Bechara Gambling Task 29 and the Balloon Analogue Risk Task. 22 Behavioral tasks, undertaken at the laboratory level, enable close monitoring of all the potentially influential variables affecting subjects' responses.
However, subjects are normally confronted with controlled stimuli that do not include variables present in real-life situations. This compromises the ecological validity of measurements. Previous results indicate that these tasks have weak correspondence with real-life behaviors,30–32 mainly because of the absence of consequences. 33
In contrast, there is empirical evidence demonstrating similarities between neural mechanisms that subjects experience when immersed in a virtual reality (VR) environment and in real life.34,35 In support of this idea, and due to recent advances in hardware and software costs and performance, Virtual Reality Serious Games (VRSGs) have become an innovative, effective, active, engaging, and adaptive medium capable of overcoming the limitations of most traditional methodologies.36,37 There is a sound research basis supporting the proposition that VRs immersive capabilities make VRSG a better choice than 2D and nonstereoscopic 3D displays.38–44 Starting from these premises, we propose VR as a powerful, reliable, ecological tool to study, under laboratory conditions, the cognitive and affective aspects of human behavior related to RT processes.
We present the Spheres & Shield Maze Task (SSMT) as a VR behavioral task for RT measurement. The aim of this study is to understand the relationship between the SSMT outcomes and sensation seeking and impulsivity (risk-related factors), work situational awareness (WSA), engagement in risky behaviors and marijuana consumption. The study hypotheses are as follows:
Methods
Participants
Forty-one individuals participated in the study (29 men and 12 women, mean age = 24.22, SD = 7.80). They are students at the degree in the Design and Development of Videogames and Interactive Experiences. Before their participation, they received written information on the study and gave their written consent for their involvement. The study obtained the ethical approval of the Ethical Committee of the authors' institution (Approval Number: P1_06_06_18).
Questionnaires
- Spanish version of the 40-item Sensation Seeking Scale-V (SSS-V).45,46
- Spanish version of the 30-item Barratt Impulsiveness Scale (BIS-11).47–49
- WSA scale. 50
- As a measure of RT propensity, participants responded “yes” or “no” to engaging in the following during the previous year: (1) smoking, (2) drug use, (3) alcohol consumption, (4) risky sex, (5) stealing, and (6) not using a seat belt while driving. These measures have been used previously to assess RT and as an index of engagement in risky behaviors in daily life. 51 We produced a total index by summing the reported risk behaviors (min. 0; max. 6).
- As a measure of marijuana consumption, participants responded “yes” or “no” to the question of whether they had taken marijuana during the previous 12 months (even once).
The SSMT
The SSMT is an interactive virtual environment that mimics an out-of-context maze, through which participants have to pass without (virtually) hurting themselves, from start to finish before the allocated time expires. The subjects have 3 minutes to negotiate the maze (primary mission), and they are instructed to accumulate as much “karma” as possible (secondary mission). There are spheres distributed throughout the maze, which earn participants “karma” if they collect them. Furthermore, participants can lose “karma” if they are attacked by a risk. These risks are also distributed throughout the maze and are of three types: fires, precipices, and slippery puddles. Some spheres are close to hazards, and others are located in no-risk zones.
Participants have the option of activating a shield, which protects them from the risks. When the shield is active, the user's speed is reduced and (s)he cannot collect any spheres. The shield is a finite resource that subjects need to optimize. While passing through the maze, the participants have information about the remaining battery life of the shield and how much of their allocated time remains. The navigation metaphor is natural walking combined with indirect walking, in which pushing down on the controller's integrated touchpad moves the user's avatar in the direction (s)he is facing at 2 m/s (speeds >3 m/s can increase cybersickness symptoms) (Figs. 1 and 2). 52
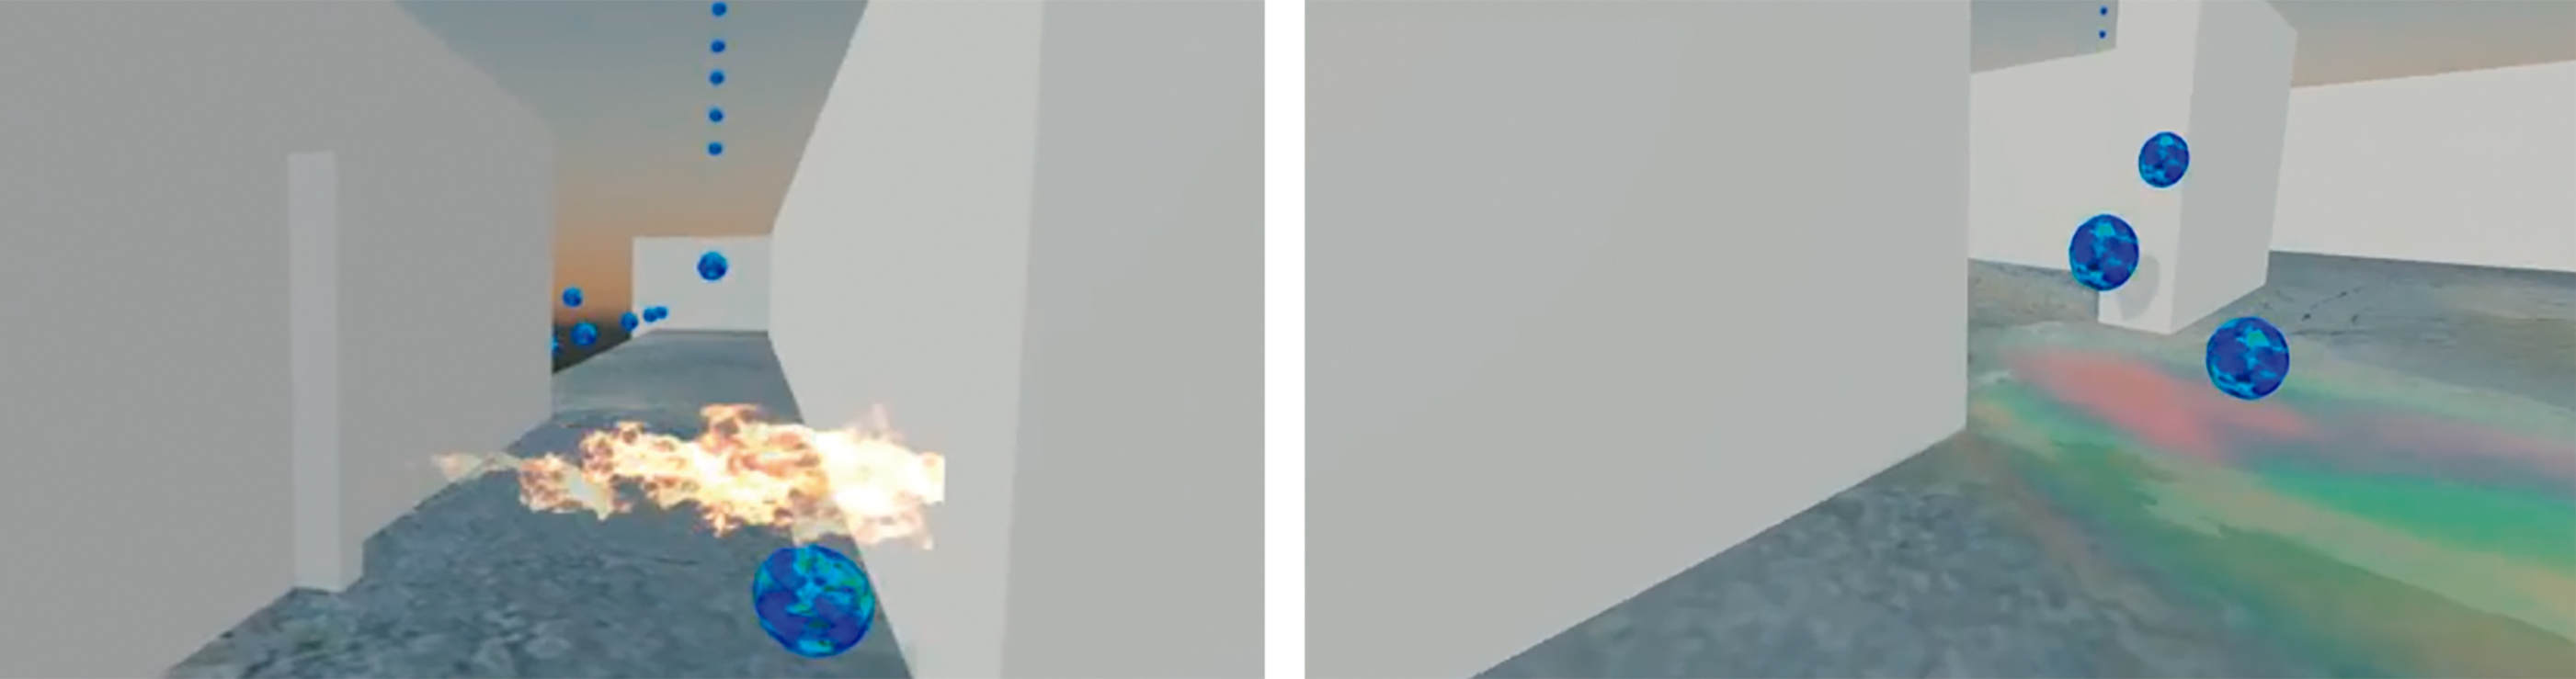
Screenshots of the SSMT with fire and precipice (left) and slippery puddle (right). SSMT, Spheres & Shield Maze Task. Color images are available online.
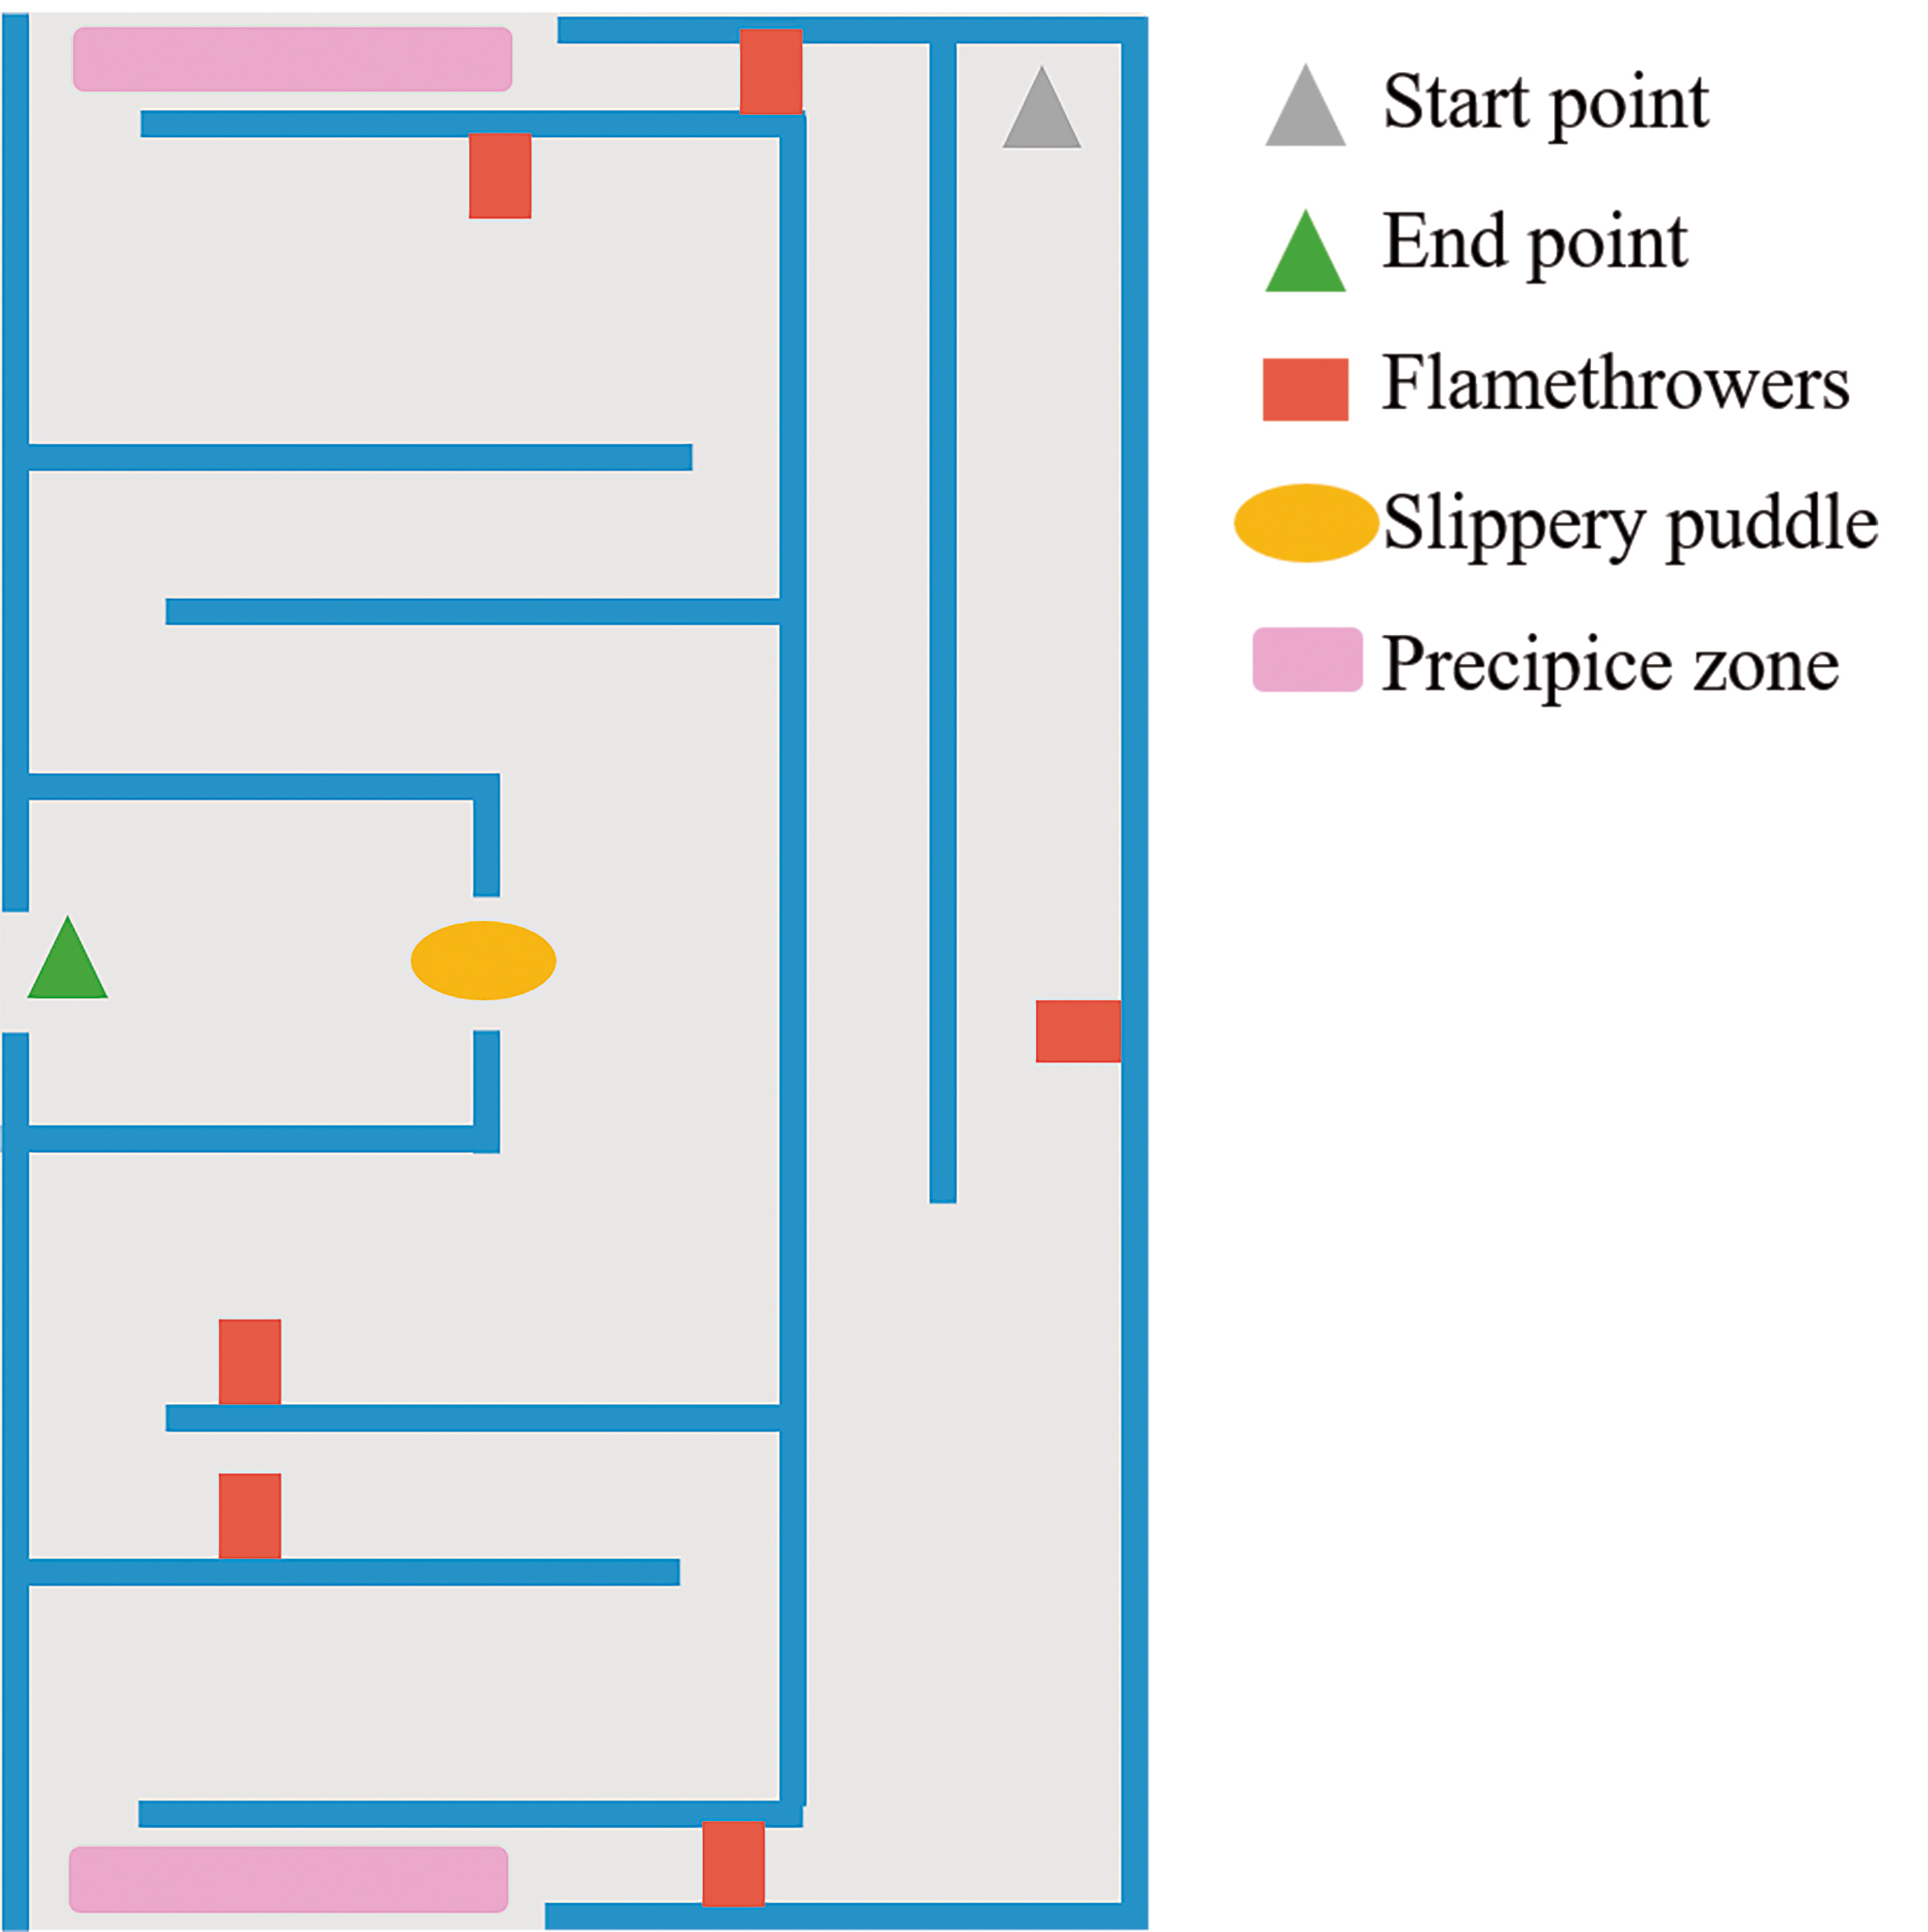
Top view of the maze and risk distribution. Color images are available online.
Before undertaking the SSMT, the participants underwent a practice session. As seen in Figure 3, the subjects had to travel to three spotlights on the floor to practice the locomotion technique. They were also asked to collect some spheres and to activate the shield while they traveled through the training area. To assess if the time dedicated to the practice session was appropriate, the participants passed through the maze twice after they received the SSMT instructions.
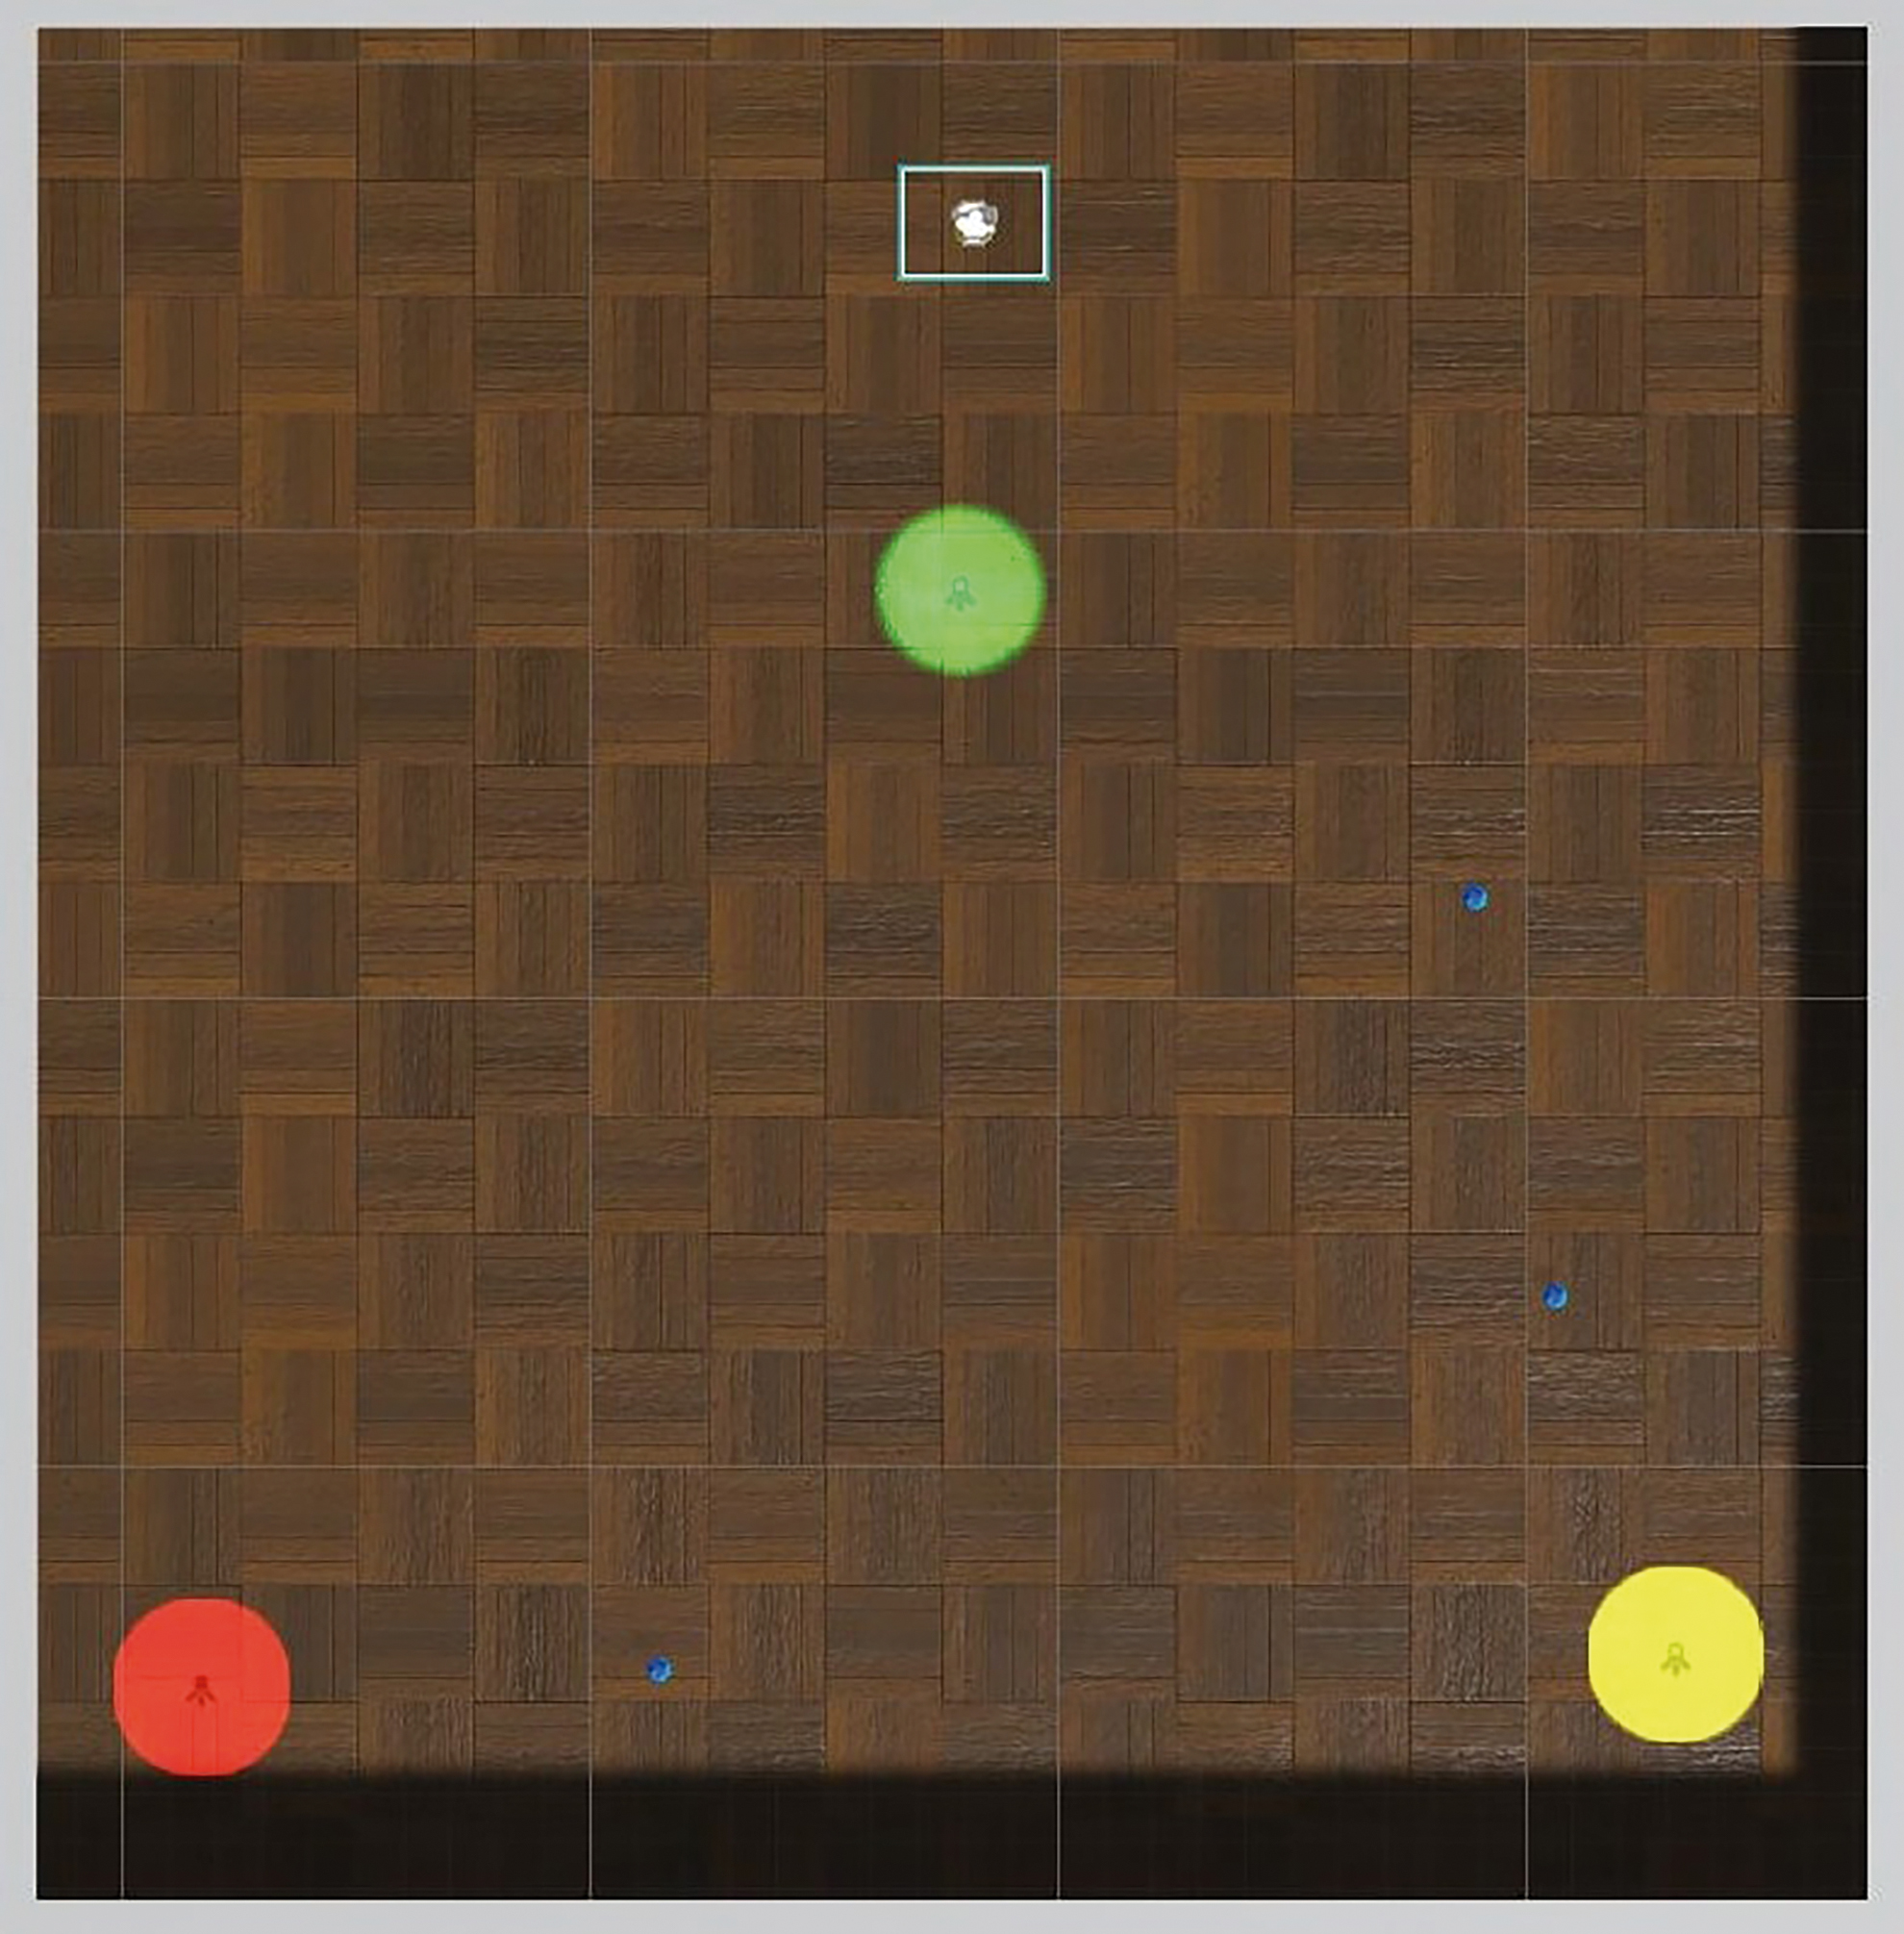
Screenshot of the practice SSMT session. Color images are available online.
Participants performed the SSMT using the HTC Vive head mounted display, with 2,160 × 1,200 pixels (1,080 × 1,200 per eye), a field of view of 110°, working at 90 Hz refresh rate. We analyzed the metrics of solving time, distance covered, “karma” collected, and shield use. The solving time refers to the time elapsed since the subject began the maze until (s)he reached the exit and was calculated in seconds. The distance covered is the total distance traveled by the subject from the beginning of the maze until (s)he reached the exit, measured in meters. The “karma” is a score derived from the difference between the number of spheres collected and the seconds elapsed while the subject was attacked by a risk. Finally, the shield use is a score calculated by multiplying the seconds with the shield active and the intensity with which the shield was used. The intensity is a value between 0 and 100 that reflects the intensity with which the trigger of the controller was pressed.
Data analysis
Statistical analyses were carried out using SPSS version 22.0 (Statistical Package for the Social Sciences for Windows, Chicago, IL) for PCs. First, a multivariate outlier detection test was performed. The Mahalanobis distances between the subjects were calculated, and thereafter a chi-square (χ 2 ) test was performed. The subjects who belonged to the most extreme one percent of the data distribution were defined as outliers. In total, three outliers were found. We assessed the normality of the variables and the internal consistency of the self-report scales. T-test analyses were carried out to identify if there were significant differences between the first and second trial of the SSMT. The Pearson correlations between each pair of numerical variables were computed to examine the linear dependency between the measures of the risk-related constructs, the WSA and the SSMT variables.
We carried out Spearman's correlations to verify if there were significant associations between risk behaviors, risk-related constructs, and the SSMT variables. A Poisson regression was performed to predict the number of risky behaviors that subjects would engage in based on the risk-related constructs and the SSMT scores. To explore the importance of each variable, a first Poisson regression was performed accounting for the risk-related and the SSMT variables. The subscale with the highest P value was removed from the initial inputs, which resulted in a new set of inputs for the following regression. The computation of the P value of the inputs was based on the null hypothesis that all the linear coefficients of the regression were zero. This process continued iteratively until the model included a set of inputs with every P value <0.05.
Regarding marijuana consumption, we carried out t-test analyses to verify if there were significant differences between groups (consumers and nonconsumers) in risk-related constructs, WSA and SSMT outcomes, and finally we performed a logistic regression to analyze the effects of self-report variables and SSMT metrics on the subjects' marijuana use. In the same way as in the Poisson regression mentioned above, an iterative process of removing the variable with the highest P value was performed until the model included a set of inputs with every P value <0.05.
Results
The final dataset included 38 subjects (26 men and 12 women; mean age = 23.87, SD = 7.46). The assumption of normality was confirmed in all variables (Kolmogorov–Smirnov p > 0.05), except in the SSMT Time variable and in the risky behaviors score (p < 0.05), and the internal consistency of the self-report scales was confirmed (Cronbach's αBIS = 0.616, αSSS-V = 0.877, αWSA = 0.713, bootstrap; 95%). Table 1 presents the descriptive statistics for the self-report and SSMT variables.
Descriptive Statistics of Self-Report and Spheres & Shield Maze Task Variables
1. Barratt Impulsiveness Scale (BIS), cognitive impulsiveness; 2. BIS, motor impulsiveness; 3. BIS, nonplanning impulsiveness; 4. BIS; 5. Sensation Seeking Scale-V (SSS-V), adventure seeking; 6. SSS-V, experience seeking; 7. SSS-V, disinhibition; 8. SSS-V, Boredom susceptibility; 9. SSS-V; 10. Work Situation Awareness (WSA), concentration; 11. WSA, anticipation; 12. WSA, attention; 13. WSA, distraction; 14. WSA; 15. Solving Time in SSMT-First Trial (SSMT_T_FT); 16. Distance in SSMT-First Trial (SSMT_D_FT); 17. Karma in SSMT-First Trial (SSMT_K_FT); 18. Shield in SSMT-First Trial (SSMT_S_FT); 19. Solving Time in SSMT-Second Trial (SSMT_T_ST); 20. Distance in SSMT-Second Trial (SSMT_D_ST); 21. Karma in SSMT-Second Trial (SSMT_K_ST); 22. Shield in SSMT-Second Trial (SSMT_S_ST); 23. Risk behaviors score.
SD, standard deviation; SSMT, Spheres & Shield Maze Task; WSA, work situational awareness.
T-test analyses were carried out to identify if there were significant differences between the first and second trial performance. Although we did not find significant differences (p > 0.05), we observed an adaptation period that distorted the data in first trial. Although participants seemed to be prepared to enter the maze after the practice session, they showed disorientation during the first trial. Furthermore, some subjects expressed doubts about the interaction and mechanics of the task, which remained unclear after the practice session. In addition, some of the subjects verbalized after the experiment that in the second trial they felt more secure and had not doubts about interactions and mechanics of the task. For this reason, we assumed that there was a lack of practice and expertise in the first trial, which will be discussed in later sections; and the following analyses were performed with the results of the second trial.
Table 2 shows the correlations between the self-report measures and the variables SSMT_Distance, SSMT_ Karma, SSMT_Shield, and SSMT_Time.
Pearson's Correlations Between Self-Report and Spheres & Shield Maze Task Variables
p < 0.05; **p < 0.01.
We carried out Spearman's correlations to verify if there were significant associations between risk behaviors, risk-related constructs, and SSMT outcomes (Table 3).
Spearman's Correlations Between Risk Behaviors, Risk-Related Constructs, and Spheres & Shield Maze Task Variables
p < 0.05; **p < 0.01.
A Poisson regression was performed to predict the number of risky behaviors that subjects would engage in based on the risk-related constructs and the SSMT scores. According to the results, for each point scored in experience seeking, 1.340 (95% CI 1.102–1.630) times riskier behaviors will be engaged in by the participants (P = 0.003). For each point of the shield use scored in the SSMT, 0.998 (95% CI 0.996–1) times riskier behaviors will be engaged in by the participants (p = 0.038).
As an additional analysis, we compared the results of participants who reported marijuana consumption (N = 15) and those who did not (N = 23). We carried out t-test analyses to verify if there were significant differences between groups in risk-related constructs, WSA and SSMT outcomes (Fig. 4).
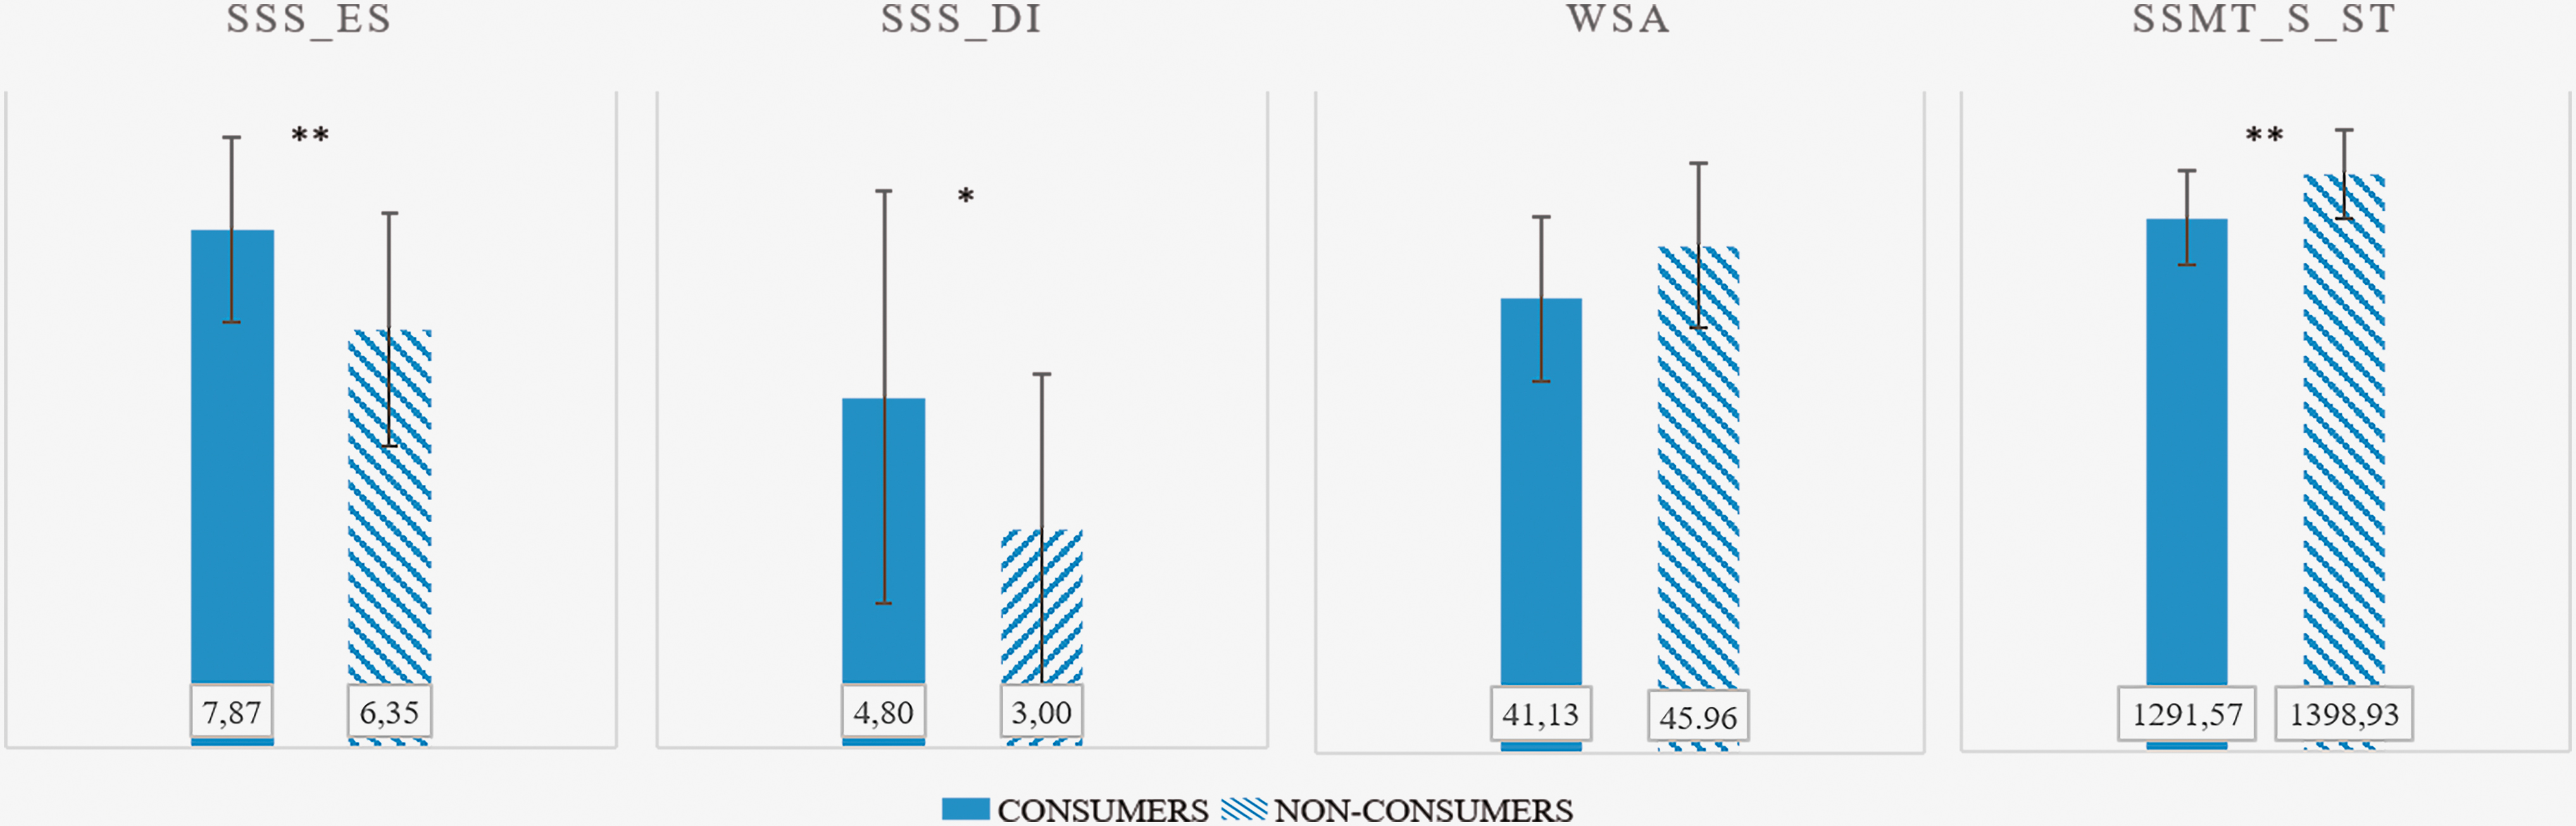
T-test results of self-report and SSMT variables between marijuana consumers and nonconsumers. Bars represent the average and lines represent the standard deviation. *p < 0.05, **p < 0.01. Color images are available online.
We performed a logistic regression to analyze the effects of self-report variables and SSMT metrics on the subjects' marijuana use. The logistic regression model was statistically significant (χ 2 12.424, P < 0.01) and explained 37.8 percent (Nagelkerke R2) of the variance in marijuana use. The model correctly classified 76.3 percent of cases. The model shows that marijuana consumers have higher scores in experience seeking and reduced use of the shield in the SSMT (see Table 4 for further details on the regression analysis).
Summary of the Logistic Regression Analysis Predicting Marijuana Consumption
CI, confidence interval; SE, standard error.
Discussion
The main goals of this article were to evaluate a VRSG designed to assess RT and to prove that virtual environments can provide effective metrics under the stealth assessment paradigm.
We found significant associations between the SSMT results and the risk-related constructs measured—impulsivity and sensation seeking. Sensation seekers covered more distance in the maze and were not satisfied only with finding the exit. Collecting spheres located next to hazards involves a risk of coming to harm. In this case, impulsive individuals would be less reflective about the potential risk and decided to collect spheres although they are next to hazards. Participants with high nonplanning impulsivity and disinhibition preferred not to use the shield in most cases, even though this carried danger. Nonplanning impulsivity involves lack of anticipation, 47 which is consistent with limited shield use. Nonimpulsive participants may take the shield into account and use it more than impulsive participants. Disinhibition refers to the tendency toward hedonistic preferences 53 and has been related to imprudent behaviors. 54 Disinhibited participants might see the shield as unnecessary overprotection, so they did not use it as much as nondisinhibited subjects. These results support hypothesis 1, since sensation seeking and impulsivity were expected to be related to the SSMT results.
Regarding hypothesis 2, the WSA showed negative significant correlations with “karma” and positive significant correlations with shield use. WSA also showed negative significant correlations with impulsivity and sensation seeking. This could represent a thoughtless individual who gets bored easily, is looking always for new experiences, and has less risk awareness. These results suggest that participants with high WSA anticipated and planned for what was going to occur, inhibited impulses, and did not underestimate the risks in the SSMT, accepting hypothesis 2.
The associations among impulsivity, sensation seeking, and engaging in risky behaviors were calculated. The results showed that there is a positive relationship between the experience seeking and disinhibition dimensions and engaging in risky behaviors. These results are consistent with other investigations that found significant associations between engaging in risky behaviors and sensation seeking. 51 Furthermore, the dimensions of experience seeking and disinhibition are shown to be significant predictors of RT, 55 and have been related to risk habits. 25 The experience seeking and disinhibition dimensions represent less socially acceptable forms of sensation seeking. 56 In particular social circles, this nonacceptance is diluted, since individuals with similar levels of sensation seeking tend to join together. 25 These results partially support hypothesis 3, which pointed out that both impulsivity and sensation seeking are related to engaging in risky behaviors.
Regarding hypothesis 4, participants with higher scores for engaging in risky behaviors used the shield less than those with low scores for engaging in risky behaviors. The results of the regression analysis showed that experience seeking and shield use are significant predictors of engaging in risky behaviors. Consequently, hypothesis 4 is accepted.
Regarding hypotheses 5 and 6, differences between marijuana consumers and nonconsumers in risk-related constructs and in the SSMT were calculated. The results showed that marijuana users have higher levels of experience seeking and disinhibition than nonusers, partially supporting hypothesis 5, which pointed out that both impulsivity and sensation seeking are related to marijuana consumption. The relation between marijuana consumption and sensation seeking has previously been established. 57 Other studies have found that sensation seekers show high levels of intention to use marijuana in the future. 58 Nonconsumers also showed higher WSA. This outcome is consistent with the above results, since risk underestimation seems to be common among marijuana consumers and those who score low in the WSA. Regarding SSMT metrics, consumers protected themselves with the shield less than nonconsumers. The logistic regression analyses showed that experience seeking and shield use are both predictors of marijuana consumption. This is in line with hypothesis 6, which also posited that distance covered and “karma” would be related to marijuana consumption. As previously mentioned, shield use seems to be related to planned and prudent behaviors. These results are consistent with the results of BT that aim to measure RT. The degree of inflation of the balloons in the Balloon Analogue Risk Task was correlated with drug use, and this metric was a predictor of substance use and risky sexual behaviors. 30 Poor performance in the Bechara Gambling Task was related to participants with substance use disorders. 59 The Bechara Gambling Task is shown to be an appropriate measure for substance use disorders only for men, since the results for this task varied significantly between males and females. 60
Limitations
We acknowledge that this study has some methodological limitations. First, the sample size is not large, and the participants were recruited in a university environment, so it is not a sample that faces occupational risks in daily life. For future investigations, we will recruit a larger sample of participants who face risks in the workplace. Second, the practice session and adaptation period needed for the SSMT were unknowns, so the participants performed the SSMT twice to guarantee they fully understood the task. We will take this in account in future research, and will allow the participants a longer practice session. In addition, we will include mechanisms to make sure participants have fully understood mechanics and interactions of the game, to avoid potential external biases. Third, we assessed only the behavioral metrics of time, “karma,” distance, and shield use, ignoring real-time behavioral and psychophysiological measures, such as trajectories, eye movements, and galvanic skin response. Last, the risks in the SSMT had no consequences in the virtual world, besides a reduced “karma” score. For future investigations, we intend to improve the SSMT by enriching its appearance and giving the risk consequences to make them more realistic. In addition, we will include eye tracking and galvanic skin response measures to supplement and better interpret the SSMT scores.
Conclusions
RT is essential in the decision-making process, and is a field of interest both for psychologists and for safety authorities. In this article, we present the SSMT as a first step in the development of a new VR behavioral tool to measure implicit processes involved in RT. The results of this study suggest that decontextualized VRSGs are appropriate to assess RT, since they could be used as a crossdisciplinary tool to assess individuals' capabilities.
Footnotes
Author Disclosure Statement
No competing financial interests exist.
Funding Information
This work was supported by the Spanish Ministry of Economy, Industry and Competitiveness funded projects “Advanced Therapeutic Tools for Mental Health” (DPI2016-77396-R), and “Assessment and Training on Decision Making in Risk Environments” (RTC-2017-6523-6) (MINECO/AEI/FEDER,UE) and by the Generalitat Valenciana funded project “Rebrand” (PROMETEU/2019/105).