
Abstract
Genome-wide genetic screens using CRISPR-guide RNA libraries are widely performed in mammalian cells to functionally characterize individual genes and for the discovery of new anticancer therapeutic targets. As the effectiveness of such powerful and precise tools for cancer pharmacogenomics is emerging, tools and methods for their quality assessment are becoming increasingly necessary. Here, we provide an R package and a high-quality reference data set for the assessment of novel experimental pipelines through which a single calibration experiment has been executed: a screen of the HT-29 human colorectal cancer cell line with a commercially available genome-wide library of single-guide RNAs. This package and data allow experimental researchers to benchmark their screens and produce a quality-control report, encompassing several quality and validation metrics. The R code used for processing the reference data set, for its quality assessment, as well as to evaluate the quality of a user-provided screen, and to reproduce the figures presented in this article is available at https://github.com/DepMap-Analytics/HT29benchmark. The reference data is publicly available on FigShare.
Introduction
Genome-wide CRISPR-Cas9 screens are being increasingly used to explore various genotype–phenotype associations, to identify genes whose function is essential for cell viability and proliferation (essential genes or fitness genes), and new potential targets for personalized anticancer therapies.1–6 Several methods exist for assessing the quality of the data sets derived from these screens, evaluating sequence quality, single-guide RNA (sgRNA) count distributions, and negatively selected genes. 7 In addition, comprehensive analyses have been performed to evaluate the level of reproducibility and integrability of large-scale cancer dependency data sets assembled from independently performed CRISPR-Cas9 screens.8,9 However, to date, no easy-to-use tool kit is available to assist experimental scientists in assessing newly established genome-wide CRISPR-Cas9 genetic screening workflows employing pooled sgRNA libraries in their laboratories.
In Behan et al., we performed genome-wide CRISPR-Cas9 fitness screens of 339 cancer cell lines from the Cell Models Passport panel.6,10 We analyzed the resulting data with an ad hoc computational pipeline designed to identify new anticancer therapeutic targets at a genome-scale. To this aim, we defined quality control assessment practices and applied stringent quality control criteria, finally retaining data for 324 cell lines. Via a target-prioritization bioinformatic pipeline, we predicted and validated a novel selective therapeutic target for colorectal cancers with microsatellite instability: the Werner syndrome ATP-dependent helicase (a finding simultaneously reported by other independent studies).6,11–13 Results and data sets from this study are publicly available on the Project Score data portal (https://score.depmap.sanger.ac.uk). 14 As part of this effort, we screened the HT-29 colorectal cancer cell line with the same experimental settings in multiple batches and dates, to assess the robustness and reproducibility of our experimental pipeline.
In this study, we provide an analytical tool implemented in the HT29benchmark R package and high-quality data from 30 screens of the HT-29 cell line yielding reliable gene essentiality profiles. 15 We propose the use of these data and software as a simple tool kit for benchmarking and validating the correct establishment of a genome-scale CRISPR-Cas9 knockout screening pipeline, through the execution of calibration experiment using the Human Improved Genome-wide Knockout CRISPR sgRNA library (the Sanger library, available on Addgene). 16 By performing a single calibration screen of the HT-29 cell line with the Sanger library and settings described in Behan et al., experimental scientists can assess the quality and reproducibility of their experimental workflow by processing resulting data with the HT29benchmark R package, which implements a diversified set of metrics to compare new data with expected outcomes.
Data and code, including the HT29benchmark R package, are available at https://score.depmap.sanger.ac.uk/downloads, FigShare and https://groups-dashboards.fht.org/iorio/14–17
Materials and Methods
Reference data set generation: CRISPR-Cas9 screens
The protocol used for the generation of Cas9-expressing HT-29 cell lines and transduction of the Sanger library is described in Behan et al. and Tzelepis et al.6,16 Briefly, we used the commercially available Sanger Library v1.0 (67989; Addgene), encompassing 90,709 sgRNAs targeting 18,009 genes, and a second version of the same library (Sanger library v1.1), including all the sgRNAs from v1.0 plus 1004 nontargeting sgRNAs, and 5 additional sgRNAs targeting 1876 selected genes encoding kinases, epigenetic-related proteins, and predefined fitness genes, for a total of 10,381 additional sgRNAs. Plasmids were packaged using the ViraPower Lentiviral Expression System (K4975-00; Invitrogen) as per the manufacturer's instructions. Cells were transduced with a lentivirus containing Cas9 in T25 or T75 flasks at ∼80% confluence in the presence of polybrene (8 μg mL−1) and incubated overnight followed by replacement of the lentivirus-containing medium with a fresh complete medium.
Blasticidin selection commenced 72 h after transduction at an appropriate concentration determined for each cell line using a blasticidin dose–response assay (blasticidin range, 10–75 μg mL−1), and cell viability was assessed using the CellTiter-Glo 2.0 Assay (G9241; Promega). Cas9 activity was assessed as described previously. 16 Cell lines with Cas9 activity over 75% were used for sgRNA library transduction.
A total of 3.3 × 10⁷ cells were transduced with an appropriate volume of the lentiviral-packaged whole-genome sgRNA library to achieve 30% transduction efficiency (100 × library coverage). The volume was determined using a titration of the packaged library and assessing the percentage of blue fluorescent protein (BFP)-positive cells by flow cytometry. Transduction efficiency was assessed 72 h after transduction. Samples with a transduction efficiency between 15% and 60% were used for puromycin selection. The appropriate concentration of puromycin for each individual cell line was determined from a dose–response curve (puromycin range, 1–5 μg mL−1), and cell viability was assessed using a CellTiter-Glo 2.0 Assay (G9241; Promega). The percentage of BFP-positive cells was reassessed after a minimum of 96 h of puromycin selection. For samples with <80% BFP-positive cells, puromycin selection was extended for an additional 3 days and the percentage of BFP-positive cells was assessed again.
Cells were grown for 14 days following transduction with the Sanger Library (v1.0 or v1.1) and selection with a minimum of 5.0 × 10⁷ cells reseeded at each passage (500 × library coverage). Approximately 2.5 × 10⁷ cells were collected, pelleted, and stored at −80°C for DNA extraction. Genomic DNA was extracted from cell pellets using either the QIAsymphony automated extraction platform (QIAsymphony DSP DNA Midi Kit, 937255; Qiagen) or by manual extraction (Blood & Cell Culture DNA Maxi Kit, 13362; Qiagen) as per the manufacturer's instructions. Illumina sequencing and sgRNA counting were performed as described in Tzelepis et al. 16 Experiment identifiers and settings are fully described in Supplementary Table S1, summarized in Table 1, and further detailed in the methods section of Behan et al. 6
Reference HT-29 screening data set
Libraries, experiment identifiers, and transfection/selection efficiencies across screens.
Overall, we performed two independent experiments with the Sanger v1.0 library and four experiments with the Sanger v1.1 library. These can be regarded as biological replicates of HT-29 CRISPR screens, while each experiment has been performed with a varying number of technical replicates (from 3 to 9) for a total of 30 individual screens, as indicated in Table 1.
Reference data set preprocessing
We quantified and preprocessed post library-transduction and control library-plasmid sgRNA read counts as described in Behan et al., removing sgRNAs with <30 reads in the library-plasmid and keeping only sgRNAs in common between the two versions of the Sanger libraries. 17 Subsequently, we normalized counts across technical replicates, scaling each sample by the total number of reads. Post-normalization, we computed sgRNA log fold-changes (LFCs) between individual replicate read counts and library-plasmid read counts for each experiment, keeping the technical replicates separated (Supplementary Fig. S1). These preprocessing steps were performed with the ccr.NormfoldChanges function of our previously published CRISPRcleanR R package, using default parameters. 18 The same preprocessing steps can be now performed through our recently published, user-friendly, interactive web front-end to CRISPRcleanR: CRISPRcleanR WebApp (publicly accessible at https://crisprcleanr-webapp.fht.org), which does not require any bioinformatics/programming knowledge and can be used via the web browser. 19
Resulting data at all the intermediate preprocessing levels are included in our reference data set (available at: https://score.depmap.sanger.ac.uk/downloads, at https://groups-dashboards.fht.org/iorio/, and on FigShare). 17
Example of user-provided data
To demonstrate and test the diverse functionalities of the HT29benchmark R package, we used (as an example of user-provided data) a low-quality screen of the HT-29 cell line, which was discarded from the analysis set in Behan et al. as showing a low inter-replicate reproducibility, poor detection of known essential genes as significantly depleted across replicates, and encompasses six technical replicates of an HT-29 screen, obtained following the same screening protocol and the preprocessing steps described above.6,17
Receiver operating characteristic analysis
To compute receiver operating characteristic (ROC) and precision/recall (PrRc) curves, required to perform high-level quality control assessment of CRISPR-Cas9 screens, we used the HT29R.individualROC function of the HT29benchmark R package, which implements the ROC_Curve and PrRc_Curve functions of the CRISPRcleanR package (version 2.2.1), which itself implements the roc and coords functions of the pROC open-source R package (version 1.18.0).18,20
Fitness-effect threshold
Following the approach we presented in Pacini et al., we used a rank-based method to compute a fitness effect significance threshold for each HT-29 reference screen, thus identifying a set of significantly depleted (or essential) genes at a fixed level of 5% false discovery rate (FDR), based on their depletion LFCs. 9 Specifically, in a given screen, we first ranked all genes in increasing order of average depletion LFCs (based on the differential abundance of their targeting sgRNAs at the end of the assay versus plasmid control). Then we scrolled the obtained ranked list from the most depleted gene to the least depleted one, and we considered the depletion LFC r of each encountered gene as a potential threshold, that is, calling all genes with a depletion LFC <r significantly depleted.
Among the significantly depleted genes at a candidate threshold r, we focused only on those belonging to any of two prior known sets of essential (E) and nonessential (N) genes. 19 Considering these two sets as reference positive and negative controls, respectively, allowed us to compute a positive predictive value (PPV), thus an FDR (FDR = 1 − PPV). We finally select as fitness-effect significance threshold the largest r, yielding an FDR ≤0.05. We implemented this procedure using the roc and coords functions of the pROC open-source R package (version 1.18.0) implemented in the HT29R.ROCanalysis and HT29R.FDRconsensus functions of the HT29benchmark R package. 20
Data visualization
We used R base graphics plus the following R libraries and packages (listed in alphabetical order), all available on Bioconductor or on The Comprehensive R Archive Network (CRAN) repository: crayon version 1.5.1; enrichPlot version 1.14.2; GGally version 2.1.2; ggplot2 version 3.3.6; ggrastr version 1.0.1; grid version 4.1.0; gridExtra version 2.3; gtable version 0.3.0; RcolorBrewer version 1.1.3; VennDiagram version 1.7.3; and vioplot version 0.3.7. 15
Enrichment analysis
We performed Gene Ontology (GO) enrichment analysis to identify biological processes (BP) overrepresented in the list of HT-29-specific fitness genes. For this analysis, we used the org.Hs.eg.db R package (version 3.14.0) to retrieve the gene universe and the clusterProfiler R package (version 4.2.2) to perform the enrichment analysis of the HT-29-specific genes. 21
Data records
The entire HT-29 reference data set described here is available at different intermediate levels of preprocessing on the Project Score website https://score.depmap.sanger.ac.uk/downloads, at https://groups-dashboards.fht.org/iorio/, and on FigShare. 17
The main data folder contains four subfolders:
00_rawCounts assembled—Containing one tsv file for each HT-29 screen. Each file comprises the control library-plasmid sgRNA counts, as well as 14 days postselection sgRNA counts across technical replicates; 01_normalised_and_FCs—Containing Rdata files of normalized counts and depletion LFCs for the six screens, plots of counts' distribution pre- and postnormalization, and boxplots showing LFCs' distributions (PDF files); 02_lowLev_QC—subdivided in the following four subfolders: FC_distr—LFC distribution plots for each of the six screens, in PDF; FC_Rep_corr—Between-technical replicate correlation plots for each of the six screens, in PDF; PrRc_curves_ind_rep—Plots of technical replicate's PrRc curves quantifying essential/nonessential gene classification performances across the six screens, in PDF; ROC_curves_ind_rep—Plots of technical replicate's ROC curves quantifying essential/nonessential gene classification performances across the six screens, in PDF; 03_HL_QC_Stats—Density plots of depletion LFCs for reference gene sets across the six experiments with quality control values, in PDF.
Results
In the HT29benchmark package, we have implemented a set of reference metrics for the assessment of quality and reproducibility of CRISPR screens. In particular, these metrics assess sgRNA LFC distributions, screen outcomes' reproducibility across technical replicates, interscreen similarity, and screens' ability to detect known fitness genes among the significantly depleted ones. In this study, we report results from applying these metrics to technically validate our HT-29 reference data set, as well as to showcase how our package can be used to evaluate an example of user-provided data set. Furthermore, we report a set of reliable HT-29-specific fitness genes, which we have identified via a joint analysis of all the screens in our reference data set.
These genes are expected to be detected as significantly essential in any CRISPR screen of the HT-29 cell line performed with the experimental settings underlying the generation of our reference data set, and using the Sanger library. 17 All the technical validations presented here can be re-executed by a user on its own data through our HT29benchmark R package.
HT29benchmark R package overview
The HT29benchmarkR package allows assessing quality and reproducibility of both reference and user-provided CRISPR screens of the HT-29 cell lines using the Sanger library and the experimental settings described in Behan et al. 6 More in detail, the HT29benchmark package implements several routines, from our previously published CRISPRcleanR package 18 wrapped in novel ad hoc designed functions, providing a powerful and easy-to-use tool able to:
Download the HT-29 reference data set.
Inspect and visualize sgRNA depletion LFC distributions of each screen.
Evaluate intrascreen reproducibility of depletion LFCs at the sgRNA level, as well as at the gene level.
Evaluate interscreen similarity of depletion LFCs at the sgRNA level, as well as at the gene level.
Evaluate individual screen performances in correctly partitioning known essential (positive control) and known nonessential (negative control) genes, when considered rank-based classifiers based on gene depletion LFCs—through ROC and PrRc curves, as well as Recall at a fixed FDR.
Visualize depletion LFC distributions for positive and negative control genes (as well as for their targeting sgRNAs) and compute Glass's Δ scores quantifying the difference of their average depletion LFCs in the screen under consideration.
Derive HT-29-specific essential/nonessential genes, by analyzing all screens in the reference data set jointly and then using these sets as positive/negative controls to estimate to what extent a user-provided screen meets expectations, based on the metrics listed above.
Inspection of sgRNA LFC distributions
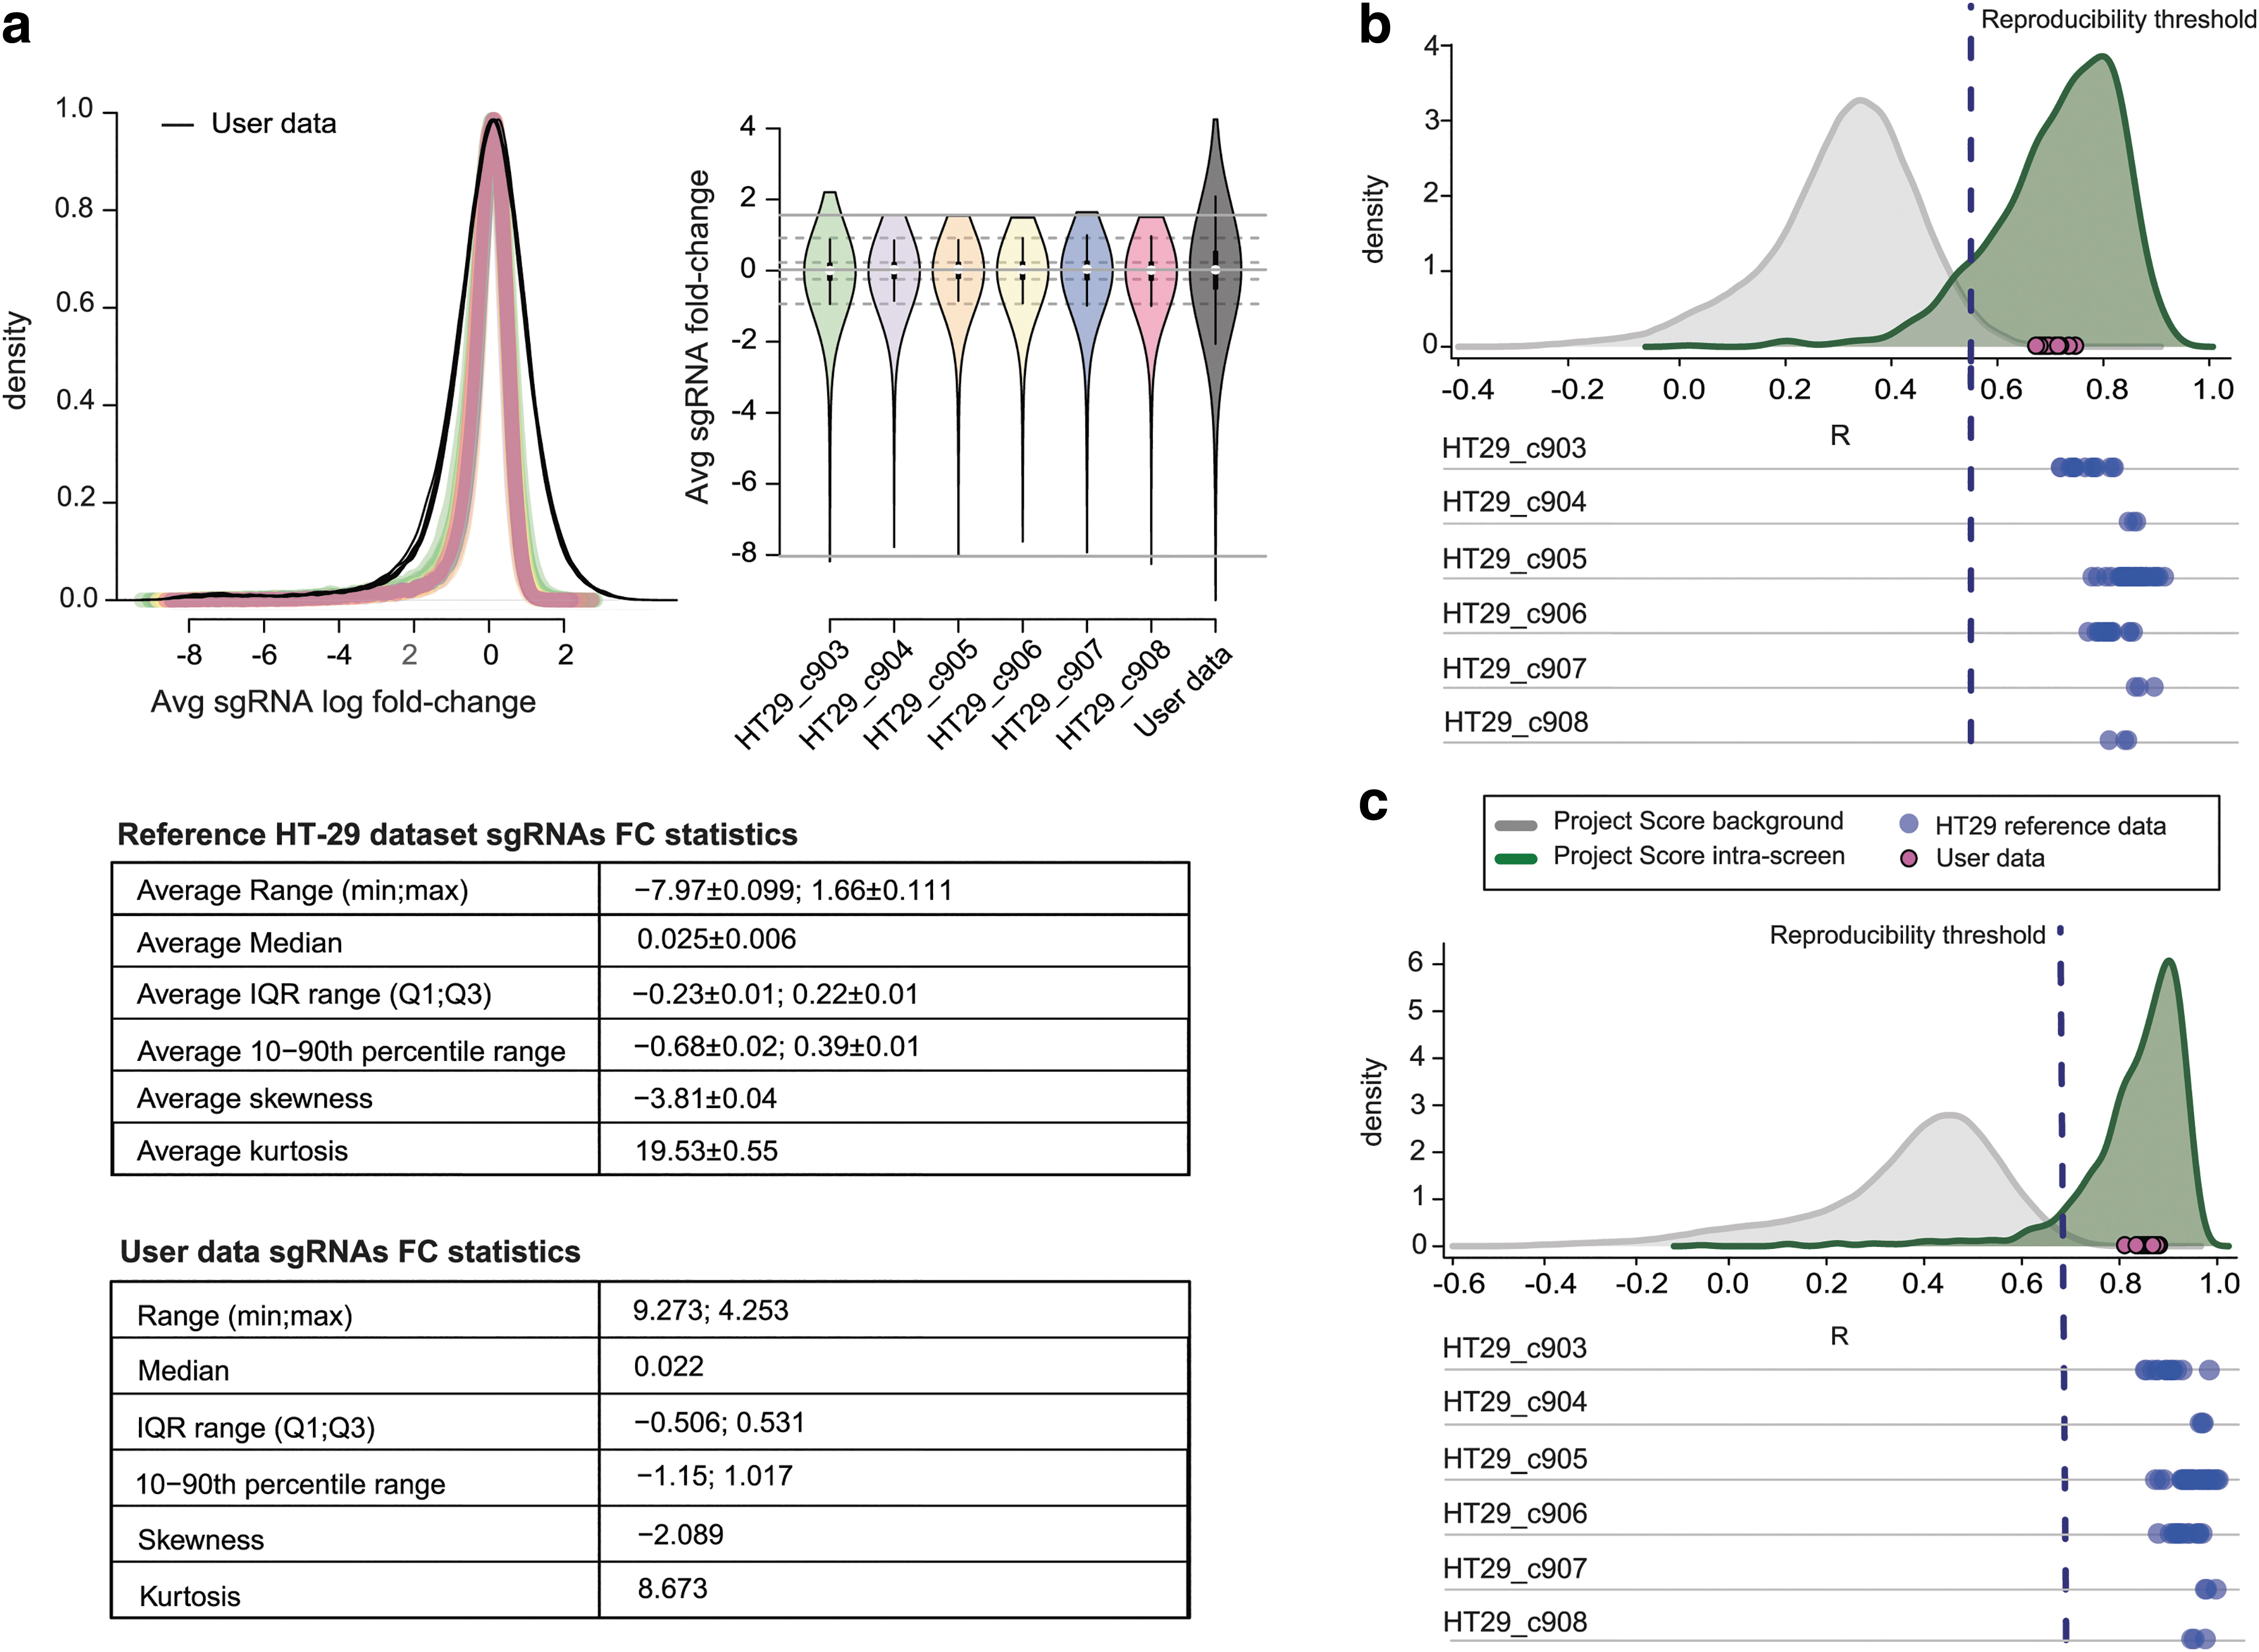
The HT29R.FCdistribution function of the HT29benchmark package allows inspecting sgRNA LFC distributions and it computes statistics such as average range, median and interquartile range, 10th–90th percentile range, skewness, and kurtosis. We have applied these metrics to the screens in our reference HT-29 data set, observing that the LFC distributions and their parameters meet the expected shape/values of a typical CRISPR-Cas9 recessive screen (Fig. 1a).22,23 This function can also take in input data from a user provided screen, allowing a comparison between reference and new data, which might unveil unexpected distribution shapes, outliers, and other data inconsistencies, thus allowing a first exploratory assessment of a new screen of the HT-29 cell line (Fig. 1a).
Intrascreen reproducibility assessment
To assess screen reproducibility across technical replicates, we defined a reliable measure of intrascreen similarity. In our previous work, we observed that comparing technical replicates of the same screen at the level of absolute post-transduction sgRNA count profiles produces meaningless outcomes, due to individual sgRNA counts varying in different ranges, which are determined by their initial amount in the library plasmid. 23 This produces a strong Yule–Simpson effect resulting in a generally high background correlation between any pair of genome-wide sgRNA count profiles. 24 As a result, when using this criterion as a reproducibility metric, pairs of technical replicates of the same screen are indistinguishable from two individual technical replicates of different screens (Supplementary Fig. S2A).
Due to only a small fraction of genes having an impact on cellular fitness upon CRISPR-Cas9 targeting, pairs of technical replicates from different screens tend to yield generally highly correlated dependency profiles even when considering sgRNA (or gene level) depletion LFCs (Supplementary Fig. S2B, C), instead of absolute counts.
For these reasons, in Behan et al., we followed an approach similar to that introduced in Ballouz and Gillis and identified a set of library-specific informative, and highly reproducible, sgRNAs pairs targeting the same gene and with an average pairwise correlation of their depletion LFC pattern >0.6 across a set of 332 cell lines from Project Score (Supplementary Table S4).6,25 This yielded a total of 838 unique informative sgRNAs. Per construction, the depletion patterns of these sgRNAs are both reproducible and informative, as they involve genes carrying an actual and sufficiently variable fitness signal.
When considering these informative sgRNAs only, correlation scores from comparing technical replicates of the same screens were significantly higher than those from comparing pairs of technical replicates from different screens (Supplementary Fig. S2D, E) of the Project Score data set. This allowed us to define a threshold value discriminating the two distributions both at the sgRNA- and gene level (R = 0.55 and R = 0.68, respectively), as defined in Behan et al. (Fig. 1b, c), and to use this value as a required minimal quality while evaluating intrascreen reproducibility. 6
The function HT29R.evaluateReps of the HT29benchmark package allows a robust assessment of input screens, producing plots such as those shown in Figure 1b and c. All technical replicate pairs in the HT-29 reference screens exceed the reproducibility threshold defined in Behan et al. (blue circles in Fig. 1b, c), while interscreen reproducibility of user-provided data is evaluated (magenta circles in Fig. 1b, c), and compared with those obtained for the reference HT-29 data set.
Interscreen similarity evaluation
As a second measure of reproducibility, we evaluated the results' comparability across different screens in our reference data set. Thus, we considered genes (or sgRNAs) passing preprocessing filters in all the six HT-29 screens, computed LFCs' profiles and averaged them across technical replicates, ending up with six different LFC profiles (one for each screen). We computed Pearson's correlation scores comparing each pair of these profiles. This analysis is performed (and results can be visualized) by the HT29R.expSimilarity function included in our HT29benchmark package, which (as before) can be used on a user-provided screen to assess its similarity, in terms of depletion LFCs, to the six HT-29 reference screens. For consistency with the reproducibility measure introduced in the previous section, this function allows considering the entire Sanger library or highly informative sgRNAs only, and to evaluate screens' similarity both at the sgRNA and gene level (Fig. 2 and Supplementary Fig. S3A–C).
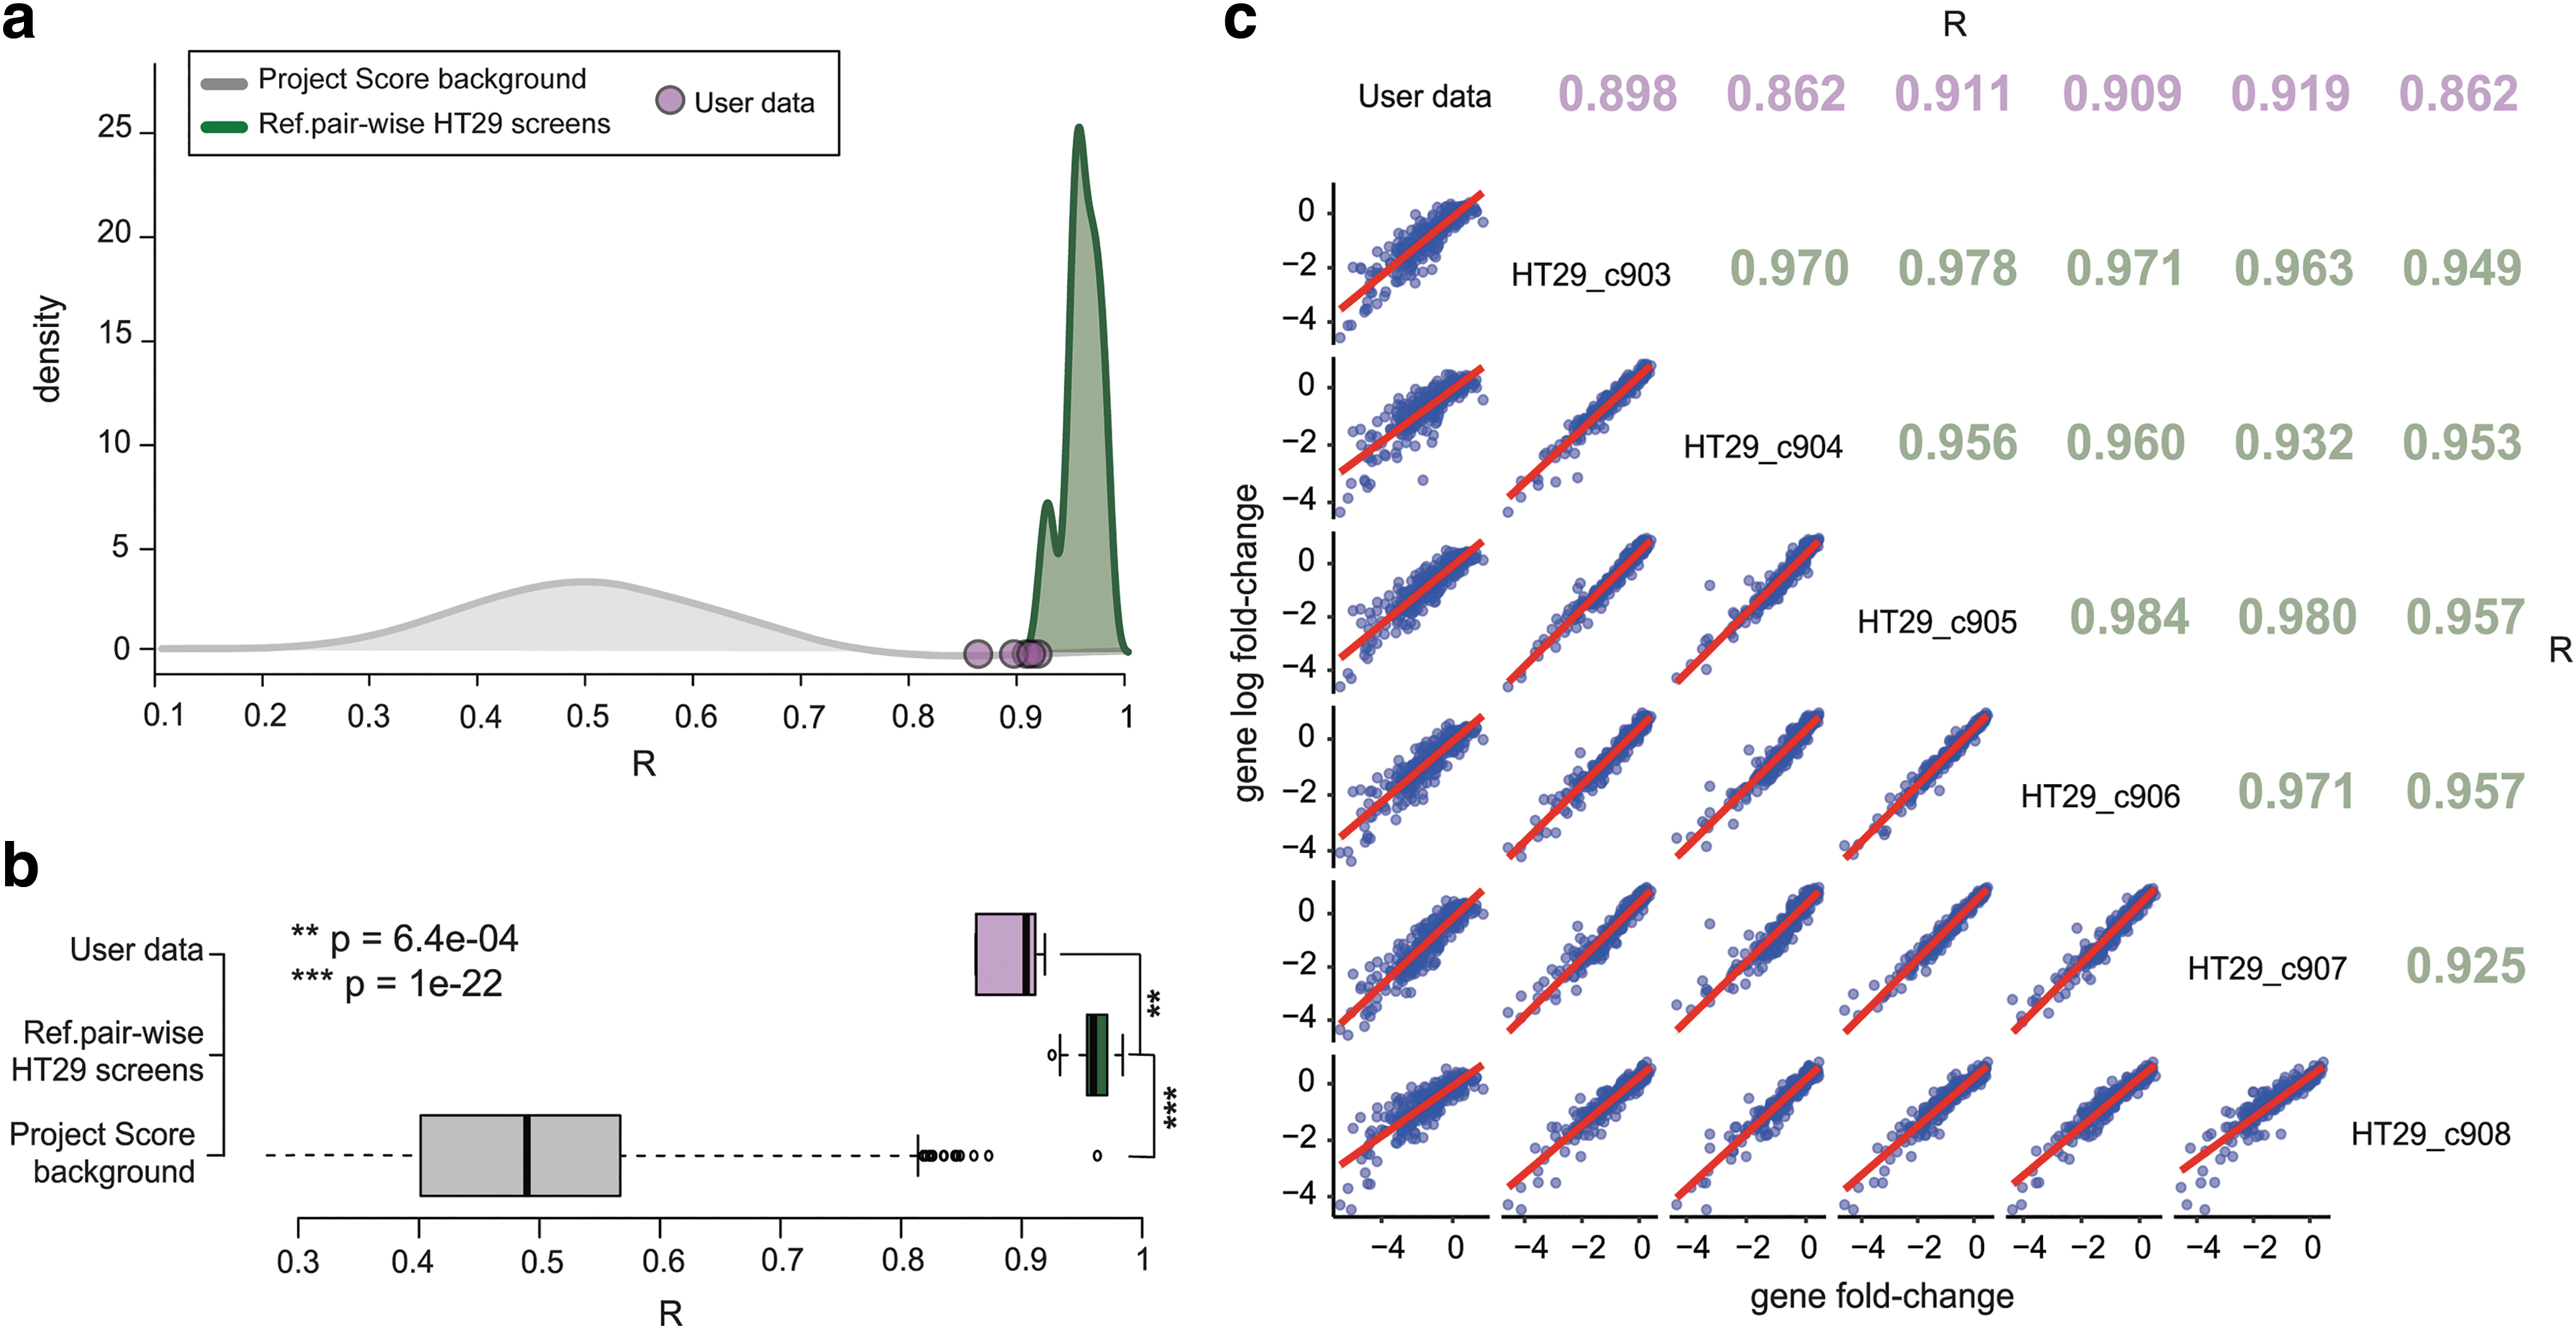
Interscreen similarity evaluation.
Screen classification performances
The ability to discriminate prior known essential and nonessential genes based on their depletion LFC observed in a CRISPR-Cas9 recessive screen is widely used to assess the quality of that screen.4,6,8,9,23,26,27
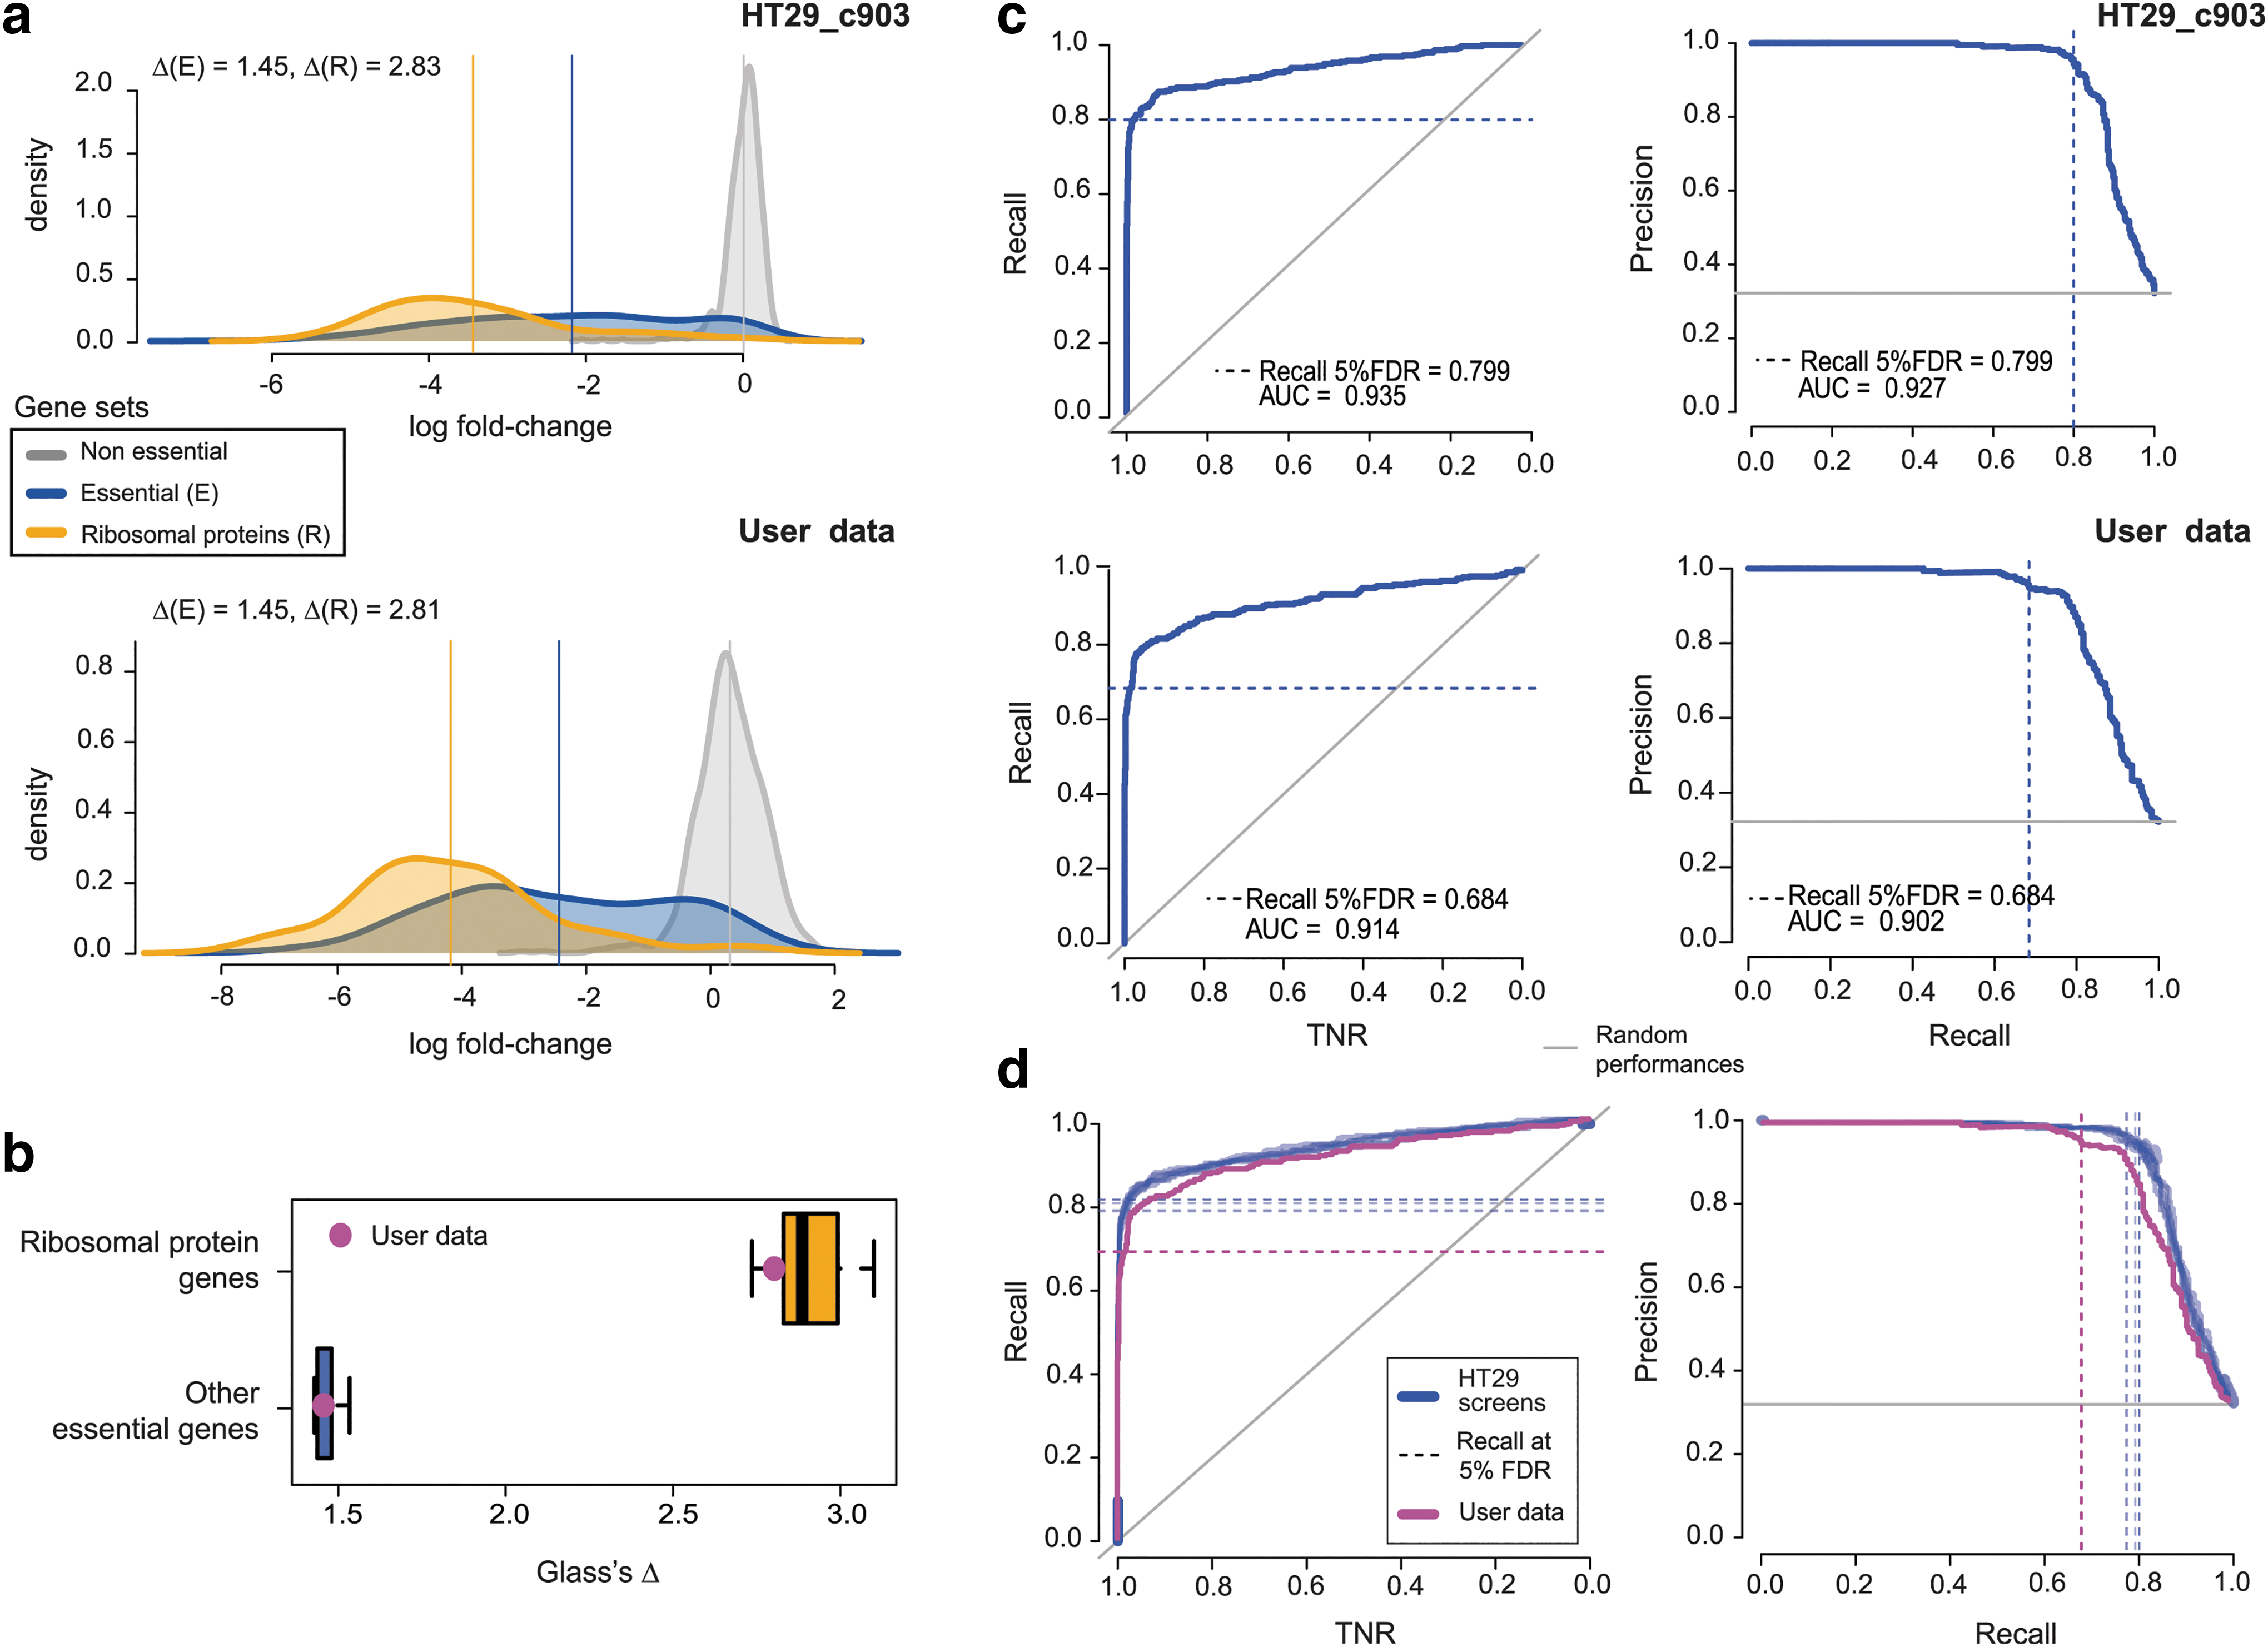
In particular, a good-quality CRISPR screen will tend to detect genes involved in fundamental cellular processes, and other core fitness genes, as highly depleted invariantly across screened cell types. Robust reference sets of core essential and nonessential genes can be used as a gold standard to evaluate screens' performances.17,28 The HT29R.PhenoIntensity function provides a measure of screen quality by leveraging the intensity of the phenotype exerted by inactivating these genes. To quantify this effect, in Behan and colleagues, we computed a Glass's Δ score, respectively, for reference essential genes (i.e., genes that reduce cellular viability/fitness upon inactivation; E) and (more stringently) for ribosomal protein genes (R).18,29
These scores account for the difference between the average depletion LFCs of the genes in E (respectively, R) and that of genes known to be nonessential (N) in relation to the standard deviation of the depletion LFCs of the genes in E (respectively, R), as follows:
where X ϵ {E, R} and μ and σ indicate mean and standard deviation, respectively. The Δs for the screens in the reference data set were consistently >2 for ribosomal protein genes and >1 for the other essential genes (with a Glass's Δ >0.8 widely considered an indicator of large effect size), thus indicative of generally good data quality (Fig. 3a and Supplementary Fig. S4). In addition, as depicted in Figure 3a and b, in this case, applying this metric to the example user-provided screen yielded values within the expected ranges.
Screens' quality in terms of phenotype intensity and ROC analysis.
In addition to the Glass's Δs, we implemented and included in our package the HT29R.ROCanalysis function computing and visualizing ROC and PrRc curves to evaluate the ability of each screen in correctly partitioning prior known essential (E) and nonessential (N) genes, when considered a rank-based classifier based on sgRNA- or gene-depletion-LFCs (as explained in the previous sections). Applying this function to the HT-29 reference data set, as well as to example user-provided data, yielded the results shown in Figure 3c and d. Also, in this case, our reference data set yielded very good-quality scores.
Finally, as a further quality assessment and reference to the user, we computed fitness effect significance thresholds using prior known essential and nonessential genes at different FDR levels, and we quantified corresponding Recall values of prior known essential genes, as well as a novel set of human core-fitness genes introduced in Behan and colleagues and various sets of other essential genes (all available in the CRISPRcleanR package) (Supplementary Fig. S5 and Supplementary Table S2).18,28 Also these results confirmed the high quality of our reference data set.
HT-29-specific fitness genes
We assembled a list of genes that are consensually significantly depleted across all our reference HT-29 screens and thus should be observed as significantly depleted in new screens of the HT-29 cell line performed with the Sanger library and the experimental setting described in Behan et al. 6 First of all, for each reference HT-29 screen, we identified a set of genes significantly depleted at a 5% FDR and its complement, that is, a set of genes not significantly depleted, using reference sets of essential (E) and nonessential (N) genes to compute significance thresholds (Methods).9,28 Intersecting all these sets of screen-specific significantly depleted, respectively, nondepleted, genes yielded a high-confidence set of HT-29-specific essential, respectively, nonessential, genes.
We assessed how each reference screen discriminated these two sets in terms of Glass's Δ or Cohen's d (Methods).30–32 This enabled us to once again establish a set of expected values for evaluating a newly performed HT-29 screen. To be consistent with the quality assessment performed by Behan et al., we considered a low-tier quality threshold, which is 3 standard deviations below the median for the reference data set (solid line Fig. 4b). 6 A second, more stringent, threshold is equal to the lower 90 percentile boundary of the values observed for our reference data set (vertical dashed line in Fig. 4b). The HT-29-specific fitness genes are also provided in Supplementary Table S3, partitioned into three tiers based on their average depletion LFCs across screens.
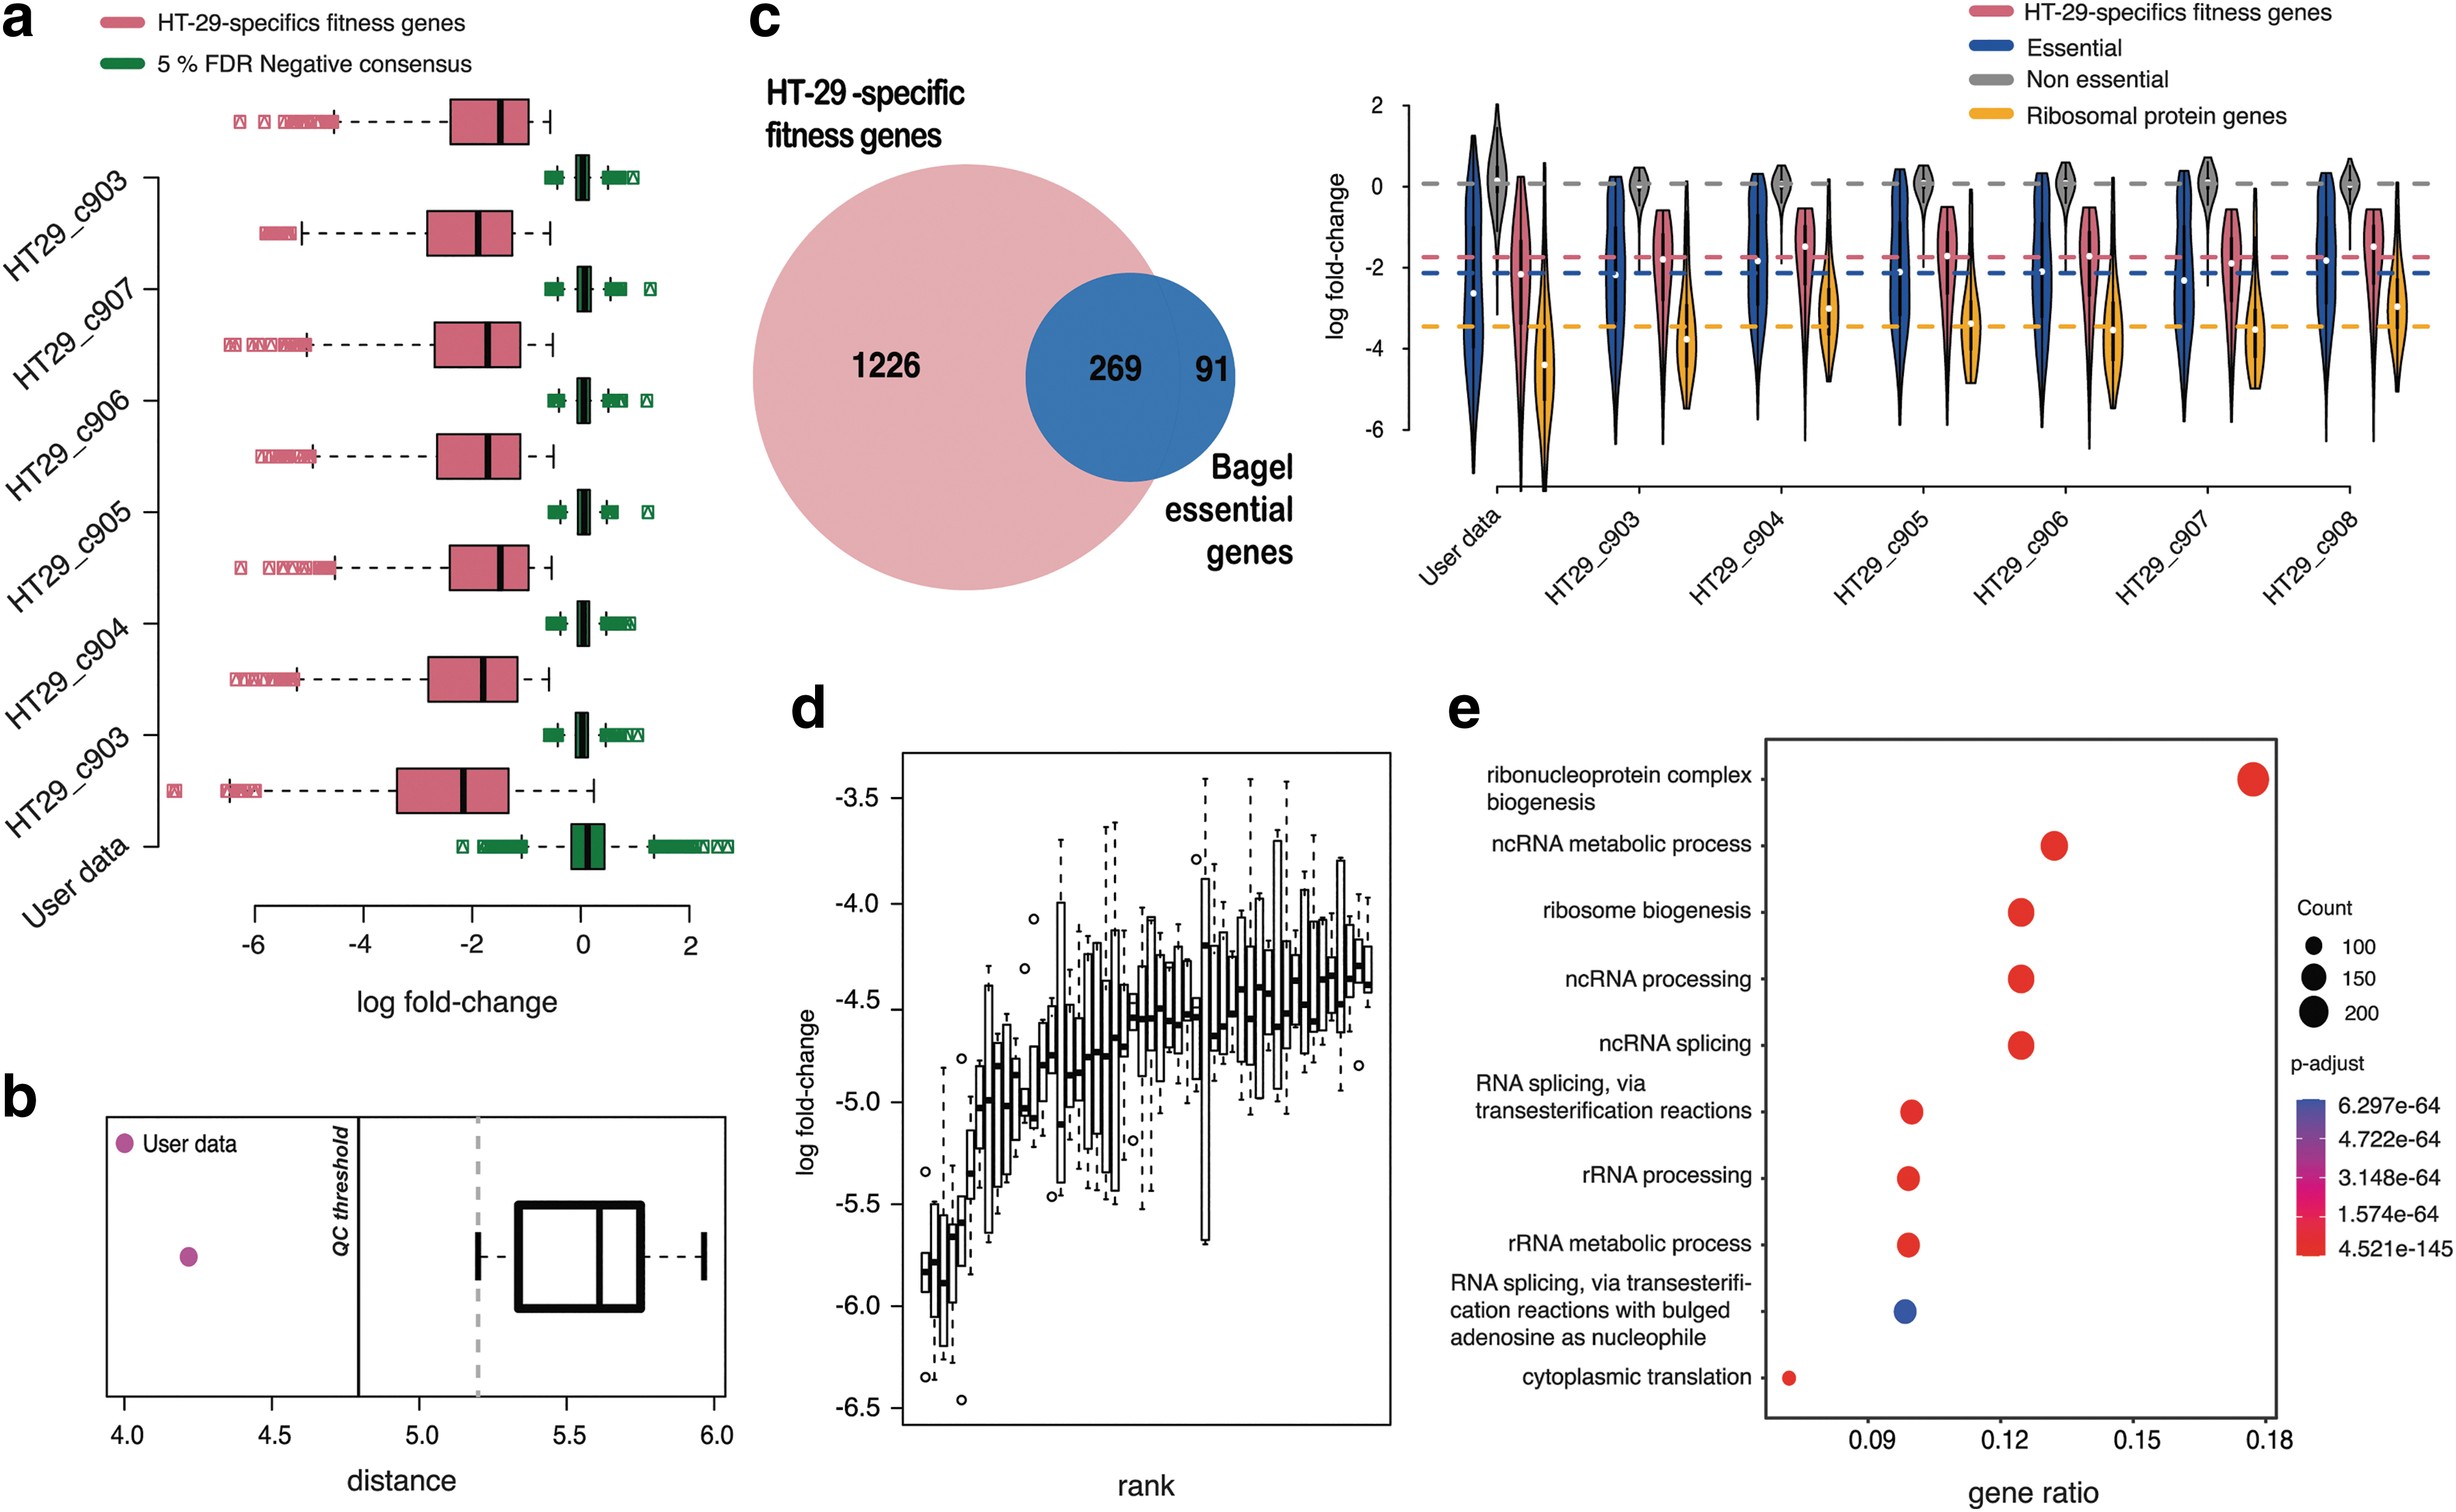
These genes showed fairly consistent depletion LFCs across screens (Fig. 4d) and were significantly enriched for previously reported human essential genes (Fisher's exact test p = 7.1 × 10−221, Fig. 4c) and for fundamental BP such as “ribosome biogenesis” and “RNA splicing” (Fig. 4e), confirming their reliability.
Discussion
CRISPR screens are becoming essential tools to investigate gene function across biological contexts. 1 Viability CRISPR screens are widely used in cancer research to identify and prioritize new therapeutic targets. Indeed, large screens have been performed to systematically identify genes essential for cancer cells' survival and proliferation. 13 As the number of laboratories implementing these techniques to address a variety of biological questions increases, so does the need for analytical methods assessing the quality of the resulting data. In this study, we present an analytical pipeline, implemented in an easy-to-use R package assessing the reliability of a newly established experimental pipeline for genome-wide CRISPR-Cas9 screens, upon the execution of a single-calibration experiment: a screen of the HT-29 cell lines with the same library and setting described in Behan et al. 6
In addition, we provide accompanying data from screening the HT-29 cell line multiple times, within Project Score (https://score.depmap.sanger.ac.uk), which we comprehensively show being suitable to serve as a high-quality reference. 14 With our benchmark, laboratories setting up CRISPR-screen experiments will be able to test their pipeline, by running a single-calibration experiment on the HT-29 cancer cell line with the settings described in Behan et al. 6 We propose an analytical framework in which common metrics are adopted to assess the user-provided screen for cross-replicate reproducibility, similarity with our reference data set, and reliability in detecting known essential and nonessential genes. In summary, we developed the HT29benchmark R package (available at https://github.com/DepMap-Analytics/HT29benchmark), demonstrated its usage, and provided a detailed description of its functionalities together with the rationale underlying the quality metric selection in an effort to provide the scientific community a user-friendly tool for assessing the quality of their CRISPR screens.
We foresee that its ease of use and its comprehensive collection of evaluation criteria will make data and software a first-choice tool for robustly evaluating newly established CRISPR-Cas9 workflows in experimental laboratories.
Code and Data Availability
The R code used for generating the reference data set, for its quality assessment, as well as to evaluate the quality of a user-provided screen, and to reproduce all the figures presented here is available at https://github.com/DepMap-Analytics/HT29benchmark The HT-29 reference data set is available at different intermediate levels of preprocessing on the Project Score website (https://score.depmap.sanger.ac.uk/downloads) at https://groups-dashboards.fht.org/iorio/, and on FigShare (https://doi.org/10.6084/m9.figshare.20480544).
Footnotes
Acknowledgments
We thank the funding agencies that provided the resources for this project: The INCIPIT PhD program cofunded by Horizon 2020-COFUND Marie Sklodowska-Curie Actions, the European Molecular Biology Organization funding a short-term fellowship, OpenTargets, and the Wellcome Trust.
Authors' Contributions
R.M.I., M.J.G., and F.I. conceived the study; R.M.I., I.M., and C.P. designed and performed the benchmark analyses; R.M.I., A.S., I.M., C.P., and F.I. wrote and revised the article; F.M.B. performed experiments underlying the HT-29 reference data set under the supervision of M.J.G.; R.M.I., I.M., and A.S. interpreted results and assembled figures; R.M.I. and F.I. developed the R package; M.R.G. and M.J.G. contributed to study supervision; A.S. and F.I. supervised the study. All the authors read and revised the article.
Author Disclosure Statement
M.J.G. has received research grants from AstraZeneca, GlaxoSmithKline, and Astex Pharmaceuticals, and is the founder of Mosaic Therapeutic. F.I. has received funding from Open Targets, a public–private initiative involving academia and industry and from Nerviano Medical Sciences Srl, and he performs consultancy for the joint Cancer Research Horizons - AstraZeneca Functional Genomics Centre and for Mosaic Therapeutics. All other authors have no competing financial interests.
Funding Information
This work was supported by OpenTargets (OTAR-015 and OTAR2-055); Wellcome Trust (Grant 206194); the INCIPIT PhD program cofunded by Horizon 2020-COFUND Marie Sklodowska-Curie Actions; and the European Molecular Biology Organization (8536). For the purpose of open access, the authors have applied a CC BY public copyright license to any author-accepted article version arising from this submission.
References
Supplementary Material
Please find the following supplemental material available below.
For Open Access articles published under a Creative Commons License, all supplemental material carries the same license as the article it is associated with.
For non-Open Access articles published, all supplemental material carries a non-exclusive license, and permission requests for re-use of supplemental material or any part of supplemental material shall be sent directly to the copyright owner as specified in the copyright notice associated with the article.