
Abstract
While the world recovers from the COVID-19 pandemic, another outbreak of contagious disease remains the most likely future risk to public safety. Now is therefore the time to equip health authorities with effective tools to ensure they are operationally prepared for future events. We propose a direct approach to obtain reliable nearly instantaneous time-varying reproduction numbers for contagious diseases, using only the number of infected individuals as input and utilising the dynamics of the susceptible–infected–recovered (SIR) model. Our approach is based on a multivariate nonlinear regression model simultaneously assessing parameters describing the transmission and recovery rate as a function of the SIR model. Shortly after start of a pandemic, our approach enables estimation of daily reproduction numbers. It avoids numerous sources of additional variation and provides a generic tool for monitoring the instantaneous reproduction numbers. We use Norwegian COVID-19 data as case study and demonstrate that our results are well aligned with changes in the number of infected individuals and the change points following policy interventions. Our estimated reproduction numbers are notably less volatile, provide more credible short-time predictions for the number of infected individuals, and are thus clearly favorable compared with the results obtained by two other popular approaches used for monitoring a pandemic. The proposed approach contributes to increased preparedness to future pandemics of contagious diseases, as it can be used as a simple yet powerful tool to monitor the pandemics, provide short-term predictions, and thus support decision making regarding timely and targeted control measures.
INTRODUCTION
When the COVID-19 pandemic hit the world in early 2020, governments were forced to take immediate, wide-ranging actions to “flatten the curve.” The reproduction number was the key parameter for monitoring the virus spread and became an indicator for policy measures taken by authorities. As most models for its assessment were developed and refined using existing datasets from earlier pandemics, and the knowledge about the new SARS-CoV-2 virus was deficient (Muralidar et al., 2020), a more dynamic way of thinking was needed. Predictions early in the pandemic were based on scarce information sources, which were unavoidably noisy and often incomplete. Consequently, models relying on multiple sources with considerable uncertainty, both in data and in model specification, escalate the overall uncertainty considerably (Elderd et al., 2006).
In this article, we propose a methodology to estimate a nearly instantaneous time-varying reproduction numbers for contagious diseases, requiring only the number of infected individuals as input. Our approach is based on extracting the parameters in the susceptible–infected–recovered (SIR) dynamics (Hethcote, 2000) by optimal tracking of observed infectious cases through estimation of a multivariate nonlinear regression model. The SIR model includes two parameters, transmission, and recovery, controlling the transitions between different states over time. A combination of these parameters results in a basic reproduction number (ℜ0), which is the average number of secondary infections caused by a primary case in a fully susceptible population (Rothman and Greenland, 1998).
The classical SIR-type model is heavily based on the number of confirmed positive polymerase chain reaction (PCR) test results (Rahbari et al., 2021). However, the extensions of SIR often include unavailable or scarce data, such as the number of exposed (Girardi and Gaetan, 2023) or quarantined individuals (Mehra et al., 2020), number of hospitalized patients (Storvik et al., 2023) because of viral infection, and imported cases and mobility patterns (Storvik et al., 2023; Engebretsen et al., 2023). Is it actually necessary to feed the model by multiple, often unreliable, sources of data in order to be able to provide a sound tool to decision makers? Without reliable input variables, the uncertainty in the output may escalate quickly. Potential new waves of unexpected viruses, or new strains of the SARS-CoV-2, would demand new measures to maintain public safety as highlighted by the Norwegian and other governments (Government, 2022). Also, the COVID-19 task force of Royal Statistical Society in one of their 10 Covid “lessons learned” urges governments to “build an effective infectious disease surveillance system to monitor the spread of disease” in future pandemics (Royal Statistical Society, 2022).
In this article, we claim and show that it is possible to obtain reliable reproduction numbers by a direct approach, using only the confirmed number of positive PCR tests. By estimating a multivariate nonlinear regression model for a given set of infected cases, we provide a framework enabling an easy estimation of nearly instantaneous time-varying reproduction numbers. In this way, our approach fills a gap in a large body of literature using numerous methods to estimate the SIR model parameters, and thus reproduction numbers, including Bayesian methods (Verity et al., 2020), Monte Carlo approaches (Cano et al., 2020), machine learning (Raissi et al., 2019; Alanazi et al., 2020), and likelihood-based methods (White and Pagano, 2008). Our proposed approach solves a mathematical inverse problem, also considered by Taghizadeh and Mohammad-Djafari (2022) and Marinov and Marinova (2022). Taghizadeh and Mohammad-Djafari (2022) solve a classical nonlinear least-squares problem, providing fixed SEIR [SIR with “exposed” (E) state] model parameters, and further model time dependency in transmission parameter through a periodic function. The periodicity is, however, not necessarily present in an outbreak of contagious disease, as, for example, COVID-19 showed to be. Marinov and Marinova (2022) consider transmission and recovery parameters in the SIR model as piece-wise functions of time, thus resulting in constant reproduction numbers over specific periods of time. We argue that the reproduction numbers updated daily are of crucial importance in the evolving pandemic—particularly in the exponential growth phases, where the waiting to introduce measures to flatten the curve or urge the hospitals to increase the preparedness might be very costly—and advance these shortcomings.
Our approach is generic and could be applied on any data stemming from contagious diseases following on the SIR dynamics. We use Norwegian COVID-19 data as a case study and benchmark our results to the numbers produced by R package EpiEstim (Cori et al., 2013) and by Storvik et al. (2023). The approach presented in the study of Storvik et al. (2023) was extensively used by the Norwegian health authorities to guide decisions regarding the measures taken, thus acting as a gold standard for our study. Fraser (2007) suggested a method for estimating the reproduction numbers combining a time-since-infection model with underlying number of infections, implemented as a ready-to-use tool in the R package EpiEstim by Cori et al. (2013). This approach is recommended in the literature (Gostic et al., 2020) and was used in other European countries (Lithuanian Presidential Office, 2022) to monitor and control the COVID-19 pandemic. Through sensitivity analyses, we demonstrate that our method gives results that are well aligned with changes in the number of infected individuals and change points following policy interventions. Our estimated reproduction numbers are less variable and clearly favorable compared with the results obtained by these two popular approaches.
METHODS
Our proposed nonlinear regression approach is based on the SIR model, a compartmental mathematical model of contagious diseases. In the SIR model, the virus- or bacteria-exposed population is fractioned into states
The components
The parameter
Usually, when applying SIR-type models to monitor a pandemic, the components
Here (β, γ)
T
is a two-dimensional column vector of dependent variables, with
The function
Example of inverse problem
In the beginning of a pandemic the number of susceptible,
This example demonstrates that even in a situation of the simplified SIR model,
The steps in computing
Here, based on the initial values
Wrapping up, we use ideas from inverse problems to apply a numerical approach in defining a nonlinear function
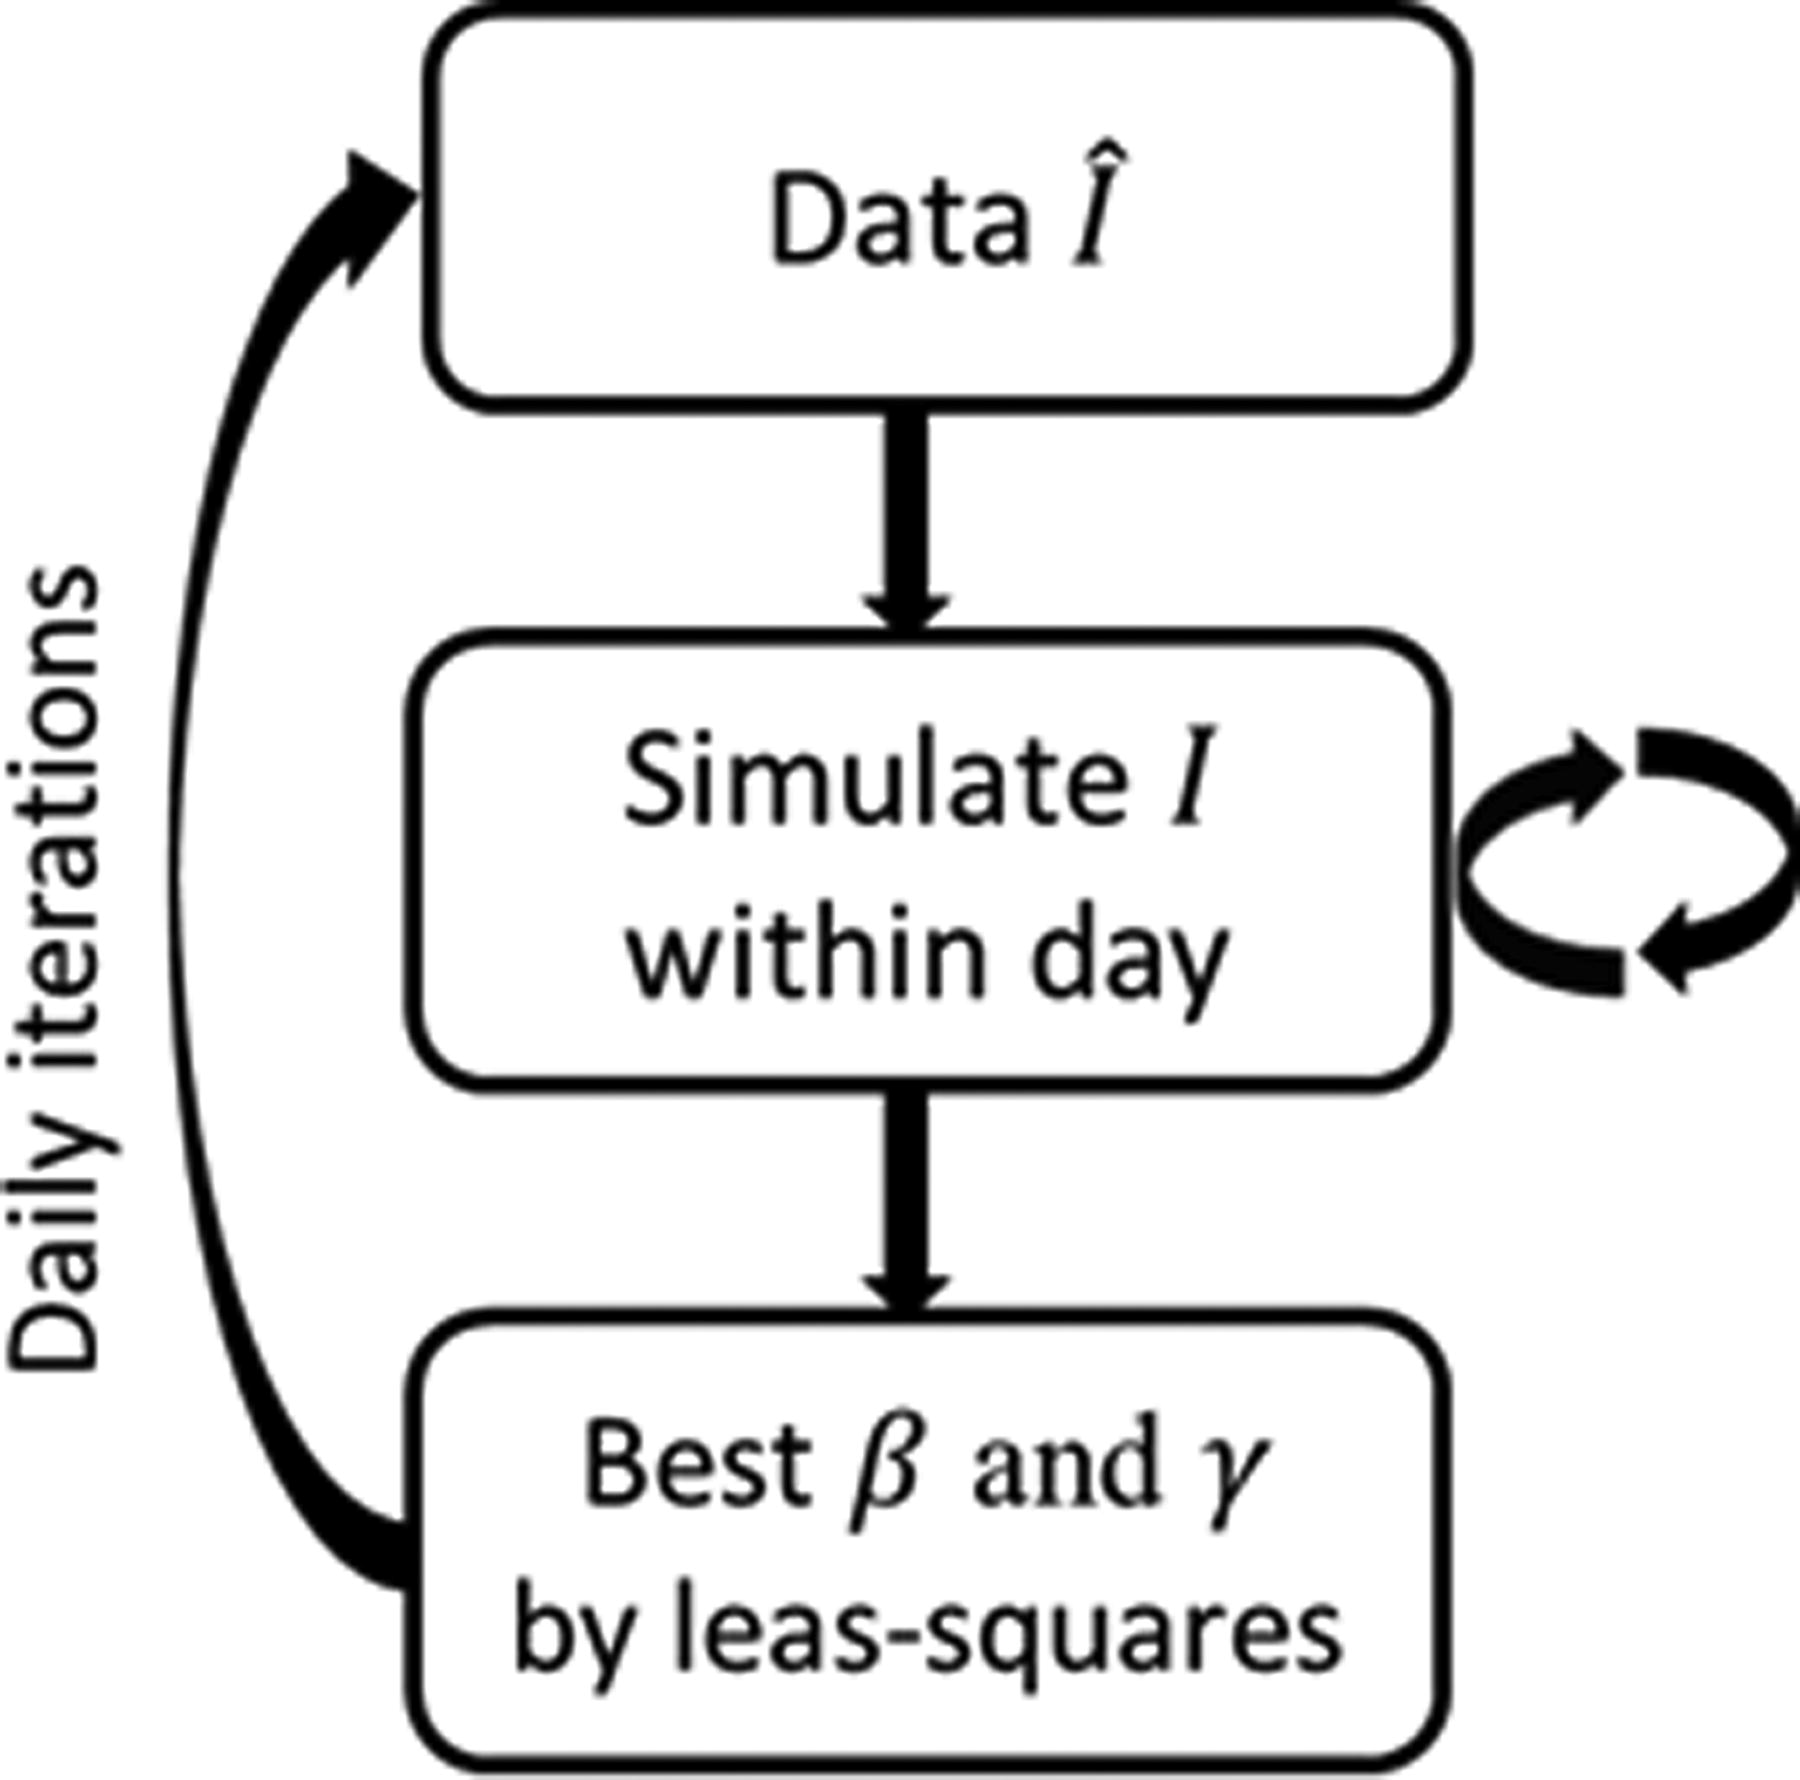
Process flowchart illustrating the numerical algorithm.
Numerical Algorithm
SIR, susceptible–infected–recovered.
Marinov and Marinova (2022) solve a similar inverse problem. We, however, approach it differently. Noisy and uncertain data might cause highly volatile solutions. We handle it through the k-day moving average of number of infected individuals, instead of minimizing over subperiods of fixed length of several days resulting in piece-wise constant estimated transmission and recovery parameters. A moving average makes trends in data more apparent, and it is the trend, and not a day-to-day variation, which is of prime interest under the pandemic. Furthermore, we estimate the two parameters (
Data
We apply our proposed approach on Norwegian COVID-19 data retrieved from the Github-repository (2020), an open source that contains daily measurements of key variables for the COVID-19 pandemic, on national level. The daily number of registered infected cases as confirmed by PCR tests is the main input variable, that is, state
The susceptible state (
Sensitivity analyses
Several steps were taken to assess the credibility of the estimated reproduction numbers.
Step 1—Structural changes. To assess how well the estimated reproduction numbers correspond to changes in number of reported infected individuals, an analysis of structural changes (Bai and Perron, 1998) in the number of infected cases as well as estimated reproduction numbers was performed.
Step 2—Benchmarking. As our proposed approach requires only the observed data for the
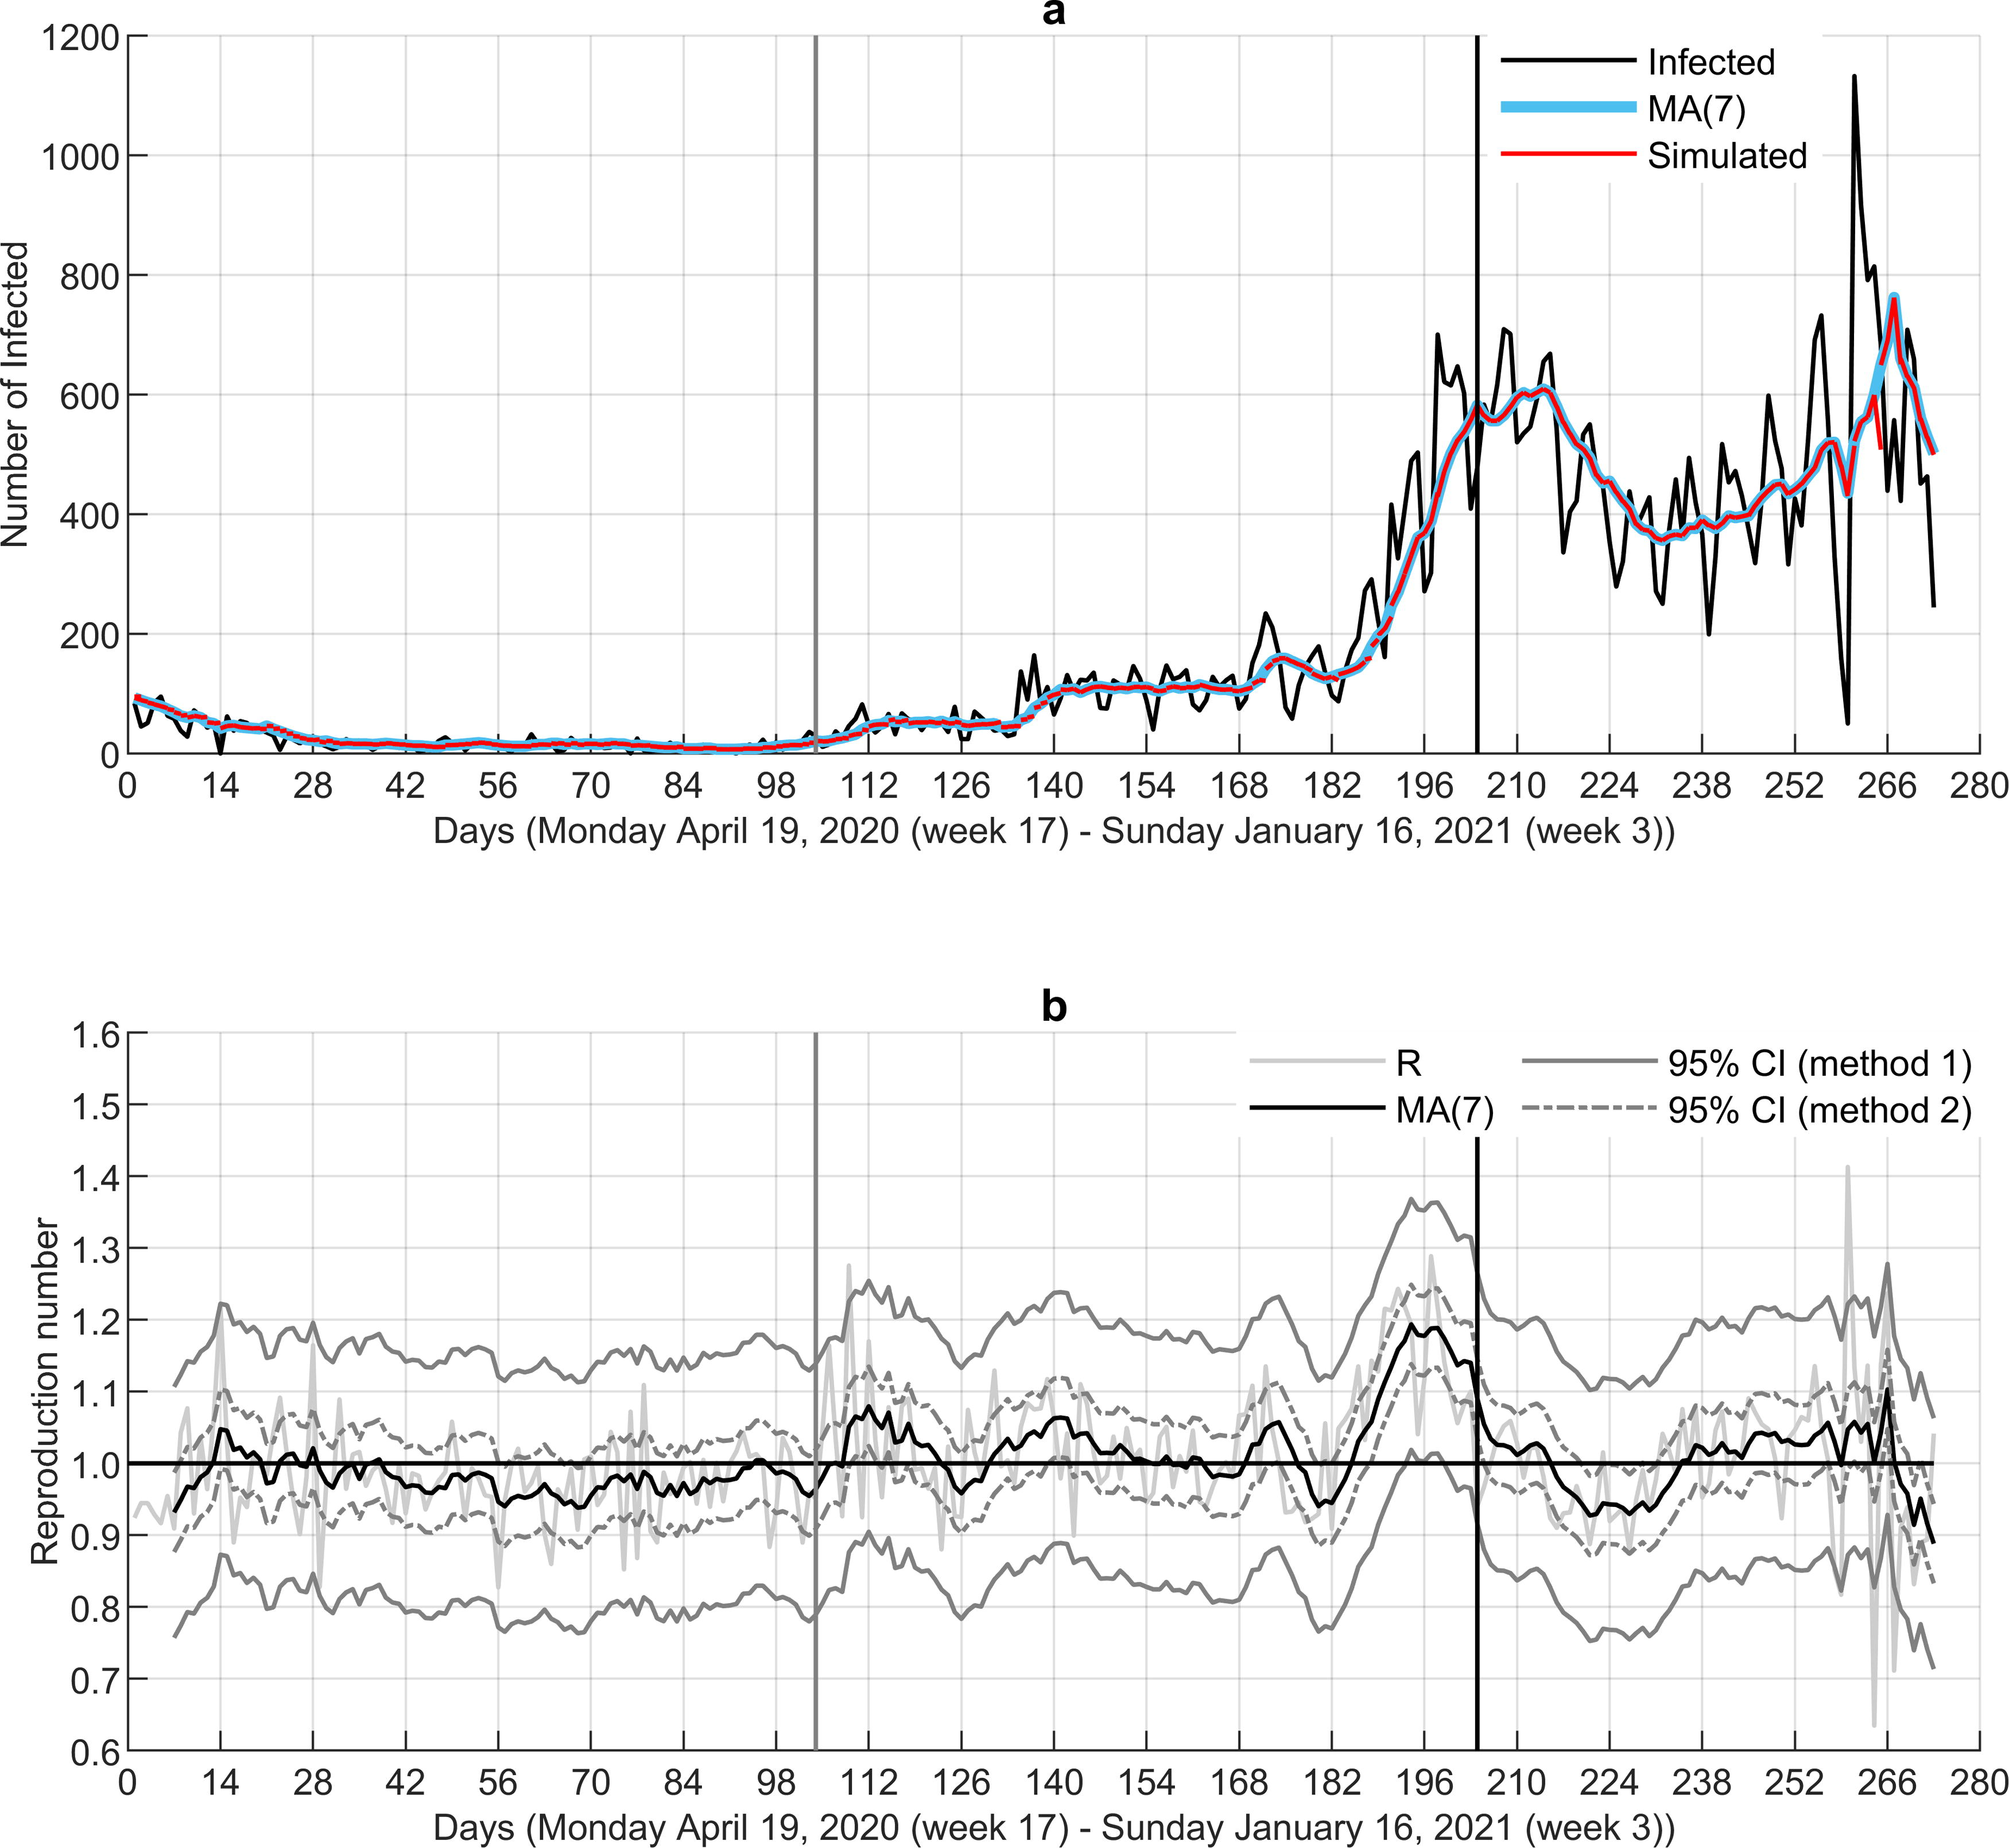
Step 3—Different wave. We apply our approach to the data from the first wave of the pandemic, covering the time window April 19, 2020, to January 16, 2021. This period is characterized by large variations because of the lack of well-established testing regimes and multiple virus mutations.
Step 4—Short-time prediction. We derive 1-, 3-, and 5-day predictions for number of infected individuals based on reproduction numbers calculated by all three approaches. Based on the definition of the reproductive number, not the SIR dynamics, the predictions were calculated as
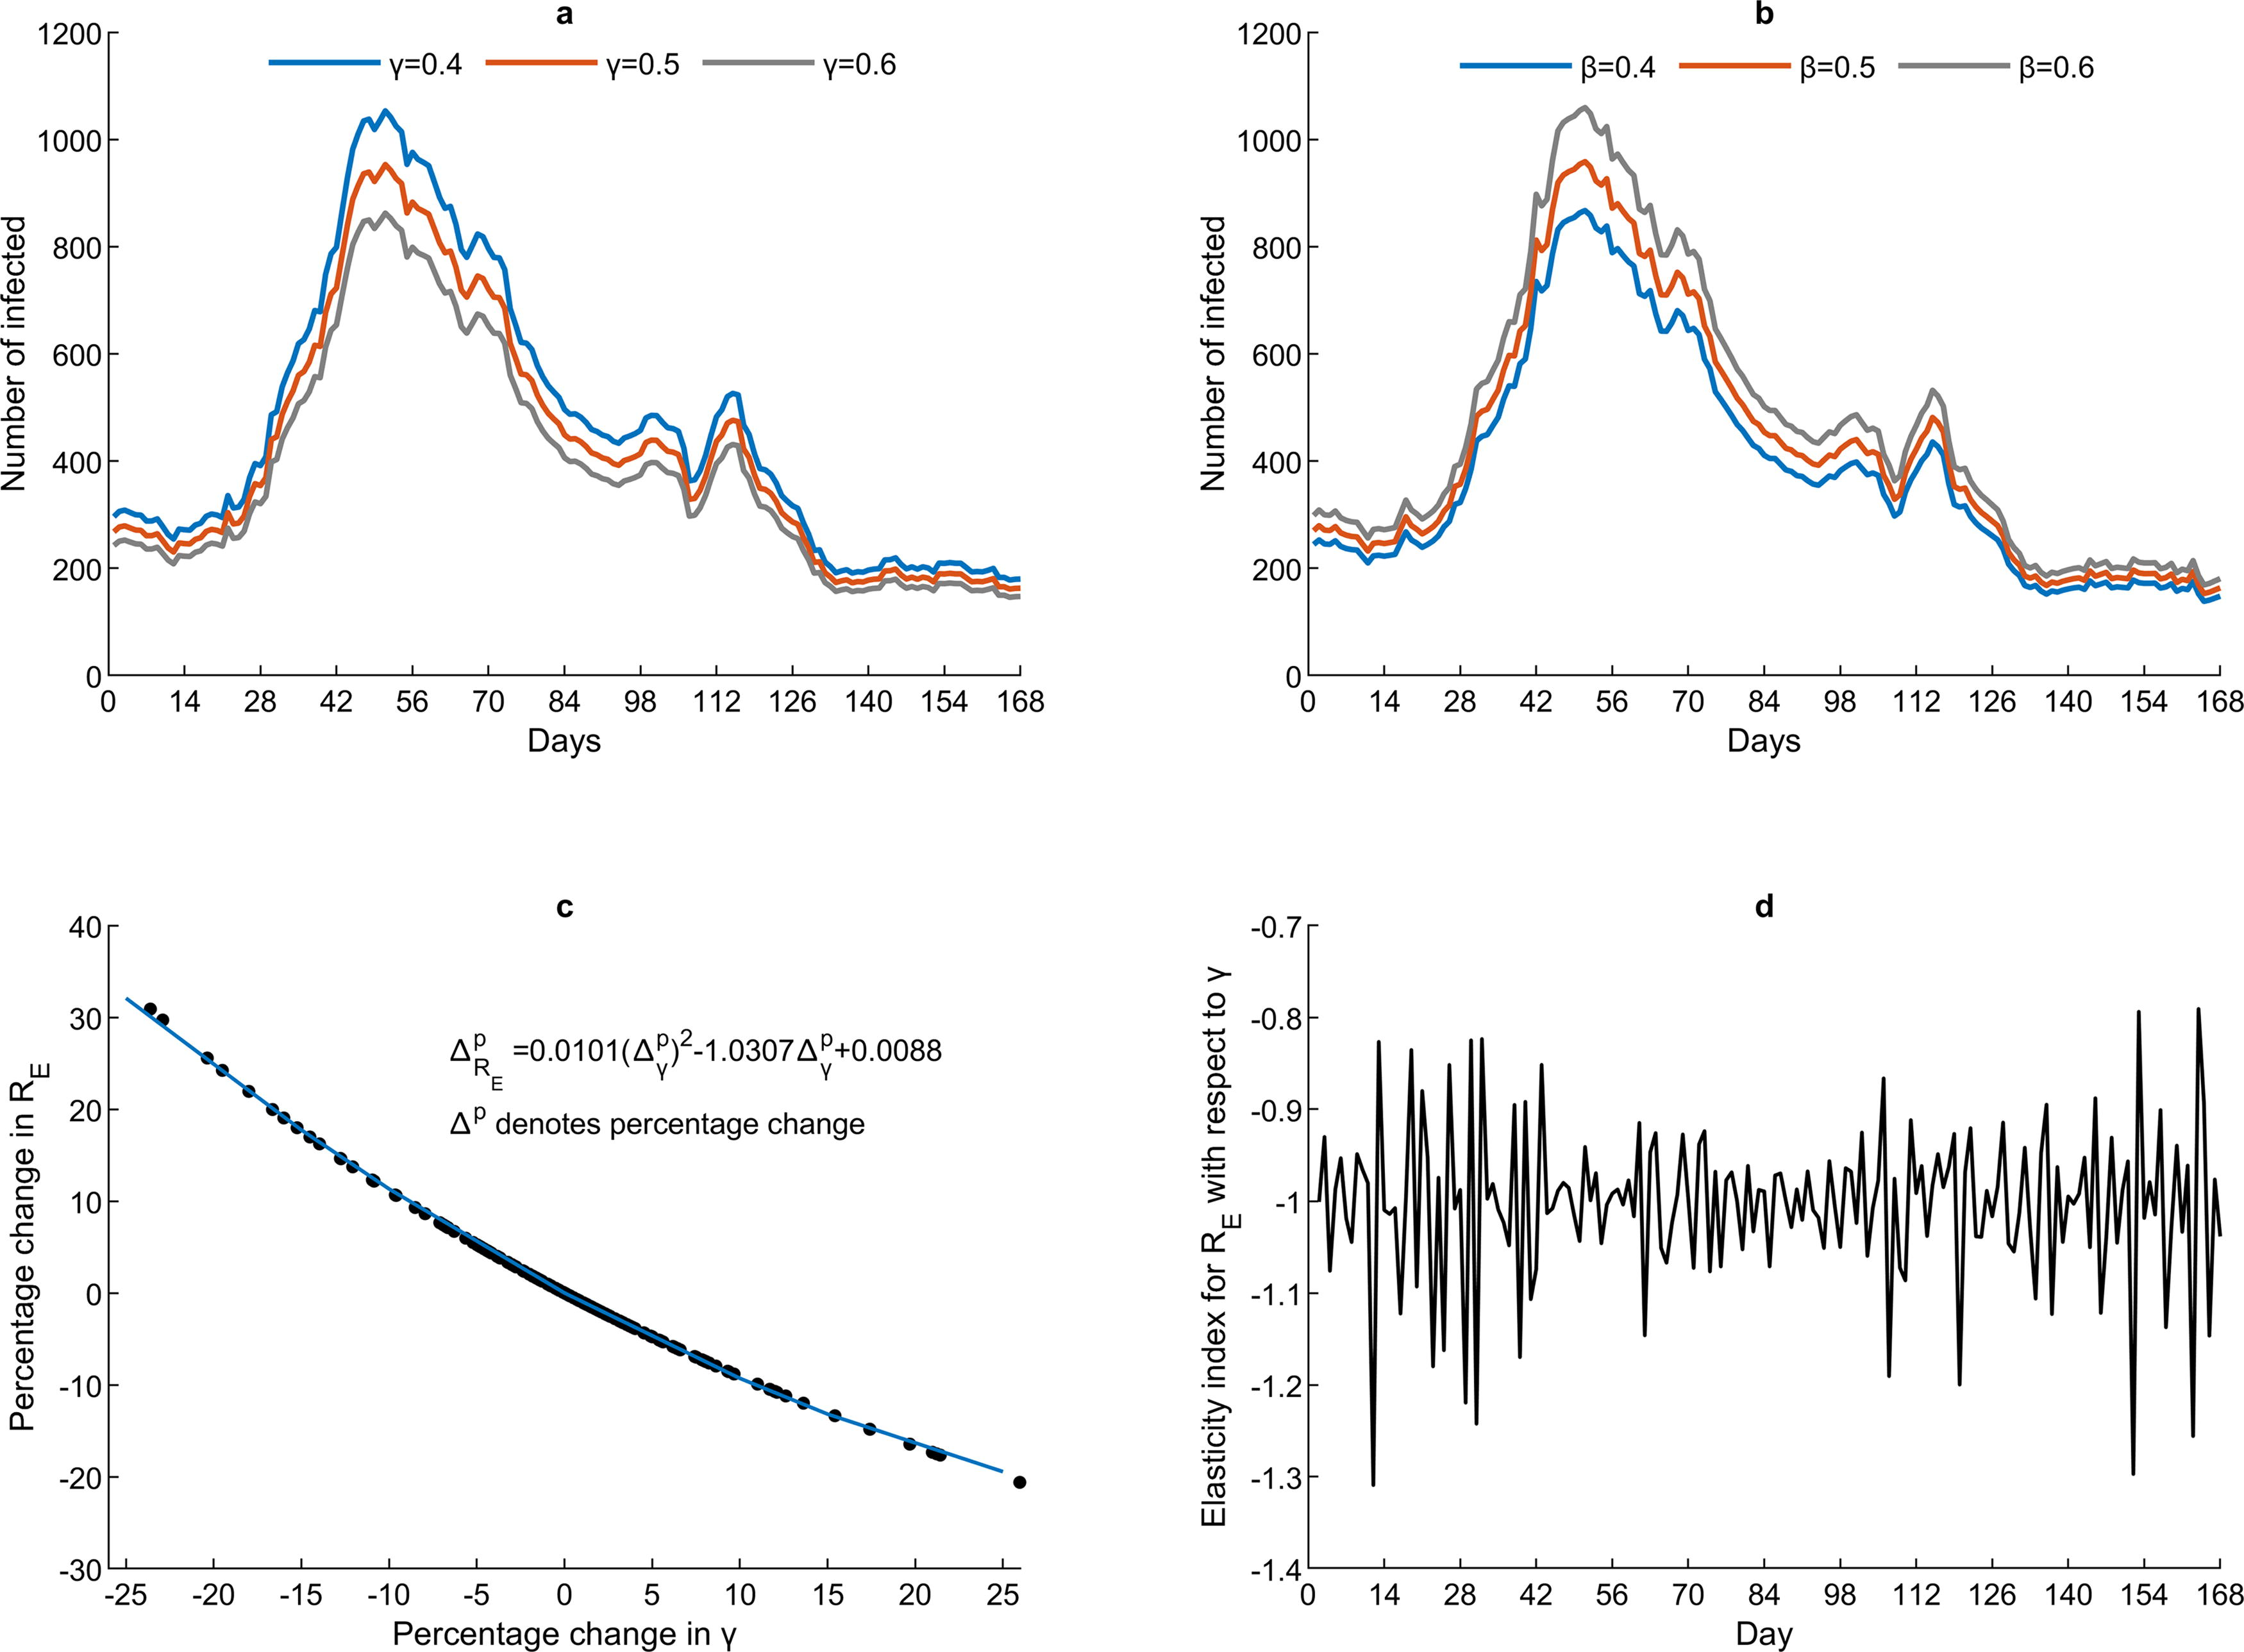
Step 5—Sensitivity and elasticity indexes. We calculate the sensitivity index (SI) for
The analysis was performed in Matlab R2022b (for extraction of SIR model parameters), R v4.4.1 (EpiEstim package v2.2–4 for calculating the reproduction numbers for comparative purposes), and STATA v17 (xtbreak package for structural change analysis). Figures were generated in Matlab R2022b.
RESULTS
Daily reproduction numbers—empirical analysis
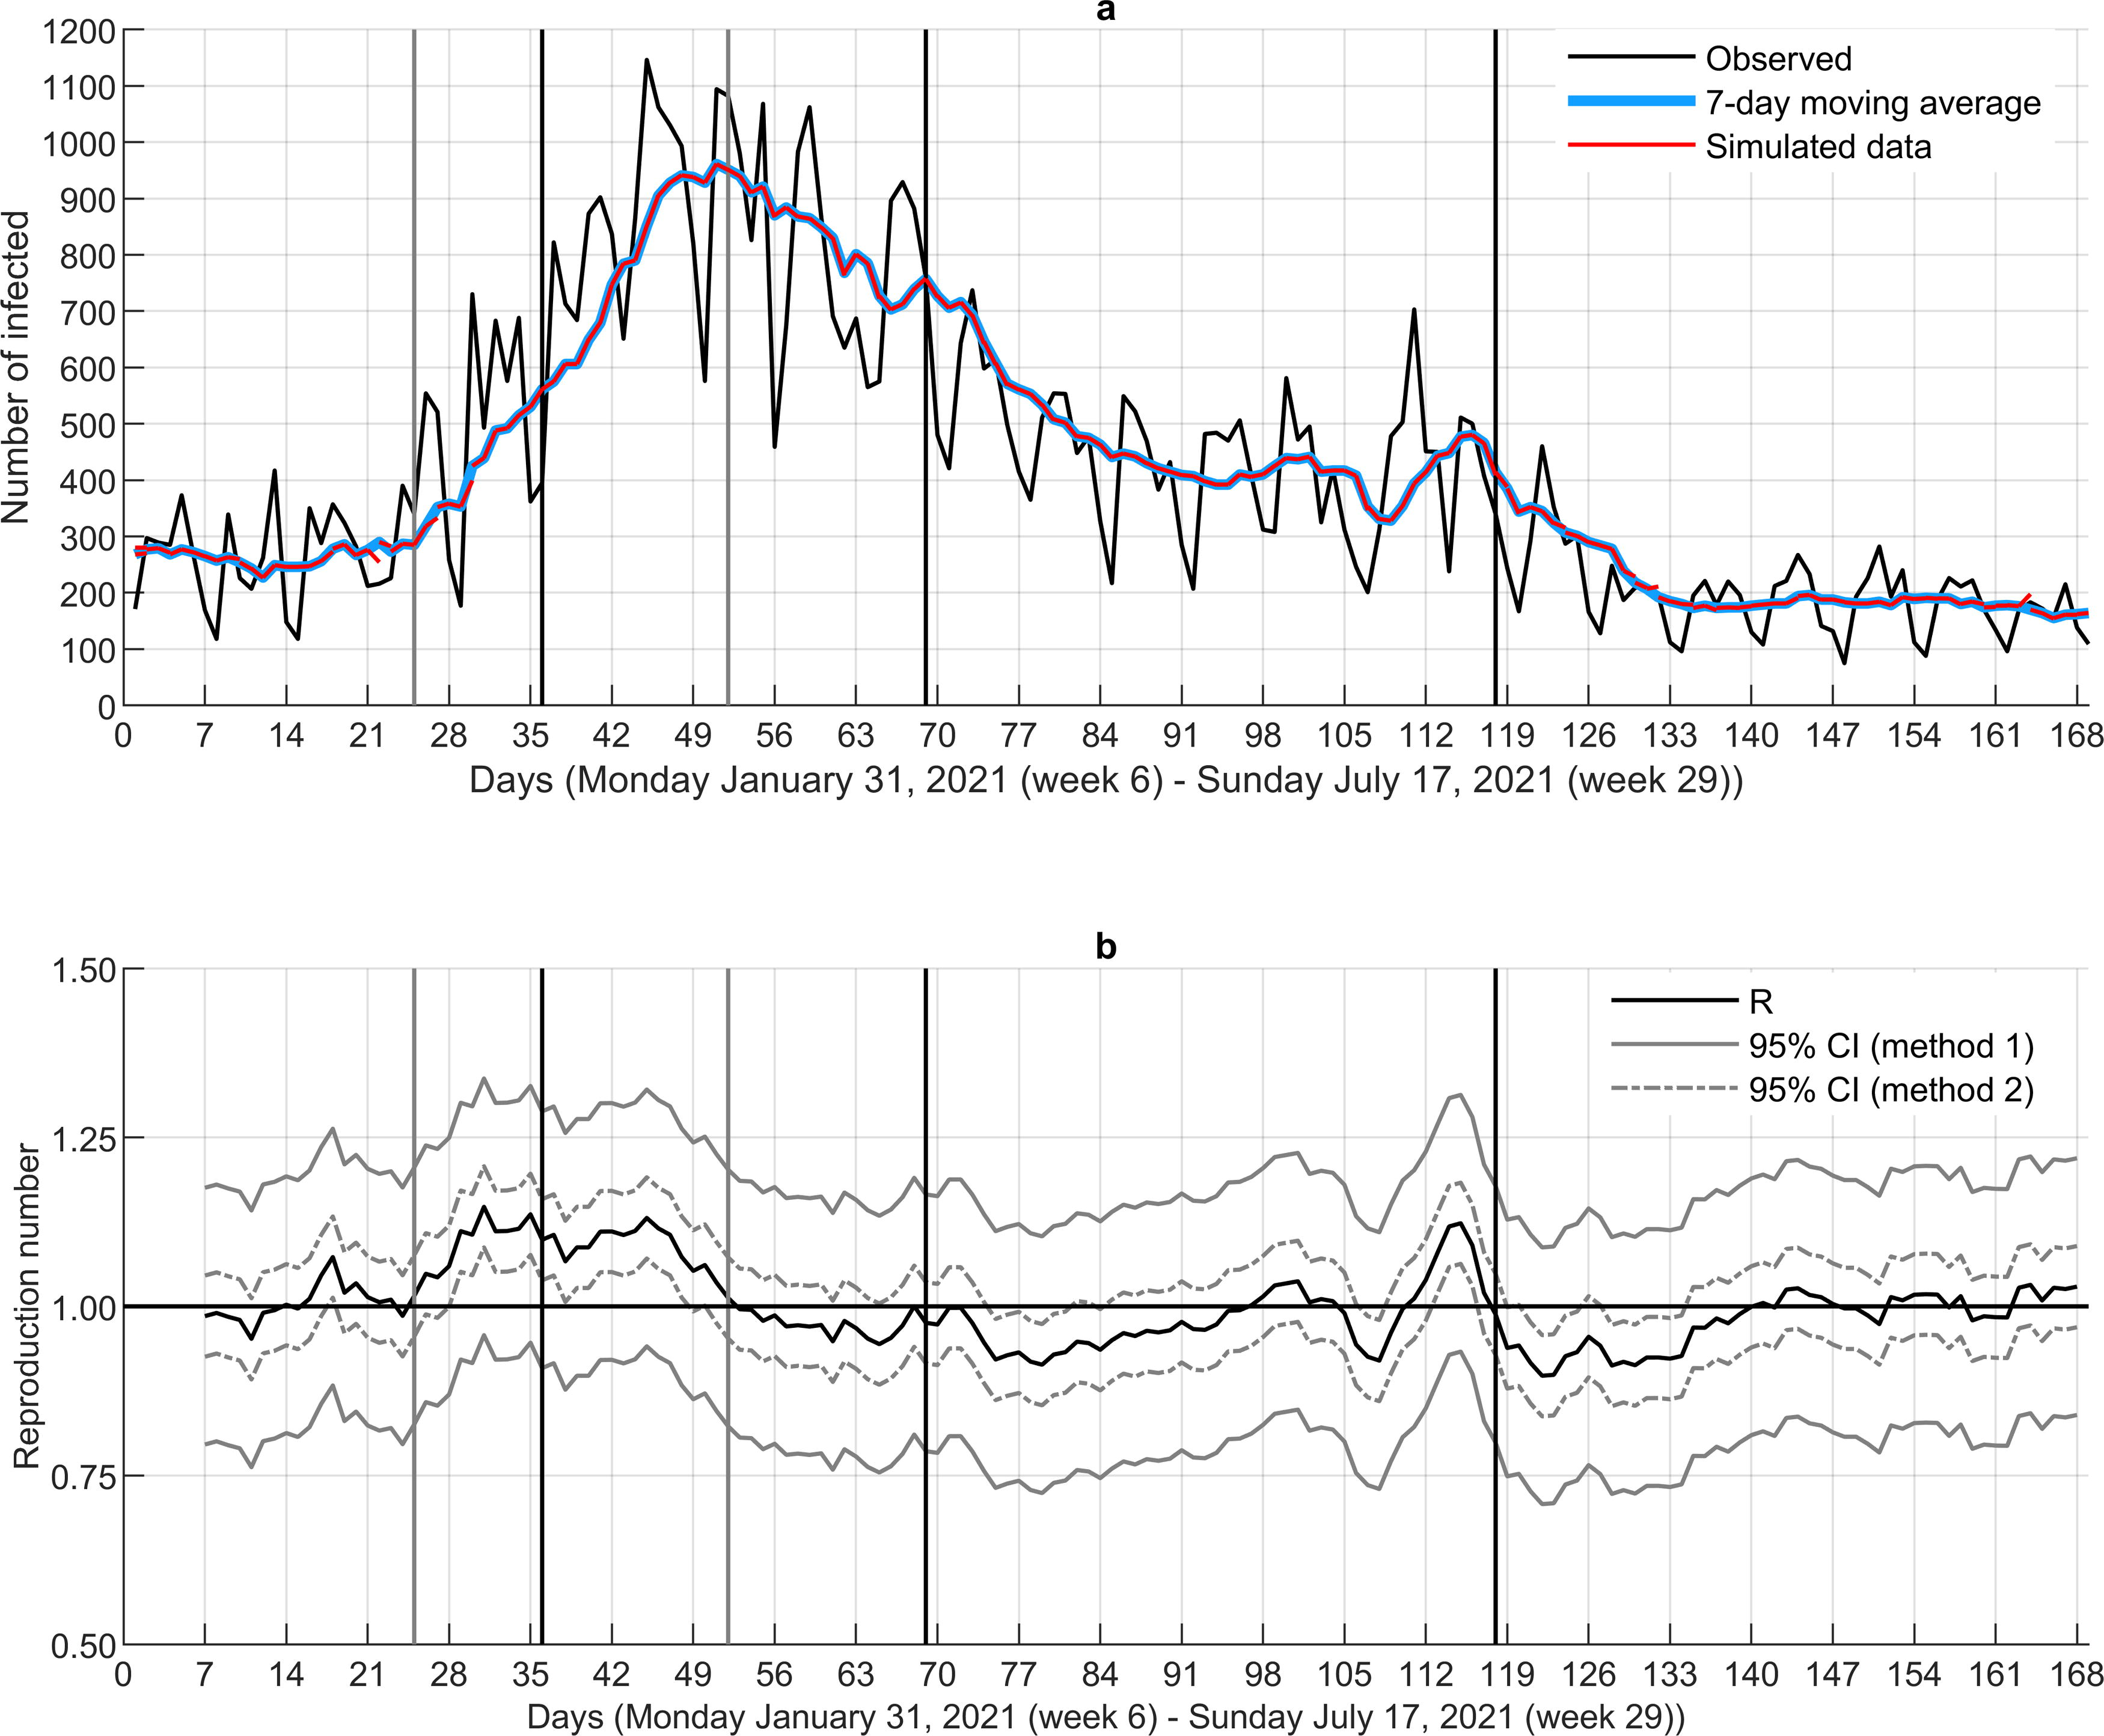
The SARS-CoV-2 testing activity showed clear weekend effects, with markedly fewer tests registered on Sundays and Mondays. This weekend effect was also confirmed by the empirical autocorrelation function, revealing a 7-day pattern (not shown). We therefore use a 7-day moving average of
In our minimization algorithm, where we extract the parameters for the reproduction number ℜE, we choose starting values for both
The estimated parameters
Sensitivity analysis
Step 1—Structural changes. According to the analysis of structural changes, three breakpoints were identified in the time series for the number of infected (black vertical lines in Fig. 2a) and two for the daily ℜE series (gray vertical lines in Fig. 2b). The first and second breakpoint in number of infected clearly show increasing and declining numbers, correspondingly, whereas the third point indicates flattening. The first breakpoint in the daily ℜE series occurs at the time were ℜE becomes larger than 1, whereas the second one corresponds to the time point where ℜE is clearly below 1. From the time point of the first breakpoint in ℜE, there is about an 11-day delay until the breakpoint in the number of infected, indicating a clear increase. The second breakpoint in ℜE corresponds well to the tipping point in the
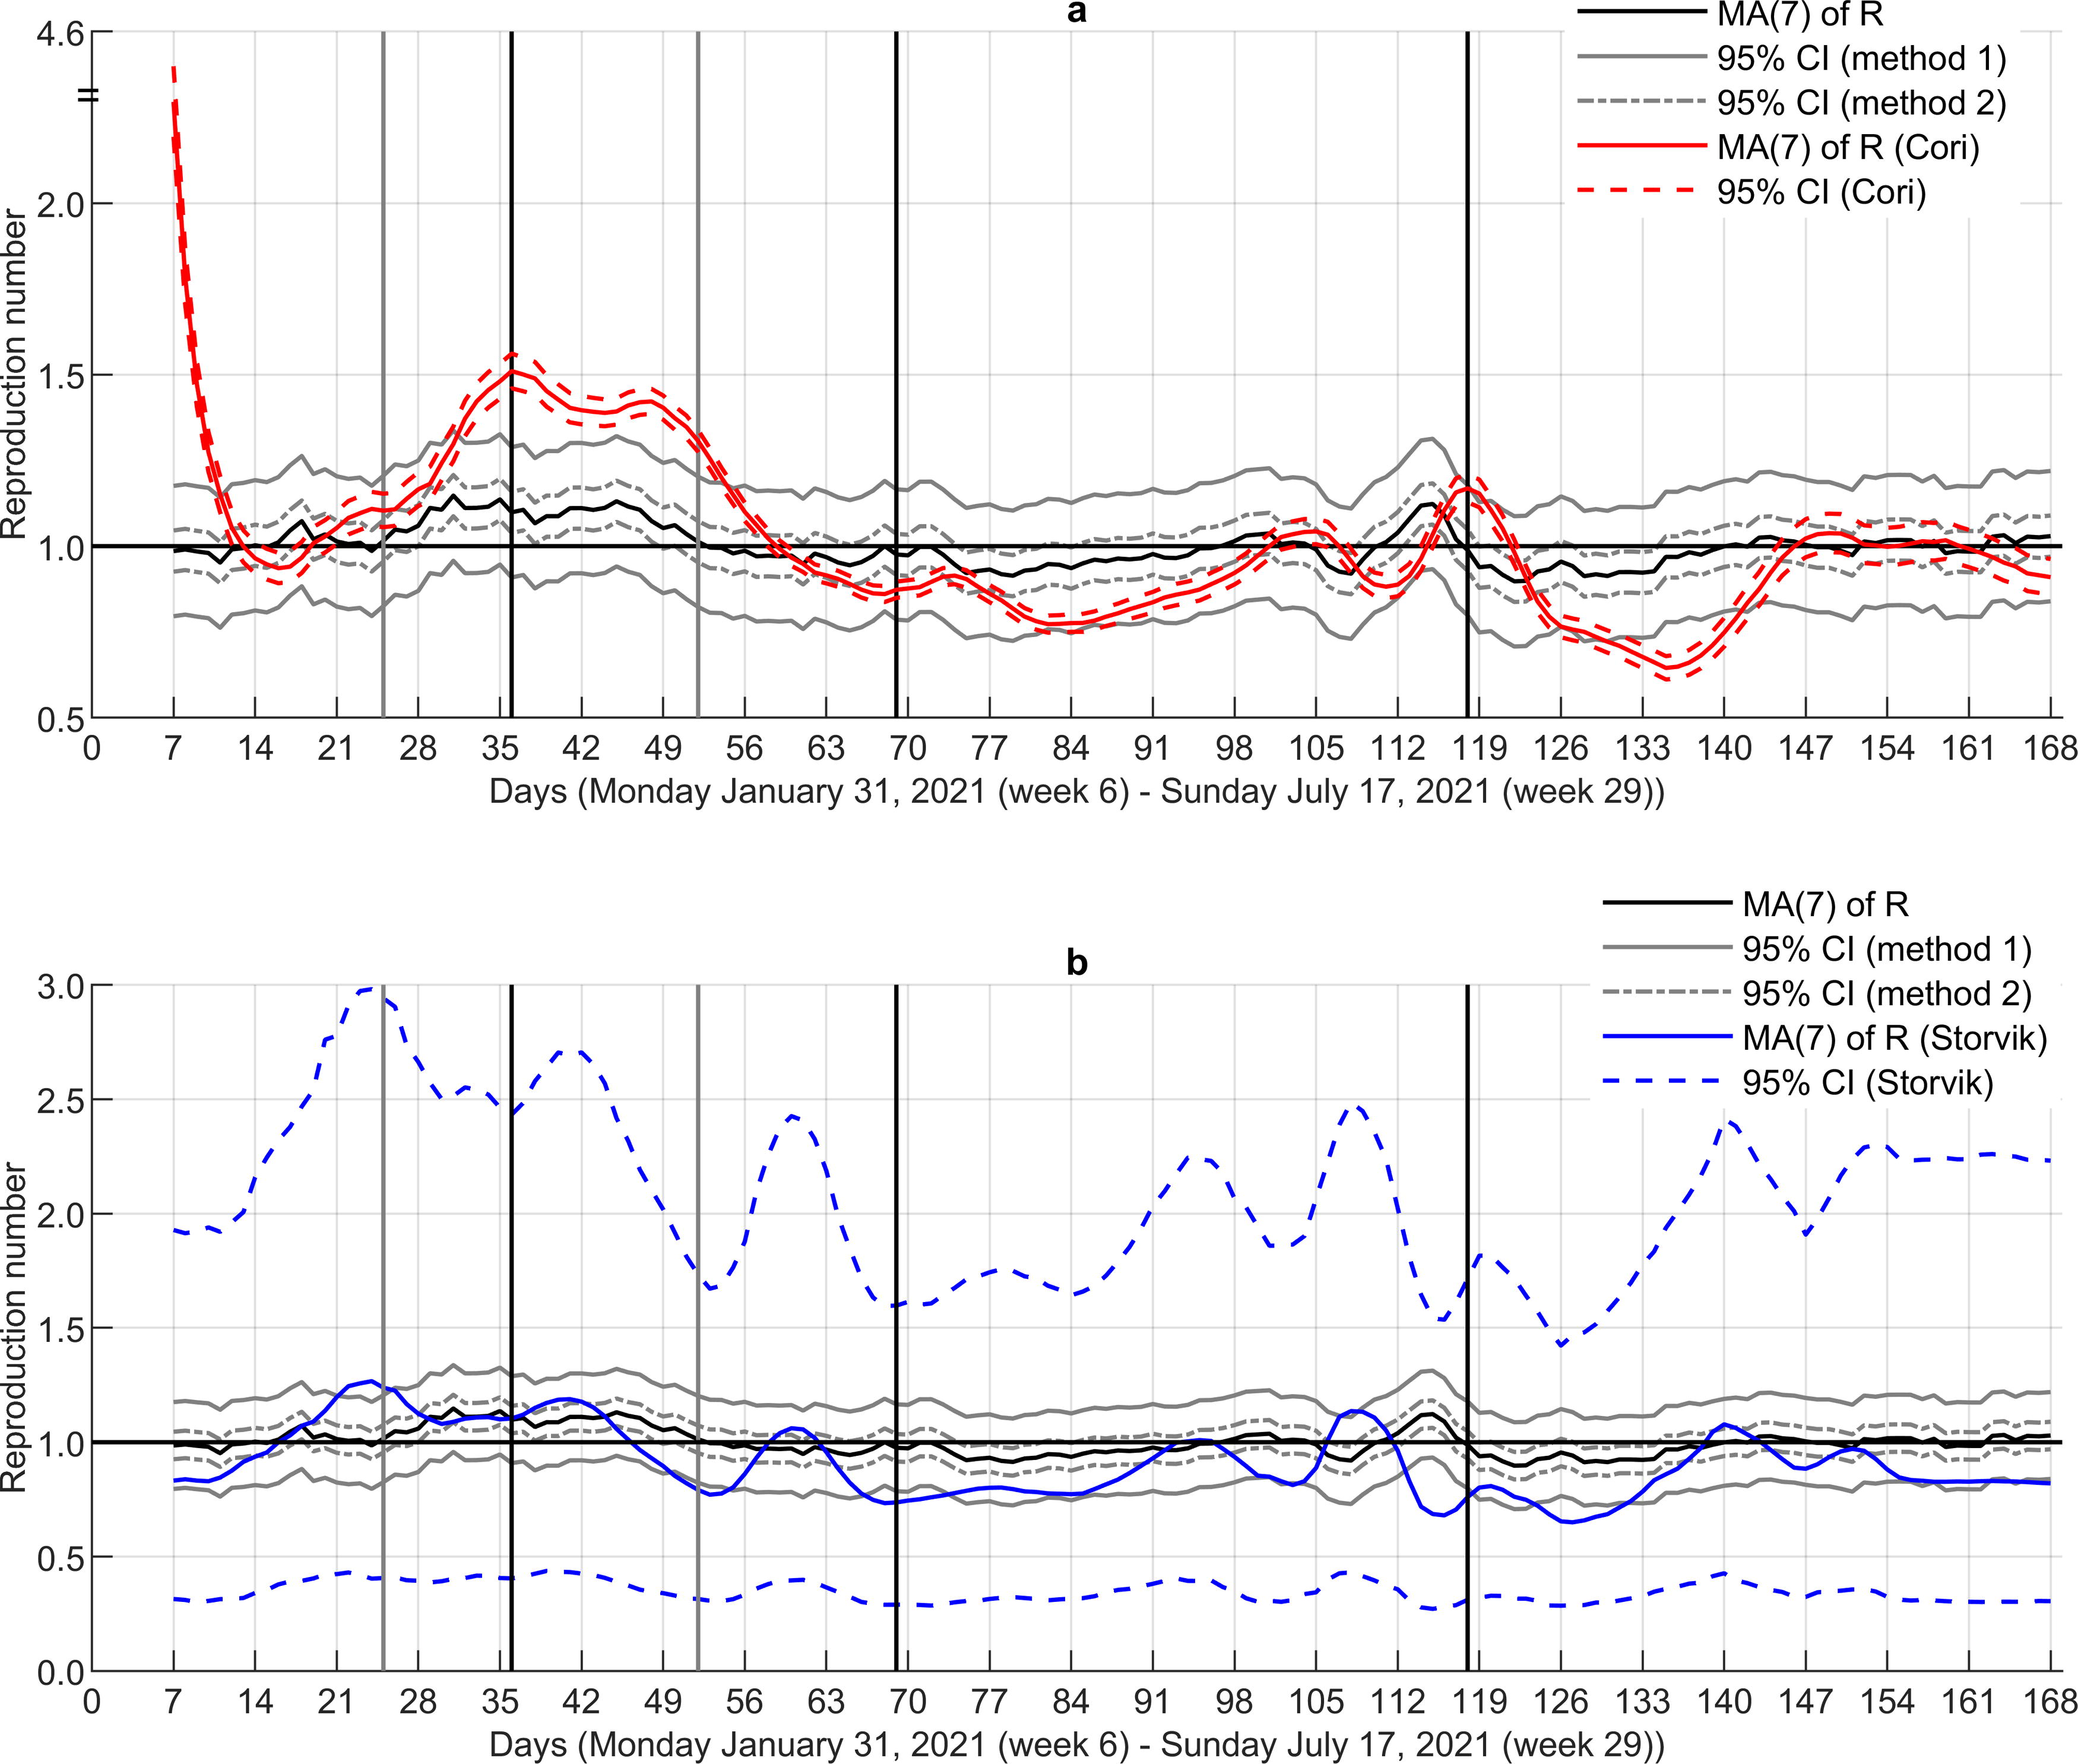
Step 2—Benchmarking. The estimated reproduction numbers are clearly more stable than the numbers obtained by the approach of Cori et al. (2013) (Fig. 3a). The latter approach overestimates the reproduction numbers in intervals where an increase in
Step 3—Different wave. We next run our approach for ℜE on the Norwegian data from the beginning of the pandemic, including the period April 19, 2020–January 16, 2021 (Fig. 4). The model fit was good also for this period, resulting in an RMSE of 2.0 indicating an average deviation of about two infected cases from the observed numbers. There was only one breaking point identified in the series of reproduction numbers, where the clear increase toward 1 was observed. It corresponds well with slightly growing numbers in state
Comparison of our reproduction numbers to the corresponding numbers obtained by the approach of Cori et al. (2013) and Storvik et al. (2023) shows remarkable discrepancies (Fig. 5), indicating that our approach is considerably less sensitive to large variations in the number of infected individuals.
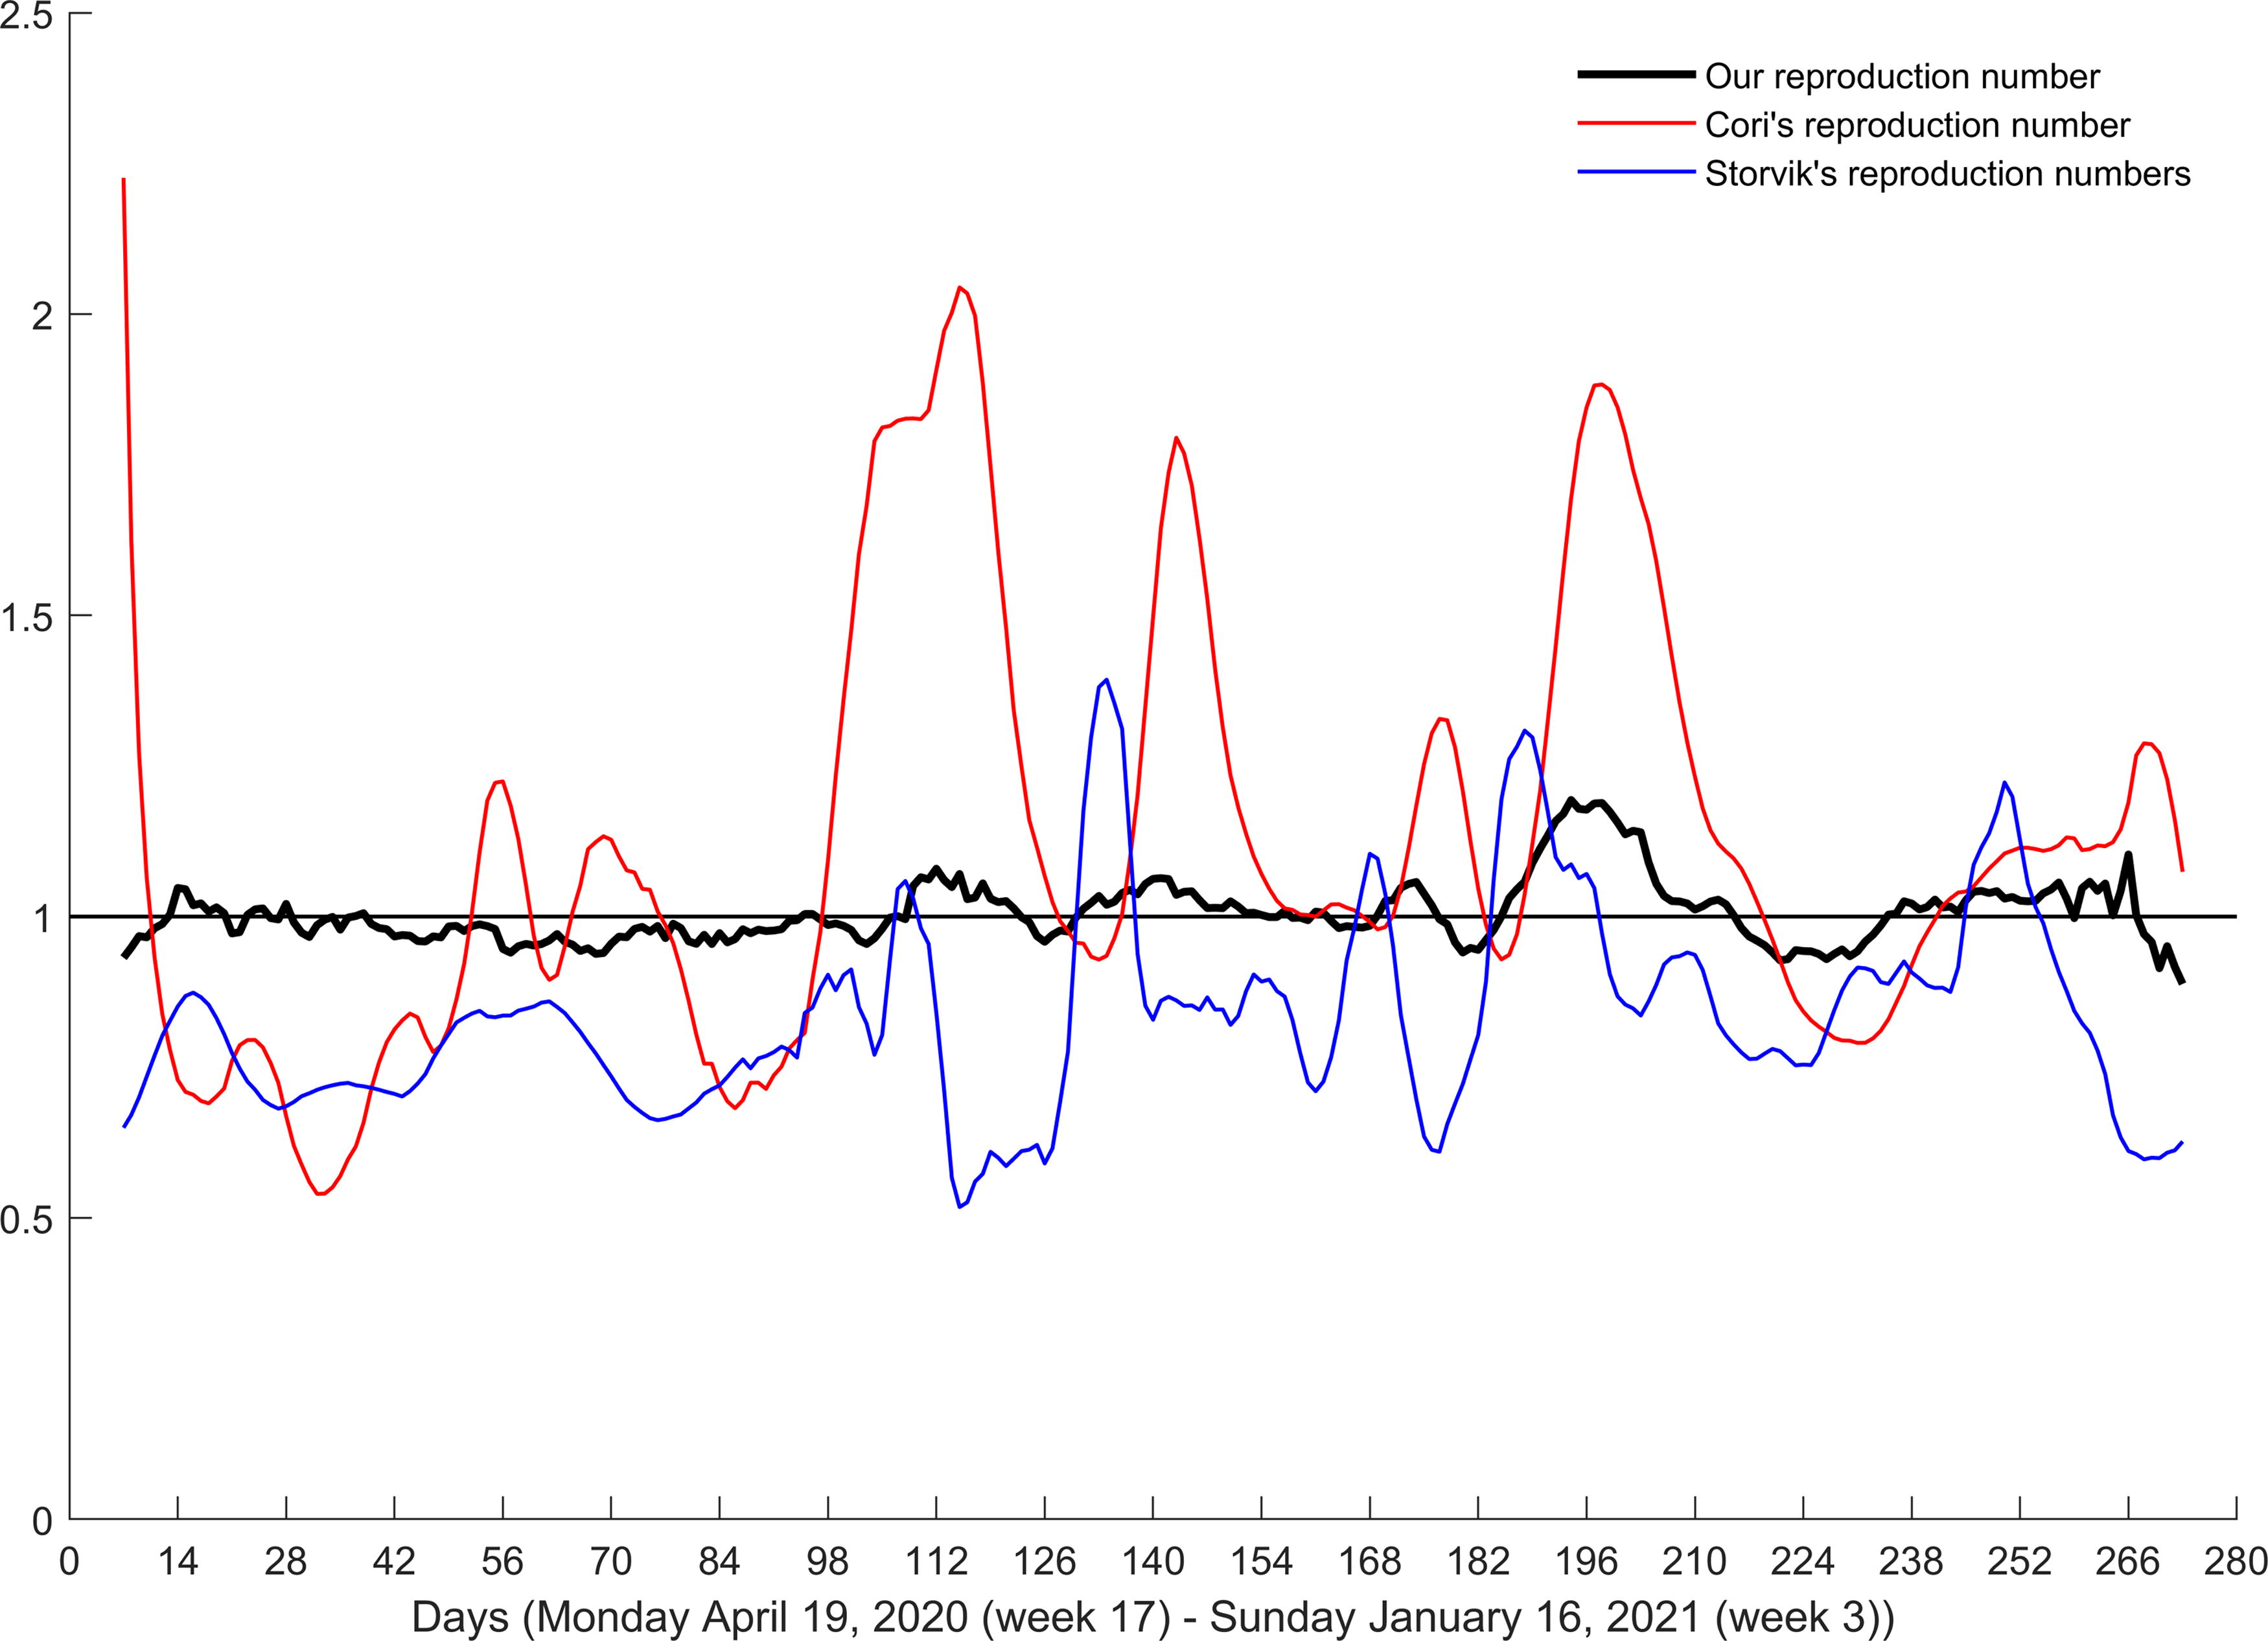
Reproduction numbers by the three approaches. Black horizontal line denotes ℜE = 1.
Step 4—Short-time prediction. This sensitivity analysis applies the reproduction numbers derived by our and the two other approaches as predictor for a short-term (1-, 3-, and 5-day) prediction for the number of infected individuals (Fig. 6). In all three cases, the approach by Cori et al. (2013) performs worst, whereas our approach is convincingly best according to RMSE. The pronounced volatility and delay observed when benchmarking our results to Cori et al. (2013) and Storvik et al. (2023) propagate into the short-term prediction. Although a 1-day prediction by our approach performs very well, more variation is observed in 3- and 5-day predictions. When the number of infected escalates, the variation increases as well. The increased variation in predictions seems to closely follow this pattern and the breakpoints in the number of infected individuals.
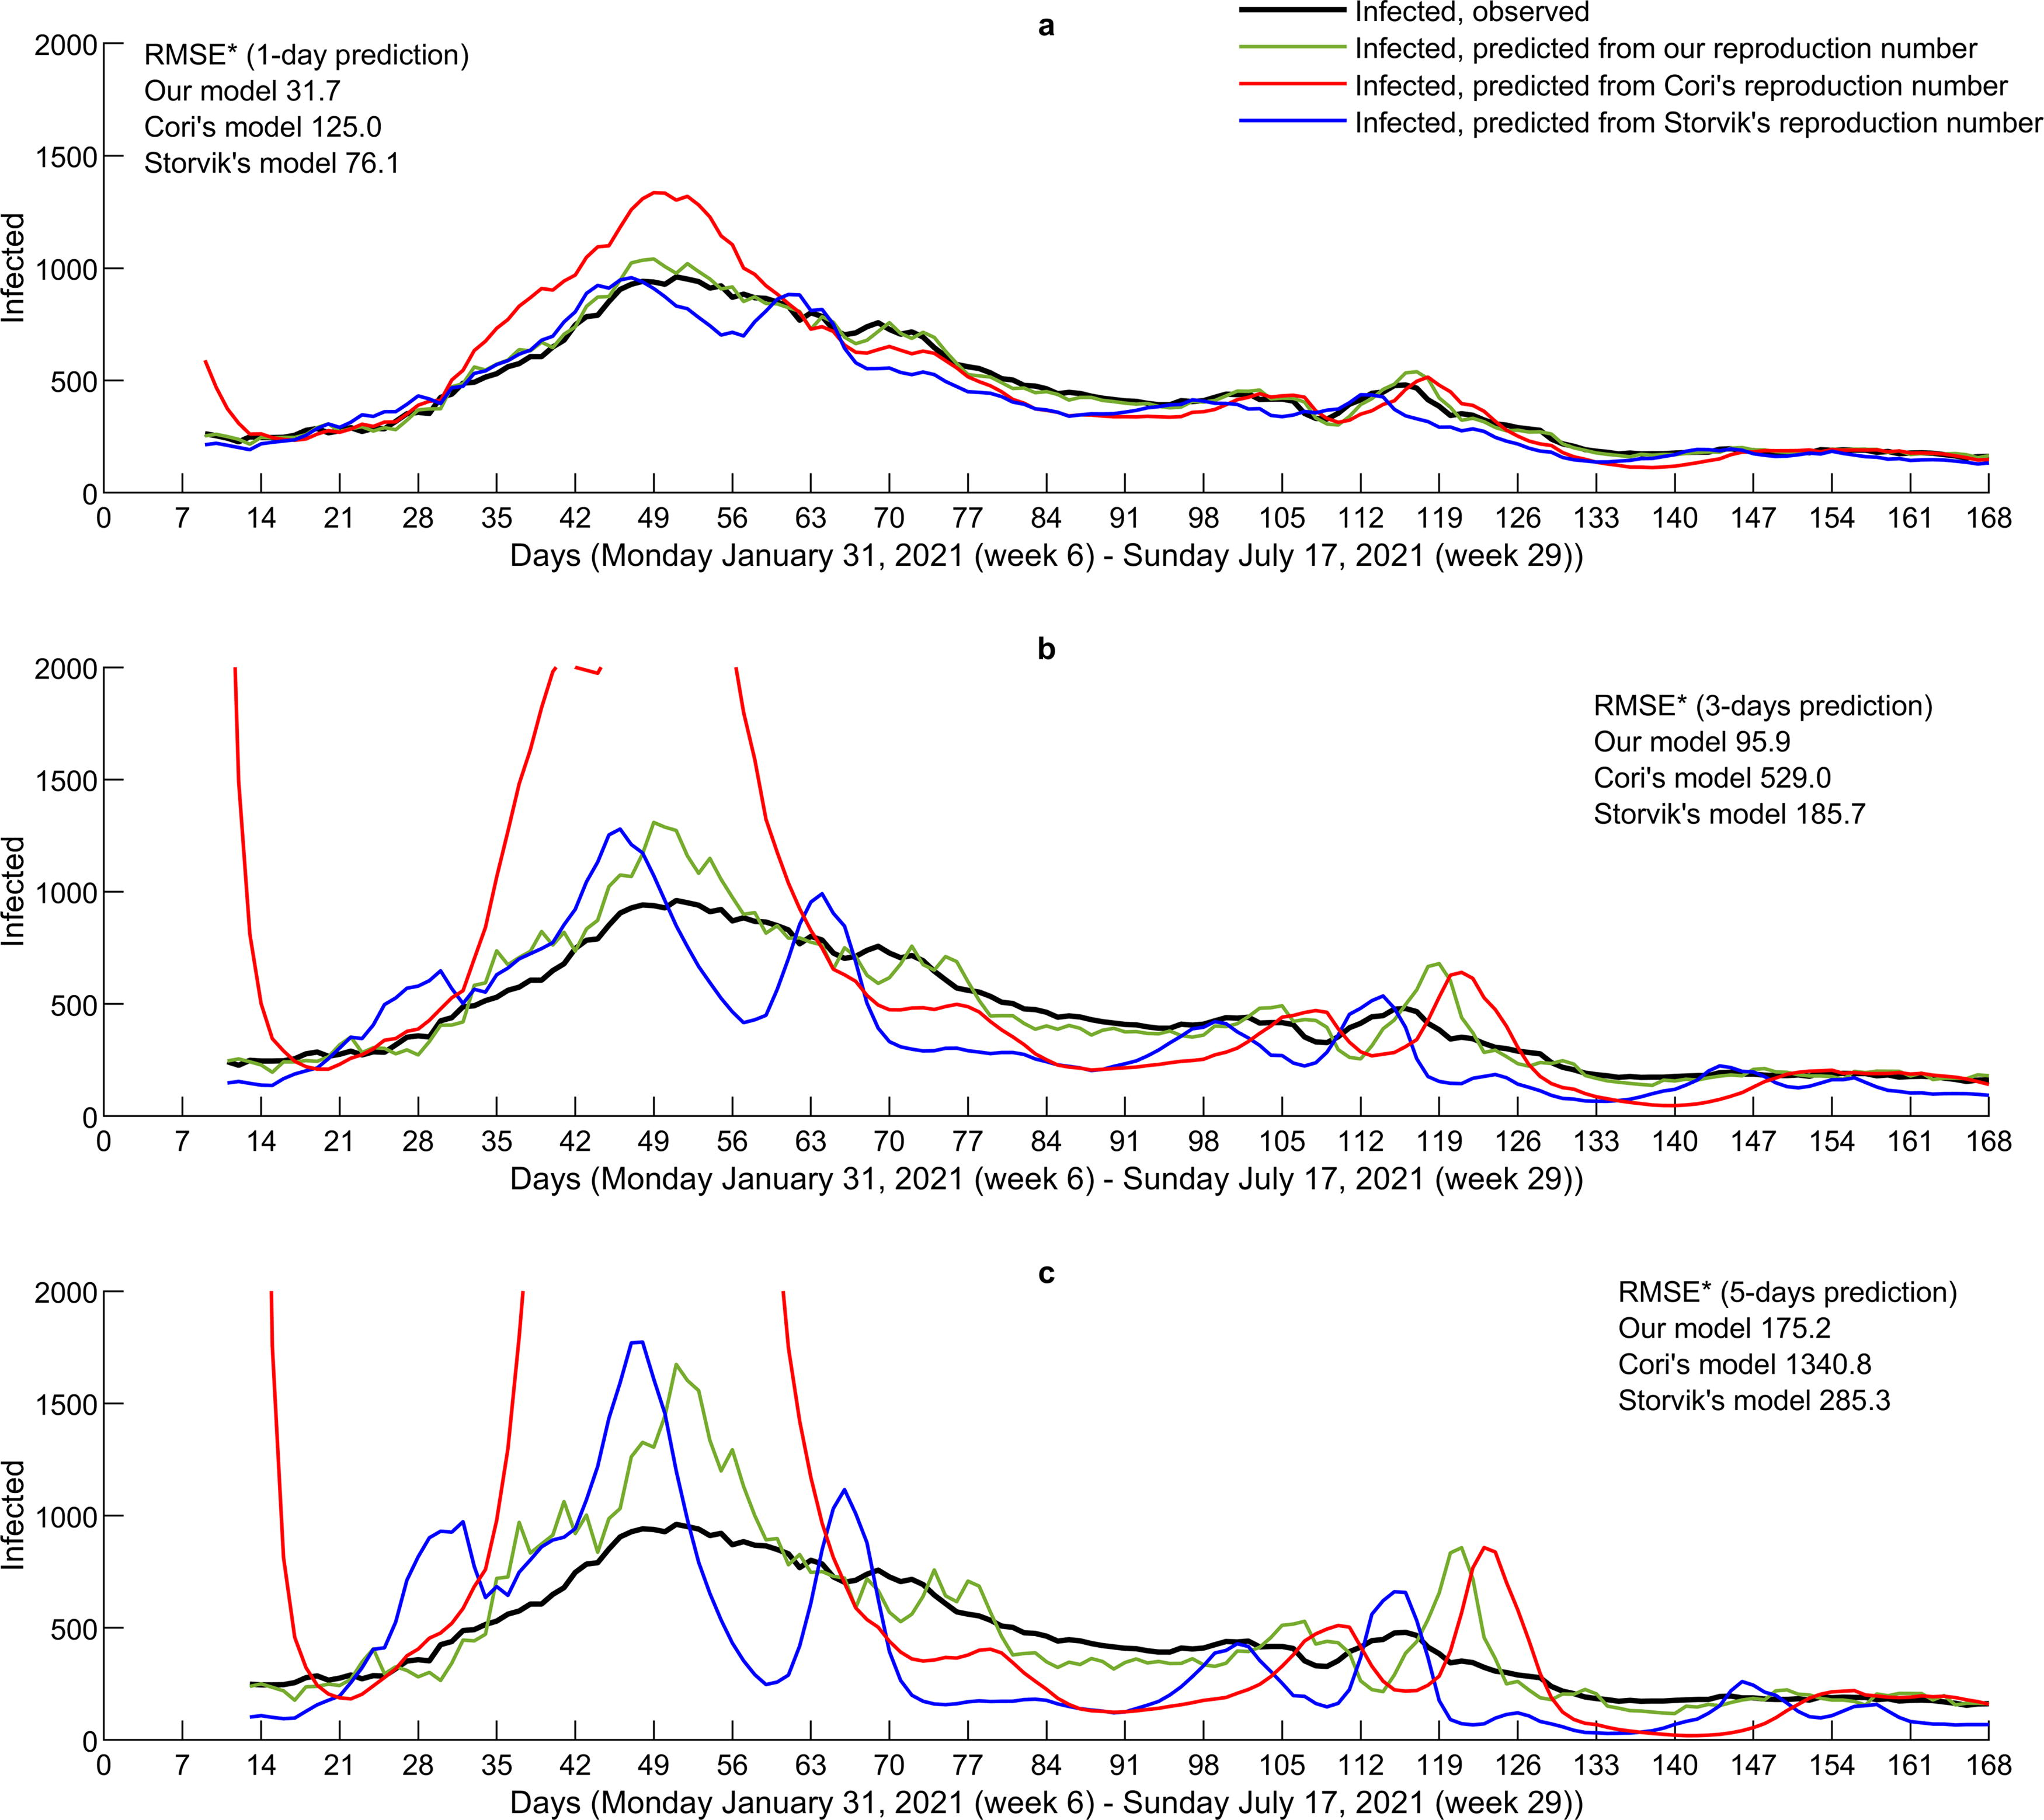
Number of infected individuals predicted from reproduction numbers as defined in (7). The RMSE (*) is calculated by skipping predictions up to day 19 to avoid escalated values by approach of Cori et al. (2013).
Step 5—Sensitivity and elasticity analysis. It is easy to show that the SI for
DISCUSSION
We propose an approach for estimating nearly instantaneous daily reproduction numbers based only on the number of infected. The approach uses the SIR model dynamics through a multivariate nonlinear regression model, allowing for simultaneous assessment of the time-varying transmission and recovery rate, parameters defining the reproduction number. In some respects, our approach resembles machine learning methodology in the pandemic context (for example, Raissi et al., 2019; Alanazi et al., 2020). However, instead of training the model on a huge amount of input variables, we inform it by the SIR dynamics consisting of ordinary differential equations, making the model parsimonious and easy to apply and fine-tune. As the SIR is an epidemiological model, it points our approach toward the area of physics-informed learning yet not at the expense of numerous input variables, vast amount of data, and computer-intense training.
The proposed method is a direct approach, requiring minimal computational resources, which could provide an attractive tool for monitoring the instantaneous reproduction number, and thus allowing for nowcasting of the pandemic. Only 12 days from the start of a pandemic, our approach enables estimation of daily reproduction numbers for monitoring and decisions regarding the measures. As the input required is only the number of infected individuals, this approach avoids numerous sources of additional variation following from multiple input variables in complex and computationally intensive models (e.g., Storvik et al., 2023).
When benchmarked on reproduction numbers by Cori et al. (2013), our results show that the same tendencies, however, are much less explosive in periods with increasing infection rates. Cori et al. (2013) define the reproduction number at one time point as the ratio between the number of new infections at that time point and the weighted sum of infections up to that time point. This definition implies a long-term memory, and one may therefore ask whether the mixture of historical data and current data slows down—or exaggerates—the response to changes. Furthermore, the approach of Cori et al. (2013) suffers from systematic bias in the initial estimation period (O’Driscol et al., 2021). Comparison with the reproduction numbers acquired by Storvik et al. (2023) shows that our estimated values catch up trends in infection rates more effectively (quicker and more correct) and are much less volatile. There are a couple of interesting points to be mentioned here. Storvik et al. (2023) inform their SEIR model by, among other things, time series of hospitalized individuals. Since there is a delay of up to 10 days in hospitalization with respect to symptom onset (Faes et al., 2020), the reproductive numbers projected from such an SEIR model become outdated and fail to reflect the real time dynamics of the pandemic. Moreover, the model might imply causality problems as hospitalizations occur after infection, which, in turn, is closely linked to the reproductive numbers. In our view, it is counterintuitive to include the hospitalizations as input in the model for determining future reproductive numbers. Furthermore, the number of parameters in the approach by Storvik et al. (2023) is tremendous and thus requires multiple inputs and significant computational resources. Although powerful but costly processors handle the computational issues in the Western world, this might cause serious issues for timely decisions based on such models in less economically developed countries where epidemic is nearly everyday problem. Multiple, often highly uncertain, or difficult-to-assess, inputs only escalate the problem. The distinct delay and strikingly wide 95% CIs in the numbers by Storvik et al. (2023) are likely because of complexity of the model and not necessarily plausible choice and amount of input variables, as well as additional stochastically specified parameters.
The covariation between profiles of series of infected numbers and series of reproduction numbers in our sensitivity analysis was clear when applying the suggested approach to the data from the beginning of the pandemic, exhibiting high volatility in the number of infected individuals. This is a sign of a robust tool. The sensitivity analysis consisting of short-term predictions by the three approaches also demonstrates a superiority of our approach. It is of interest and high relevance that a simple prediction of the number of infected individuals based on the definition of the reproduction number instead of the SIR dynamics performs apparently very well. Finally, sound results of sensitivity analyses and elasticity indexes close to 1 further emphasize the strengths of the suggested approach.
Our approach was developed by assessing several model specifications discussed next.
The best model fit in terms of RMSE was achieved for the case of a 7-day moving average of number of infected as input. The model struggled with some convergence problems when running it on observed daily data, likely because of the apparent weekend effect and the considerable variations in observed values. As a moving average smoothes data and makes trends more perceivable, we argue that such averaged input data make the model more plausible than the approach suggested by Marinov and Marinova (2022). While a 7-day moving average seems to be a credible choice for COVID-19 data, considerations should, however, be done for each contagious disease individually.
The assumed initial value of 0.5 for transmission rate
Numerical problems occurred when attempting to minimize a sum of squares with respect to all three SIR model components simultaneously. The back-calculation of
To summarize, the comparative analysis demonstrates clearly better properties of our reproduction numbers as compared with other approaches within the same (Storvik et al., 2023) as well as across different (Cori et al., 2013) class of models widely used in assessing SARS-CoV-2 virus. Our reproduction numbers are the function of two virological parameters, transmission rate and recovery rate. The number of infected individuals simulated from the estimated parameter values is very close to the observed ones, showing that the parameters capture the virus properties well. The same is confirmed by a short-term prediction. The assumptions made in our analyses seem to be plausible but should be assessed again when modeling other viruses. For example, even though the SARS-CoV-2 virus had a contagious period of on average 5 days, other viruses may have shorter or longer contagious periods. The contagious period of any novel viruses is usually known, however, from early case reports in the initial phase of an outbreak.
CONCLUSIONS
Our suggested approach is entirely based on the number of infected individuals. Hence, to calculate reliable reproduction numbers, it requires a strong testing regime in an evolving pandemic. Uncertainties because of under-registration of infected individuals propagates into uncertainties in the estimated instantaneous reproduction numbers. However, this is the only source of uncertainty, contrary to the models relying on multiple (and numerous) sources with each own associated uncertainty, both in data and in model specification, which may rapidly lead to an escalation of the overall uncertainty and thereby loss of information content.
Footnotes
ACKNOWLEDGMENTS
The authors are grateful to Geir Storvik and colleagues for providing with their estimates of reproduction numbers in Norway, which were used for comparative purposes. The authors also thank the Editor and the Referees for valuable and constructive comments and questions, which improved the article considerably.
AUTHORS’ CONTRIBUTIONS
All authors contributed to the study conception and design. The analysis plan was prepared by J.Š.B. and F.E.B. Material preparation, data extraction, and analysis were performed by J.Š.B. The first draft of the article was written by J.Š.B., F.E.B., and E.R.N. who contributed significantly to previous versions of the article. J.Š.B., F.E.B., and E.R.N. read and approved the final article.
DATA SHARING
AUTHOR DISCLOSURE STATEMENT
The authors declare that they have no competing interests.
FUNDING INFORMATION
No funding was received for this article.