
Abstract
Integration of multi-omics data can provide a more complex view of the biological system consisting of different interconnected molecular components. We present a new comprehensive R/Bioconductor-package, IntOMICS, which implements a Bayesian framework for multi-omics data integration. IntOMICS adopts a Markov Chain Monte Carlo sampling scheme to systematically analyze gene expression, copy number variation, DNA methylation, and biological prior knowledge to infer regulatory networks. The unique feature of IntOMICS is an empirical biological knowledge estimation from the available experimental data, which complements the missing biological prior knowledge. IntOMICS has the potential to be a powerful resource for exploratory systems biology.
1. INTRODUCTION
Multi-omics data collect multiple modalities from the same set of samples and describe different aspects of cellular functioning. Integrative analysis combining multi-omics data can enhance our understanding of biological systems consisting of interconnected molecular components, which is crucial for developing novel personalized therapeutic strategies for complex diseases. Therefore, developing a freely available and user-friendly computational framework to infer regulatory relationships by integrating multiple omics data is one of the most relevant problems in systems biology (Hasin et al., 2017; Subramanian et al., 2020; Kang et al., 2022). Bayesian networks (BNs) are models used to represent probabilistic relationships between multiple interacting entities (Pearl, 1988; Cooper, 1989; Neapolitan, 1990). Over the past decades, BNs have become popular in computational biology (Lucas et al., 2004).
We present a new comprehensive R package, IntOMICS—a Bayesian framework based on Markov Chain Monte Carlo (MCMC) (Madigan et al., 1995) for multi-omics data integration, which combines prior knowledge with data-derived evidence for inferring regulatory networks. IntOMICS complements the missing prior knowledge using empirical biological knowledge estimated from the available experimental data. For further details about the IntOMICS algorithm, its performance and benchmark analysis, see Pačínková and Popovici (2022). IntOMICS implementation also includes functions to visualize empirical biological knowledge and generate diagnostic plots of an MCMC sampling scheme (Madigan et al., 1995).
2. DESIGN AND IMPLEMENTATION
IntOMICS implementation consists of two modules (Fig. 1). The OMICS module includes data preprocessing and computing some quantities needed to score a BN. IntOMICS apply the BGe score (Geiger and Heckerman, 1994) developed for continuous data. The BN module includes the MCMC sampling scheme for structure learning and sampling of BNs. In the last part of the BN module, IntOMICS infers the resulting network structure, including the edge weights representing the empirical frequency of given edges over the sample of network structures.
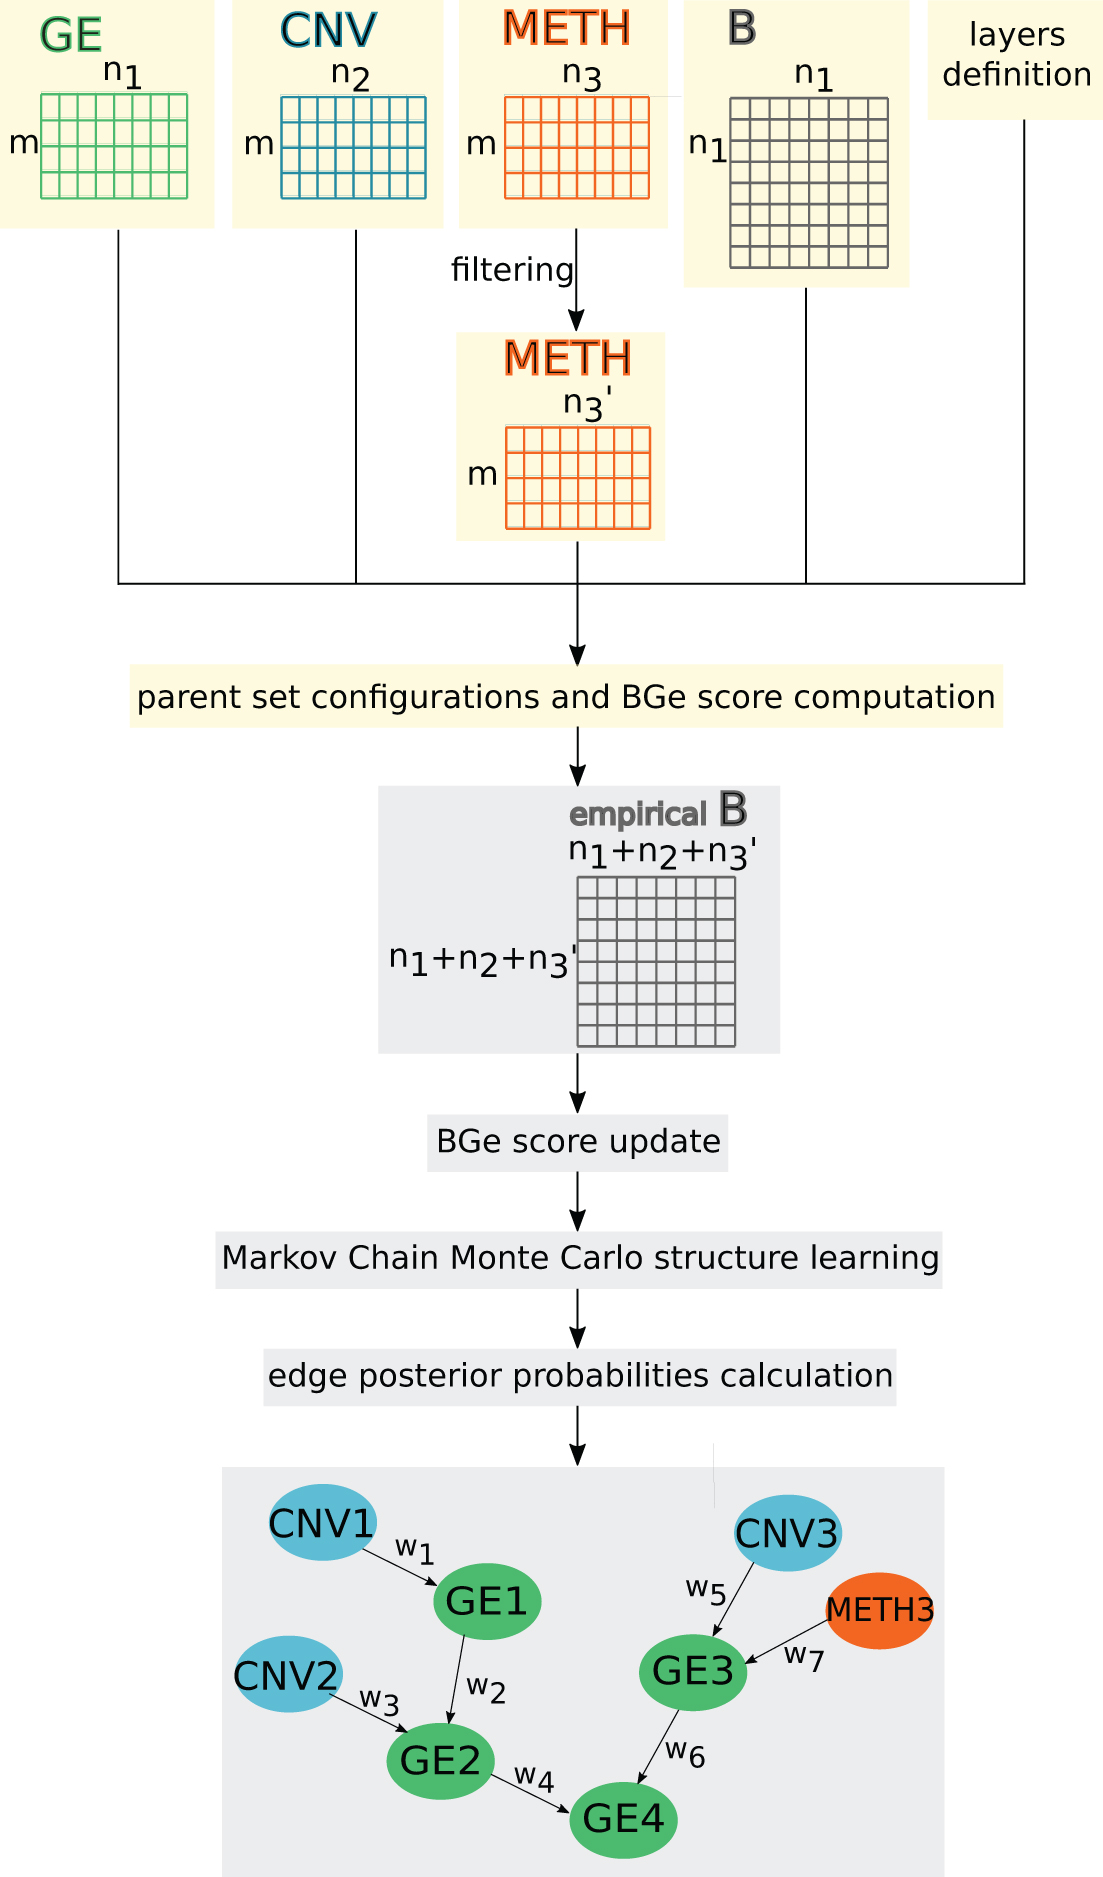
IntOMICS workflow. IntOMICS consists of two independent modules: yellow nodes are part of the OMICS module and gray nodes are part of the BN module. Edge weight wi represents the empirical frequency of given edge over samples of network structures. B, biological knowledge; BN, Bayesian network; CNV, copy number variation; GE, gene expression; METH, methylation.
Input to IntOMICS are
data matrices that represent collections of features for a set of samples (gene expression matrix [GE], copy number variation matrix [CNV], and DNA methylation matrix [METH]) and
biological prior knowledge, which contains the information on known interactions among molecular features from public database(s).
IntOMICS is designed to infer regulatory networks, even if copy number variation or DNA methylation data (or both) are not available.
IntOMICS adapts MCMC scheme to multi-omics data—GE, CNV, and METH—by layers definition. Edges from the GE to the CNV/METH layers are excluded from the set of candidate edges. The resulting regulatory network structure consists of three types of nodes: GE nodes refer to gene expression levels, CNV nodes refer to copy number variations, and METH nodes refer to DNA methylation levels. Edge weight wi represents the empirical frequency of a given edge over samples of network structures.
Although the method is designed to work on any modalities defined in a continuous domain, the current implementation is tuned for gene expression, copy number variation, and DNA methylation. Adding a new modality requires the implementation of a new interface for the OMICS module, whereas the computational engine in the BN module remains the same. In that case, the OMICS module interface needs to be modified to capture all possible regulators of nodes from the given layer and accordingly define all possible parent set configurations.
2.1. Usage example
We use IntOMICS to investigate Wnt signaling and the role of the FOXM1 gene in epithelial ovarian cancer (EOC) using 17 samples from the GSE146556 data set (Zhang et al., 2020) consisting of GE, CNV, and METH data. EOC is characterized by TP53 mutations, DNA copy number aberrations, numerous promoter methylation events, and NOTCH and FOXM1 signaling activation (The Cancer Genome Atlas Research Network, 2011). FOXM1, one of the crucial oncogene drivers of EOC proliferation, is upregulated in EOC (The Cancer Genome Atlas Research Network, 2011; Zhang et al., 2020).
Chen et al. (2016) identified FOXM1 as a novel target of the Wnt signaling essential for
The first step is to perform data preprocessing and compute quantities needed to score a BN using omics_module() function:
> OMICS_mod_res <- omics_module(omics = omics, PK = PK, layers_def = layers_def, TFtargs = TFtarg_mat, annot = annot, gene_annot = gene_annot, lm_METH = TRUE, r_squared_thres = 0.5)
It is possible to use linear regression to filter irrelevant DNA methylation probes through lm_METH = TRUE. Arguments such as r_squared_thres or p_val_thres can be used to define the minimal R2 or the p-value threshold to determine a significant result.
The next step is to estimate model parameters and generate a sample of BNs from posterior distribution:
> BN_mod_res <- bn_module(burn_in = 100000, thin = 500, OMICS_mod_res = OMICS_mod_res, minseglen = 50000)
Now we can generate the diagnostic plots of the MCMC simulation and filter the most reliable edges in the resulting network structure (in this example, we use 0.75 quantile of all edge weights as the edge weight threshold):
> trace_plots(mcmc_res = BN_mod_res, burn_in = 10000, thin = 500, edge_freq_thres = 0.75) > res_weighted <- edge_weights(mcmc_res = BN_mod_res, burn_in = 10000, thin = 500, edge_freq_thres = 0.5) > weighted_net_res <- weighted_net(cpdag_weights = res_weighted, gene_annot = gene_annot, PK = PK, OMICS_mod_res = OMICS_mod_res, gene_ID = “gene_symbol,” TFtargs = TFtarg_mat, B_prior_mat_weighted = B_prior_mat_weighted(BN_mod_res))
ggraph_weighted_net() function is used to visualize the resulting network structure with the color scale for all modalities used in the network structure inference:
> ggraph_weighted_net(net = weighted_net_res)
The resulting regulatory network can be seen in Figure 2. We can see several interactions known from the biological prior knowledge, including interactions from CTNNB1 (
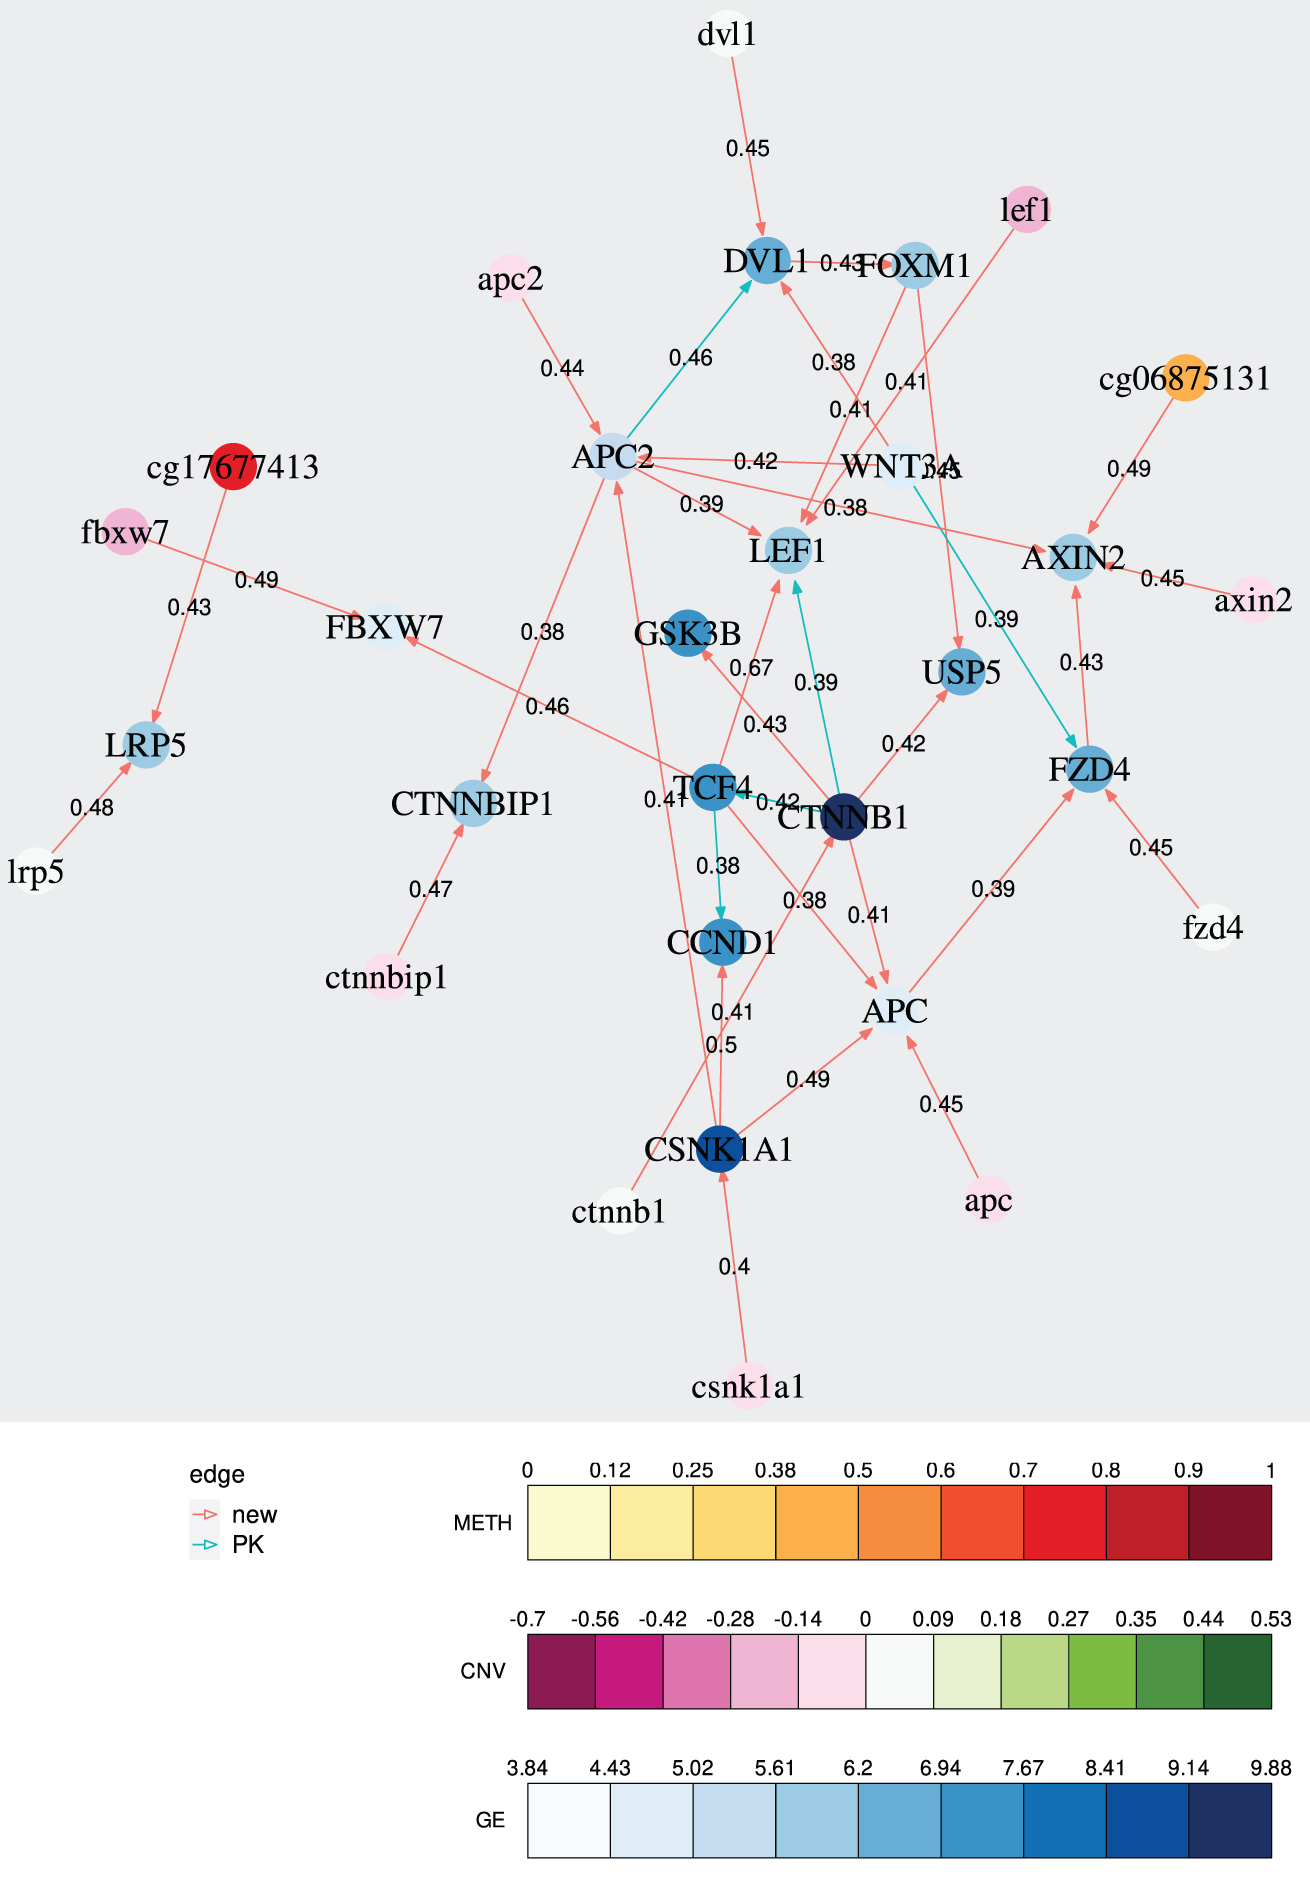
Example of the IntOMICS output. GE features are denoted by upper case, CNV features are denoted by lower case, and DNA METH features are denoted by methylation probe names (cgxxxx). PK, prior knowledge.
3. CONCLUSION
We present IntOMICS as a comprehensive and powerful tool for regulatory network inference using multi-omics data. IntOMICS combines prior knowledge with data-derived evidence to advance regulatory networks inference. IntOMICS is designed to be easily extended by another modality. The current implementation is tuned for gene expression, copy number variation, and DNA methylation data. However, the user can infer regulatory network, even if copy number variation or DNA methylation data (or both) are not available. IntOMICS is a powerful resource for exploratory systems biology and can provide valuable insights into biological processes' complex mechanisms that have a vital role in personalized medicine.
Footnotes
ACKNOWLEDGMENTS
The authors thank Research Infrastructure RECETOX RI [LM2018121] financed by the Ministry of Education, Youth, and Sports, and Operational Programme Research, Development, and Innovation—project CETOCOEN EXCELLENCE [CZ.02.1.01/0.0/0.0/17_043/0009632] for supportive background. Access to computing and storage facilities owned by parties and projects contributing to the National Grid Infrastructure MetaCentrum provided under the programme “Projects of Large Research, Development, and Innovations Infrastructures” CESNET [LM2015042] is greatly appreciated.
This work was supported from the European Union's Horizon 2020 research and Innovation program under grant agreement No. 857560. This publication reflects only the author's view, and the European Commission is not responsible for any use that may be made of the information it contains.
AUTHORs' CONTRIBUTIONS
Conceptualization, software, validation, formal analysis, data curation, writing—original draft, and visualization by A.P. Conceptualization, methodology, writing—review and editing, supervision, project administration, and funding acquisition by V.P.
AVAILABILITY
AUTHOR DISCLOSURE STATEMENT
The authors declare that they have no conflicting financial interests.
FUNDING INFORMATION
This study was supported by Czech Science Foundation (GACR) through Grant No. 19-08646S and the European Union's Horizon 2020 research and innovation programme under Grant Agreement No. 825410.