
Abstract
Background:
Early childhood interventions that support the development of healthy lifestyle behaviors are key to ensuring equitable health outcomes later in life. The aim of this article is to assess the extent to which early care and education (ECE) sites adopt best practices to support healthy diet and physical activity (PA) behaviors and whether adoption differs between centers and family child care homes (FCCHs).
Methods:
The study is a cross-sectional analysis of best practices at Supplemental Nutrition Assistance Program-Education (SNAP-Ed)-eligible child care centers (n = 76) and FCCHs (n = 47) in California. Generalized linear models were used to estimate associations of facility type with eight best practice index measures in the following three areas: dietary intake (nutrition education, food and beverage quality, staff training in nutrition), PA (quantity of PA opportunities, quality of PA opportunities, environmental support for PA), and parent engagement and wellness policies (comprehensive, active parent engagement and support for wellness policy implementation, monitoring, and feedback).
Results:
Overall, ECE sites scored an average of 64.8% of maximum points possible for best practices to improve dietary intake, 81.7% for best practices to improve PA, and 51.8% in comprehensive parent engagement and wellness policies. FCCHs adhered to fewer best practices for robust nutrition education, relative to centers (β = −0.41, 95% CI [−0.70, −0.12]). Differences were also observed in individual practices between settings.
Conclusion:
This study highlights opportunities for programs such as SNAP-Ed to support ECE providers in implementing nutrition and PA best practices to help children ages 0–5 develop healthy habits.
Introduction
During the first 5 years of life, children are highly receptive to their environment, establishing lifelong habits associated with future health outcomes. 1 However, not all children are offered the same opportunities to engage in healthful behaviors.2,3 Residents of low-income neighborhoods in the United States often have more limited access to affordable, nutritious food and safe spaces for physical activity (PA) compared with those in higher income neighborhoods.2–6 Socioeconomic barriers are associated with health disparities; children from households with low income consistently experience higher rates of overweight and obesity, poorer quality diets, and fewer minutes of moderate-to-vigorous PA.2,4,7,8 Childhood health status, predominantly the incidence of obesity, is associated with long-term cardiometabolic impacts such as type 2 diabetes and cardiovascular disease.9–13
Approximately two-thirds of US children ages 0–5 spend time in nonparental child care. Child care settings provide 40% of these children’s daily calorie intake, suggesting the importance of early care and education (ECE) settings for promoting the health of children nationwide.14,15 Consequently, federal and state agencies (e.g., US CDC,
In California, CalFresh Healthy Living (CFHL, known as Supplemental Nutrition Assistance Program-Education or SNAP-Ed nationally) implements health promotion interventions in ECE settings within low-income communities. Local health departments (LHDs), one implementer of CFHL programs, support healthy eating and active living interventions at licensed child care sites, both child care centers (hereafter called “centers”) and family child care homes (FCCHs), which differ in size, setting, and structure. In California, FCCHs operate in private residences and care for up to 14 children, creating home-like environments where children are typically cared for in mixed-age groups.24,25 FCCHs typically have a lower child-to-staff ratio; however, providers are responsible for all aspects of care and business operation. 25 In contrast, centers usually serve more children in a structured, school-like environment with age-based classrooms. 25 They often have resources dedicated to certain aspects of operation (e.g., central kitchen, a center director) and operate in larger facilities. 25
Families may have a preference for which setting best fits their needs and values but face barriers in utilizing their preferred child care type. These barriers are often greater for families with low income and include facility cost, proximity, and hours, as well as housing instability of the families seeking care.26–28 In California, FCCHs typically cost less than centers and are more likely to offer flexible hours (e.g., evening or weekends), better meeting the needs of some families with working caregivers and/or living on lower incomes.29–31 Statewide, although there are twice as many spaces available in centers than FCCHs, there are only spaces available for 25% of children with working parents. 32
To facilitate change, effective nutrition policy interventions are designed for the socioeconomic, behavioral, and demographic characteristics of the populations they intend to serve. 33 Therefore, policy makers and implementers must understand how dietary and PA best practices are adopted by both FCCHs and centers serving low-income communities to ensure that health promotion efforts reach low-income families equitably. Previous studies have examined differences between child care settings in nutrition and PA practices, such as time spent in PA and serving of fruits and vegetables, sugary foods, and type of milk; however, evidence is limited and findings are mixed.34–37 For example, Natale et al. found that centers in Miami offered less fresh fruit compared with FCCHs, while Dev et al. found no differences in fruit provision between centers and FCCHs in Nebraska.35,37
In 2019, Nutrition Policy Institute evaluators conducted a literature review to identify nutrition and PA (nutrition-PA) best practices in the ECE setting (Table 1), and then translated this review into evidence-based program guidance for LHDs planning ECE interventions beginning in 2020. 38 Specifically, for programs targeting child nutrition, recommendations include offering robust nutrition education, high-quality food and beverages, and staff training in child nutrition. For programs targeting child PA, recommendations include improving the quantity and quality of PA offered, as well as offering environmental support. 38 Additional recommendations for comprehensive nutrition-PA programs include fostering parent engagement and supporting wellness policy implementation, monitoring, and feedback. 38 This study aims to assess the extent to which ECE sites partnering with LHD CFHL programs adopt individual best practices, as well as the set of best practices comprehensively, and whether best-practice adoption differs by facility type.
Summary of Dietary and Physical Activity Practices Measured
Dietary and PA practices were measured using the Early Care and Education Site-Level Assessment Questionnaire (ECE-SLAQ). ECE SLAQ is a valid, reliable assessment tool with 70 items that measure the extent to which an ECE site is engaged in evidence-based practices that promote healthy eating and PA for enrolled children.
Methods
Study Sample
This study is a cross-sectional analysis of a survey conducted among California child care providers partnered with LHDs on CFHL-funded Policy, Systems, and Environment interventions, where self-assessment of nutrition-PA best practices was a required component of the intervention. All sites were CFHL-eligible (i.e., located in an area where at least 50% of households earn ≤185% of the federal poverty level or at least 50% of children enrolled in the site receive reimbursement for nutritious meals and snacks served from the Child and Adult Care Food Program, also known as CACFP), CA Department of Social Services (CDSS)-licensed, and served meals and/or snacks to children aged 0–5. The survey sample included 124 child care sites that completed assessments between July 2022 and October 2023. FCCHs and centers were categorized according to CDSS criteria. 39 One site that reported zero enrolled children was excluded, resulting in a final analytical sample of 123. No information was collected about individual children or child care providers. The University of California, Davis Internal Review Board determined that this study did not meet the definition of human subjects’ research and did not require review by the board.
Measures
The ECE Site-Level Assessment Questionnaire (ECE-SLAQ) is a valid, reliable assessment tool with 70 items that measure the extent to which ECE programs, including Head Start, public preschools, and child development centers, are engaged in evidence-based practices that promote healthy eating and PA for enrolled children.40,41 Most items were scored 0–4, with higher scores representing greater implementation of the practice. Questionnaires were submitted online using the platform Survey123. Questionnaire respondents included program directors, supervisors, teachers, instructors, and other staff who were knowledgeable about nutrition-PA practices at their site.
Eight index measures were constructed to reflect best practices identified in the literature review, grouped into the following three categories: best practices to improve dietary intake (robust nutrition education, quality of food and beverage offered, staff training in child nutrition), best practices to improve PA (quantity, quality, and environmental support of PA), and parent engagement and wellness policy (comprehensive, active parent engagement and support for wellness policy implementation, monitoring, and feedback) (Table 1, Supplementary Table S1). 38 Scores for individual questions were summed to calculate index scores. A summary measure was used for each of the three categories (i.e., dietary intake, PA, parent engagement, and wellness policy) by calculating the percent of maximum points scored for each index measure, then taking the average across index measures.
The ECE-SLAQ also included questions regarding participation of sites in a larger organization (e.g., Head Start, a school district), age range of children enrolled, and length of program (full-day, half-day, both). In addition to the questionnaire data, publicly available data were used to ascertain CACFP participation and urbanicity of ECE site locations.42,43
Statistical Analyses
Researchers examined descriptive statistics of our sample and assessed bivariate associations of individual ECE-SLAQ questions and facility type with Student’s t-tests. Generalized linear models with a quasi-Poisson distribution and a log link (appropriate for underdispersed or overdispersed non-negative data) were used to estimate the association of ECE facility type with each index and summary measure. All models were adjusted for participation in CACFP, being part of a larger organization, number of children enrolled, program length, and urbanicity, and accounted for clustering by LHDs using robust standard errors. All analyses were conducted in R (version 4.3.2).
Results
Site Characteristics
The final sample included 47 FCCHs and 76 centers (Table 2). Sites enrolled an average of 26.8 children, with higher average enrollment among centers (mean = 37.5) than FCCHs (mean = 9.6). FCCHs more frequently offered only full-day programs (87.2%) compared with centers (51.3%), while centers more frequently offered only half-day programs (34.2%) compared with FCCHs (2.1%). Less commonly, sites offered both full- and half-day programs (10.6% of FCCHs, 14.5% of centers). Most centers (84.2%) reported being part of a larger organization or partnership compared with just 6.4% of FCCHs. About half (51.2%) of all sites participated in CACFP; participation was more common among centers (81.6%) compared with FCCHs (2.1%). About half of ECE providers were located in urban areas (52.8%), with fewer suburban (28.5%) and rural (18.7%) sites. Centers (28.9%) outnumbered FCCHs (2.1%) in rural regions.
Sample Characteristics of Early Care and Education Sites (n = 123) a
Number of sites by local health department ranges from n = 1 (Glenn, Napa, Tulare) to n = 33 (San Diego) with 14 local health departments represented.
Site is part of a larger organization such as Head Start or a school district.
CACFP, Child and Adult Care Food Program.
Best Practices to Improve Dietary Intake
For the full sample, sites scored an average of 64.8% of maximum points possible for best practices to improve dietary intake (Table 3). Among the three dietary intake index measures, sites scored the highest for quality of food and beverages offered (82.7%), followed by robust nutrition education (55.8%) and staff training in child nutrition (55.1%).
Summary Statistics of Index Measures Examining Best Practices in the Areas of Dietary Intake, Physical Activity, and Parent Engagement and Wellness Policies, Overall and by Early Care and Education Facility Type
Percent of maximum points possible.
Summary measures for (1) best practices to improve dietary intake, (2) best practices to improve PA, and (3) parent engagement and wellness policy are the average of the percent of maximum points possible for all index measures in that category.
In adjusted models, FCCHs adhered to fewer best practices for robust nutrition education, relative to centers (β = −0.41, 95% CI [−0.70, −0.12]) (Table 3). Within robust nutrition education, we observed that centers offered significantly more participatory/hands-on nutrition education than FCCHs (p = 0.04) (Supplementary Table S1). Activities such as taste tests, food preparation, gardening, and experiments differed between facility types (Fig. 1). With regard to quality of food and beverages offered, FCCHs reported preparing meals from scratch (p < 0.01) as well as serving fruits (p < 0.01) and vegetables (p < 0.01) more often than centers. Finally, FCCHs provided more frequent nutrition training opportunities for staff (p = 0.01). There were no statistically significant associations of ECE facility type with other index measures or the summary measure for dietary intake.
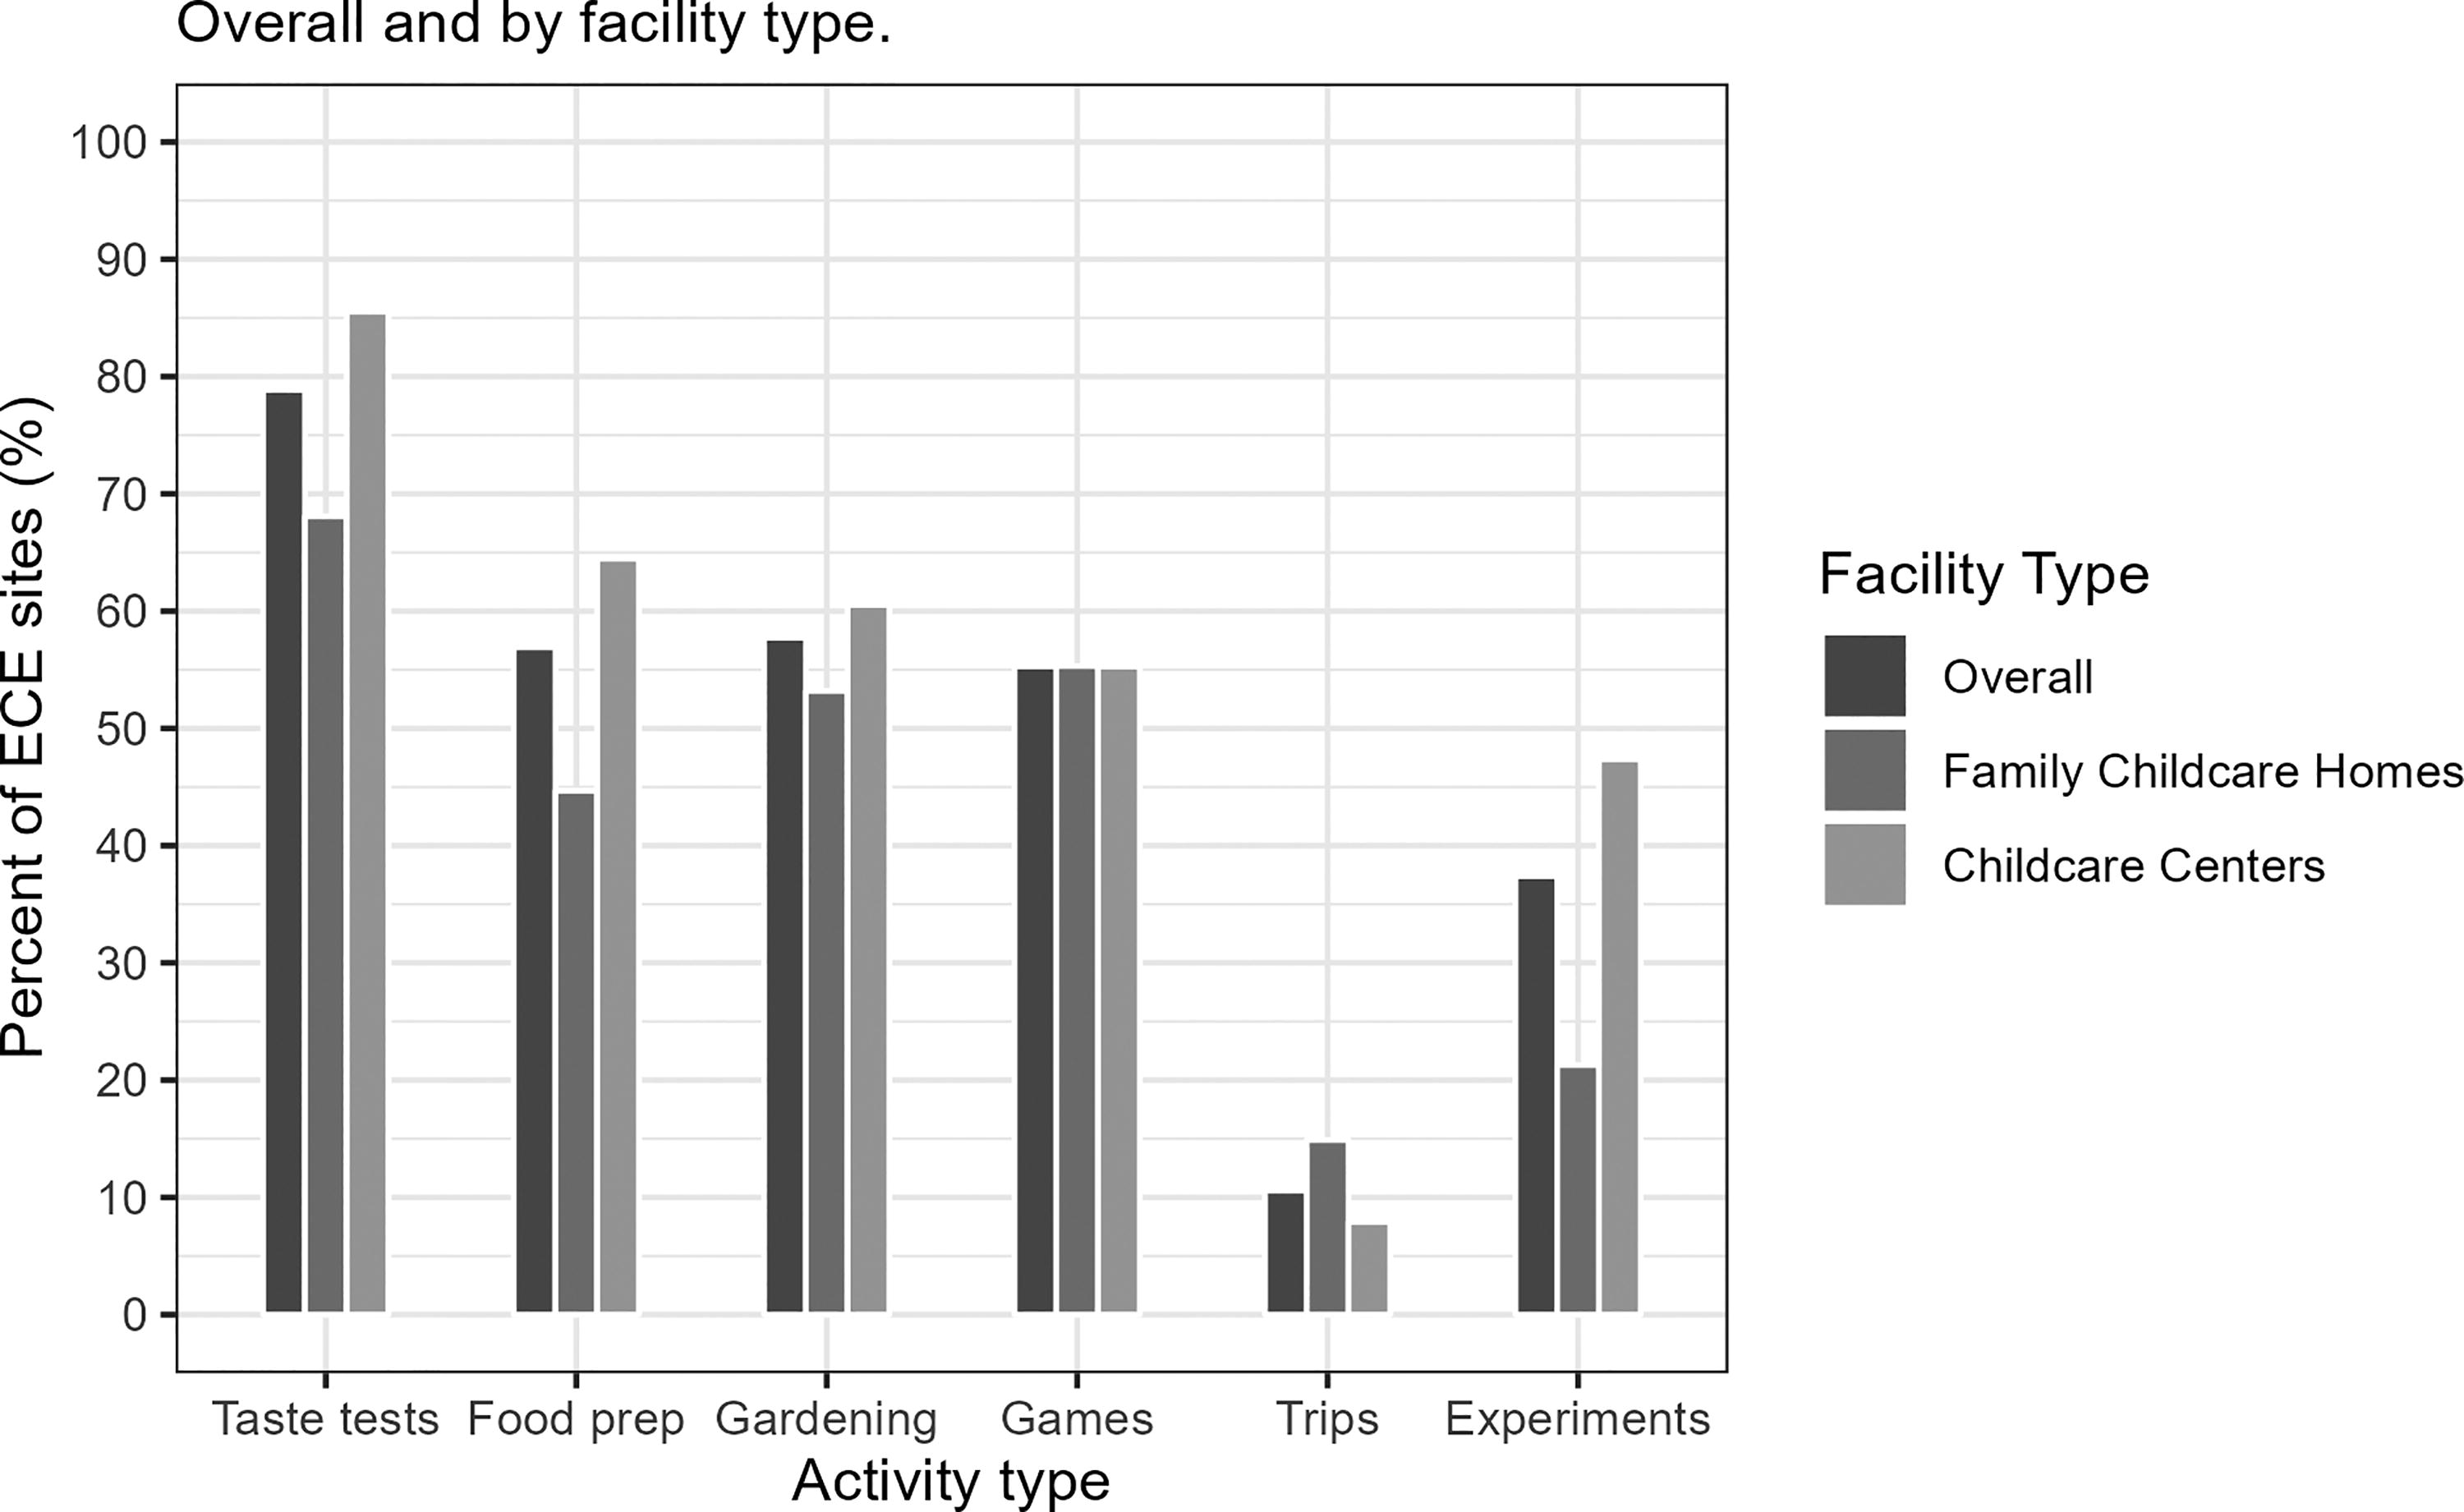
Question 4.9: Nutrition education and participatory/hands-on activities.
Best Practices to Promote PA
Among the total sample, ECE sites scored an average of 81.7% for practices to improve PA (Table 3). Scores were highest for practices to improve quantity of PA opportunities (89.3%), followed by environmental support for PA (81.4%) and quality of PA opportunities (73.6%).
In adjusted models, there were no statistically significant associations of ECE facility type with any index measures or the summary measure for PA (Table 3). However, differences in individual PA-related practices were observed. Compared with centers, FCCHs more often reported withholding active play time as punishment (p = 0.02) and having children seated for more than 30 minutes at a time (p = 0.02) (Supplementary Table S1). Staff-led PA was offered more frequently by FCCHs compared with centers (p < 0.01), while centers more frequently reported the presence of sufficient fixed (p < 0.01) and portable (p = 0.02) play equipment.
Parent Engagement and Wellness Policies
Sites scored an average of 51.8% for practices in comprehensive parent engagement and wellness policies, averaging 65.1% in comprehensive parent engagement and 37.7% in support for wellness policy implementation, monitoring, and feedback (Table 3).
In adjusted models, there were no statistically significant associations of ECE facility type with any index measures or the summary measure for parent engagement and wellness policies (Table 4), although differences were observed in individual practices. Compared with FCCHs, centers reported providing more frequent opportunities for parents to participate in developing or implementing wellness policies and programs (p = 0.02) and more often provided guidance to parents about food and beverages brought for holidays or celebrations (p = 0.049). Centers more frequently reported active wellness committees (p < 0.01), but the existence of a written wellness policy was similar for centers and FCCHs (p = 0.57).
Adjusted Associations of Early Care and Education Facility Type and Best Practice Measures for Dietary Intake, Physical Activity, and Parent Engagement and Wellness Policies
Adjusted associations from generalized linear models with log link quasi-Poisson distribution. Models adjusted for participation in CACFP, part of a larger organization, number of children enrolled, program length, and urbanicity. Models cluster sites by local health department. Significant differences between family child care homes and child care centers are highlighted with an asterisk, p < 0.05.
Summary measures for (1) best practices to improve dietary intake, (2) best practices to improve PA, and (3) parent engagement and wellness policy are the average of the percent of maximum points for all index measures in that category.
Significant differences between family child care homes and child care centers, p < 0.05.
Discussion
This study reveals gaps in the adoption of evidence-based best practices to improve the dietary and PA behaviors of children in ECE settings among a sample of providers serving communities with low income in California. The highest adherence to best practices was reported in quantity of PA offered, followed by quality of food and beverage offered, and environmental support for PA (all > 81%). Lowest adoption of best practices was found in wellness policy implementation, monitoring, and feedback (37.7%), staff training in nutrition (55.1%), and implementation of robust nutrition education for children (55.8%). Some differences were observed between FCCHs and centers, highlighting opportunities to tailor support provided by programs such as CFHL.
This study revealed strengths and opportunities for improvement in both facility types in nutrition-related best practices. FCCHs provided significantly less robust nutrition education, including taste tests, food preparation, and experiments (Fig. 1). There is evidence that experiential approaches such as these can be effective at improving young children’s preferences and consumption of healthy foods, especially when children are engaging in a range of hands-on activities. Barriers that FCCHs have previously described, including limited resources and staff training, may hinder implementation of nutrition education.35,44 This suggests an opportunity to train FCCH providers in evidence-based, participatory nutrition education programs, such as CATCH Early Childhood Program. 45 In this sample, FCCHs provided more frequent nutrition-focused staff training than centers, suggesting that there is an existing infrastructure to build the capacity of FCCH staff to implement nutrition education curricula. Among those surveyed, FCCHs reported serving fruits and vegetables more often than centers. This is consistent with previous research showing that FCCHs were more likely than centers to offer fresh fruit to children daily. 37 Research exploring barriers to providing healthier foods in ECE settings suggests that centers more frequently cite lack of control over foods delivered and limited space for food storage compared with FCCHs. 35
Overall, adherence to PA best practices was strong across both FCCHs and centers, especially for quantity of PA offered, although some differences were observed. FCCHs were less likely than centers to have sufficient fixed (e.g., slides, basketball hoops) and portable (e.g., balls, jump ropes) play equipment. Current evidence suggests a moderate yet positive relationship between the availability of play equipment—particularly portable indoor and outdoor options—and the time children spend engaging in active play and PA.46–48 Our findings are in line with previous research, which found that children in centers had higher outdoor PA levels compared with children in FCCHs and were more likely to have the opportunity to play with portable equipment.34,36 Although home-based providers may have limited space to install fixed play equipment, increasing the availability of portable play equipment could increase PA opportunities for children and can be conducive to both indoor and outdoor activity. CFHL and other partners may support FCCHs in identifying and applying for grants and other funding to purchase portable play equipment. In our study, FCCHs were more likely to offer staff-led PA opportunities, which could similarly be enhanced by incorporating portable play equipment. Furthermore, a qualitative study found that providing training on the importance of PA alongside assuring the safety of PA programs may enhance the quantity of PA provided. 49 Although adherence was relatively high among both provider types, FCCHs were more likely than centers to withhold play as a punishment and have children seated for more than 30 minutes at a time, suggesting opportunities for modifying policies and providing staff training.
Practices related to wellness policies and parent engagement had the greatest room for improvement among ECE providers in our sample. Both centers and FCCHs scored less than 40% of maximum possible points for wellness policy efforts; over a quarter of ECE providers either did not have or were not aware of a written site or organization wellness policy. This finding suggests that providers across facility types would benefit from support to develop and/or implement comprehensive wellness policies. Comprehensive wellness policies have significant potential to reduce best practice disparities across the board, as state regulations may differ by provider type and participation in programs such as CACFP. For example, participation in CACFP, which reimburses providers for meals and snacks that meet nutrition criteria, is associated with provision of more healthful foods and beverages.24,28,32 Wellness policies that establish nutrition standards for non-CACFP participating sites can help ensure that all children have access to healthy foods. Although not a common practice among either facility type, FCCHs were less likely to have active wellness committees focused on child health and wellness. Since FCCHs are typically smaller in size, it is important to note that wellness committees may look different between settings and may not be capturable through the research methodologies used here. FCCHs were also less likely to involve parents in the development or implementation of wellness policies or communicate guidelines for outside foods and beverages. Opportunities for CFHL and partners to support ECE providers include sharing model wellness policies, facilitating staff training on policy implementation and assessment of compliance, and building capacity of sites to engage parents and other stakeholders in wellness committees.
This study’s focus on child care environments serving low-income communities supports interventions and policies to address health inequity starting in childhood. However, findings should be interpreted with caution when considering ECE providers serving families with higher income, as the sample consisted exclusively of sites eligible for SNAP-Ed. In addition, the relatively small sample size limits confidence in interpreting differences between FCCHs and centers, as well as null findings. The self-report survey may have introduced social desirability bias, where ECE providers may have overreported best practices and skipped questions when they felt responses reflected suboptimal practices. However, it is reasonable to assume that any such bias would affect FCCH and center providers similarly. Future research should address these limitations by including a larger sample and mitigating reporting bias.
Implications/Conclusion
Ensuring that all licensed child care settings have access to the resources and support they need to create equitable environments for children from families with low income is key to establishing healthy habits in the vital early years of life. Key differences in adoption of best practices were identified between facility types, highlighting the potential benefits of tailoring interventions based on facility type and leveraging existing strengths between the two. Further research can elucidate the resources needed to ensure that all children have the opportunity to thrive regardless of their child care setting.
Impact Statement
Equitable access to opportunities for healthy eating and PA for children attending licensed child care facilities is vital for fostering healthy habits in early childhood. Both centers and FCCHs need support to implement best practices in nutrition and PA, with further studies required to identify and address their unique needs.
Footnotes
Acknowledgments
The authors express their gratitude to the child care site staff who completed the questionnaires for this study, and the local health department staff who assisted with data collection and management. They thank Evan Talmage, Nicole Vital, and Christina Becker for their essential work on questionnaire development and management of the data used in this project. The authors also extend their appreciation to Lorrene Ritchie and Danielle Lee for their subject matter expertise and the invaluable insights they provided throughout the process.
Authors’ Contributions
M.W.B.: Funding acquisition, conceptualization, methodology, project administration, supervision, writing—review and editing, and writing—original draft. R.V.: Conceptualization, project administration, investigation, methodology, data curation, formal analysis, writing—review and editing, and writing—original draft. C.R.: Conceptualization, project administration, investigation, methodology, data curation, writing—review and editing, and writing—original draft. R.P.: Methodology, data curation, formal analysis, visualization, writing—review and editing, and writing—original draft. J.K.: Methodology, investigation, data curation, writing—review and editing, and writing—original draft. A.L.: Data curation and writing—review and editing. All authors approved the version to be published.
Funding Information
This study was conducted as part of a contract with the California Department of Public Health with funding from the USDA Supplemental Nutrition Assistance Program (SNAP). These institutions are equal opportunity providers and employers. The findings and conclusions in this article are those of the author(s) and do not necessarily represent the views or opinions of the California Department of Public Health or the California Health and Human Services Agency.
Author Disclosure Statement
The authors declare no conflict of interest to disclose.
References
Supplementary Material
Please find the following supplemental material available below.
For Open Access articles published under a Creative Commons License, all supplemental material carries the same license as the article it is associated with.
For non-Open Access articles published, all supplemental material carries a non-exclusive license, and permission requests for re-use of supplemental material or any part of supplemental material shall be sent directly to the copyright owner as specified in the copyright notice associated with the article.