
Abstract
Abstract
Background:
Sixty percent of US children 5 years old and under receive up to two-thirds of their daily nutrition in early care and education (ECE) settings. Although participation in the federal Child and Adult Care Food Program (CACFP) is shown to improve nutrition, little is known about the relationship between procurement practices (where and how child care programs purchase food) and nutrition in ECE settings or whether these practices differ depending on participation in CACFP.
Methods:
We assessed self-reported nutrition practices and procurement practices by CACFP participation using a 2013 cross-sectional survey of 690 Washington ECE centers (“Centers”) and 1260 family homes (family home child care [FHCCs]) serving children aged 2–5 years old using validated survey tools. We examined the relationship between procurement variables (i.e., main store and main mode) and nutrition scores using multinomial logistic regression models that adjusted for sociodemographic and program characteristics.
Results:
In-person shopping was the primary mode of shopping for all programs, regardless of CACFP participation. Some Centers but very few FHCCs reported online shopping as their primary mode. Centers and non-CACFP FHCCs shopped primarily at megastores (Costco, Target, etc.). CACFP FHCCs used both megastores and grocery stores (Albertsons, QFC, etc.) at similar rates. Adjusted multinomial models found that shopping online or at two or more stores was associated with higher nutritional quality of foods served by programs.
Conclusions:
Understanding the procurement behaviors of ECE programs helps to illuminate and prioritize potential interventions that would support healthy food purchases.
Background
Sixty percent of children <5 years of age in the United States are enrolled in one form of early care and education (ECE) or another at least once weekly, and receive up to two-thirds of their daily nutrition in these settings. 1 Early childhood is an important time for establishing healthy eating preferences and standards.2,3 Previous research in young children has illustrated that taste preferences are largely developed and that openness to novel foods is at its peak in this age group.2,3 Prior studies have also found a positive linear relationship between time spent in ECE settings and child risk for overweight and obesity.4,5 Thus, given the extent to which ECE programs are utilized in the United States, they are an important setting for establishing healthy eating preferences and habits.2,3,6–9
Research has illustrated that nutrition practices in these settings are determined by a variety of factors, such as individual-level factors (i.e., perceptions, values, and nutrition knowledge of staff), interpersonal factors (i.e., children' and parents' food preferences and mealtime practices), institutional characteristics (i.e., budgets, kitchen space, and institutional policies), community-level factors (i.e., food environment/availability), and societal factors (i.e., culture, nutrition policies, and licensing requirements).9–11 Within the context of child care, most of the extant research literature focuses on the association between Child and Adult Care Food Program (CACFP) and nutrition.12–15 CACFP is a federal program that is administered by each state, often with additional requirements, which aims to improve the nutritional quality of meals served to children in ECE settings.13,16 Prior research finds CACFP participation to be associated with better nutrition outcomes.12–14
To date, no studies have investigated the relationship between procurement practices and nutrition outcomes within the context of ECE settings. Food procurement refers to where (i.e., source) and how (i.e., mode) child care sites purchase food. 17 Good procurement strategies can support healthy food purchasing and service practices.17,18 Outside the context of child care, research shows how procurement characteristics impact food choices, dietary quality, consumption, and nutritional outcomes.19,20 Aggarwal et al. found that fruit and vegetable consumption was not related to the physical distance of supermarkets, but instead supermarket choice. 21 Another study found that urban supermarkets, which typically carry more nutritious foods, were associated with lower obesity rates, whereas convenience stores were associated with higher obesity rates. 22
Although most studies examine how factors impact food procurement choices at an individual level, there are few studies on how child care programs approach procurement.23–25 A recent qualitative study of ECE programs underlined the complexities of food purchasing behavior in that programs have to balance their own institutional standards and enrollee preferences with national and state-level policies and limited budgets and resources.11,26 Otten et al. indicated that food source was an essential component related to the quality, price, and trustworthiness of food and that purchasing mode was related to time management.11,26 However, the study only interviewed 16 ECE providers and did not provide information about where and how most child care providers shopped for food.
In 2013, the University of Washington Center for Public Health Nutrition administered a statewide census survey to understand the state of nutrition and physical activity practices in licensed Washington State child care programs serving ∼150,000 children aged 2–5 years old. The purpose of this secondary analysis was to characterize child care food procurement practices by licensed ECE centers (“Centers”) and family homes (FHCCs) and CACFP participation and to explore relationships between child care procurement practices and the nutrition practices. These findings can be helpful for identifying whether and how food procurement practices could be used as an intervention point to optimize the balance between most affordable and healthiest foods.
Methods
Overview
The complete methodology of the 2013 Washington Child Care Survey and select results are published elsewhere.27,28 We used the 2013 survey results to initiate a secondary and exploratory analysis. Briefly described below are survey tool development, administration, and measures relevant to this analysis.
Survey Tool Development
Survey design was informed by an advisory group and a literature review of current nutrition and physical activity research and standards that promote healthy child development.29–32 Validated assessment tools were incorporated into the survey or were used to design robust survey questions, including the Nutrition and Physical Activity Self-Assessment for Child Care, Rudd Center's Child Care Nutrition and Physical Activity Assessment Survey, Oregon Public Health Institute's Right from the Start, and UC Berkeley's CA Survey of Child Care Providers of 2–5-Year Old Children.33–36
The 2013 statewide survey included a total of 153 questions from 12 topic areas: (1) program characteristics, (2) respondent characteristics, (3) foods and beverages provided, (4) meal and snack time environment, (5) procurement characteristics, (6) time for physical activity, (7) physical activity environment, (8) screen time, (9) challenge attitudes and beliefs, (10) provider training, (11) program policies, and (12) communication with families.27,28 Our secondary analysis focuses on 48 of these questions from the following topic areas relevant to our study aims: (1) program characteristics, (2) respondent characteristics, (3) foods and beverages provided, (4) meal and snack time environment, and (5) procurement characteristics. Each of these is described in the sections below on Respondent Characteristics, Child Care Programs Characteristics, Procurement Characteristics, and Nutrition Best Practices.
Survey Administration
The Washington Department of Early Learning provided a complete list of all licensed programs, which served as the sampling frame. The survey was administered from October to December 2013 using Dillman's Tailored Design Method for Internet and mail surveys. 37 ECE sites with valid e-mail addresses received the online survey, and sites without e-mail addresses were mailed paper surveys. The University of Washington Institutional Research Board determined that the study survey procedures and analysis were exempt.
Respondent Characteristics
The survey collected participants' race/ethnicity, education, and number of years employed in ECE. For the analysis, race and ethnicity were combined into four categories: non-Hispanic whites, non-Hispanic blacks, Hispanics, and other race. Education was coded into four categories: less than high school (HS), HS graduate, some college, and greater than an associate degree. Number of years employed categories were 0–5, 6–10, 11–20, and >20 years.
Child Care Programs Characteristics
The survey asked respondents about the type of child care (Centers vs. FHCCs), CACFP status (enrolled or not enrolled), program length (half-day, full-day, or both), and Head Start and Early Achievers (Washington's Quality Rating and Improvement System for ECE facilities) participation.
Procurement Characteristics
Survey respondents were asked about their main mode of shopping (in-person, online, and over the phone) and their main shopping store. For the main mode of shopping, respondents were asked how they primarily obtained the program's food. For the main shopping store question, respondents could select from an extensive list of grocery stores, markets, and shops; food service distributors; and caterers; or write-in an option. Answers to main shopping store were recoded into six categories: no main store, megastores (e.g., Costco and Sam's Wholesale Club), food service distributors, other stores, grocery stores, and more than two stores.
Nutrition Best Practices
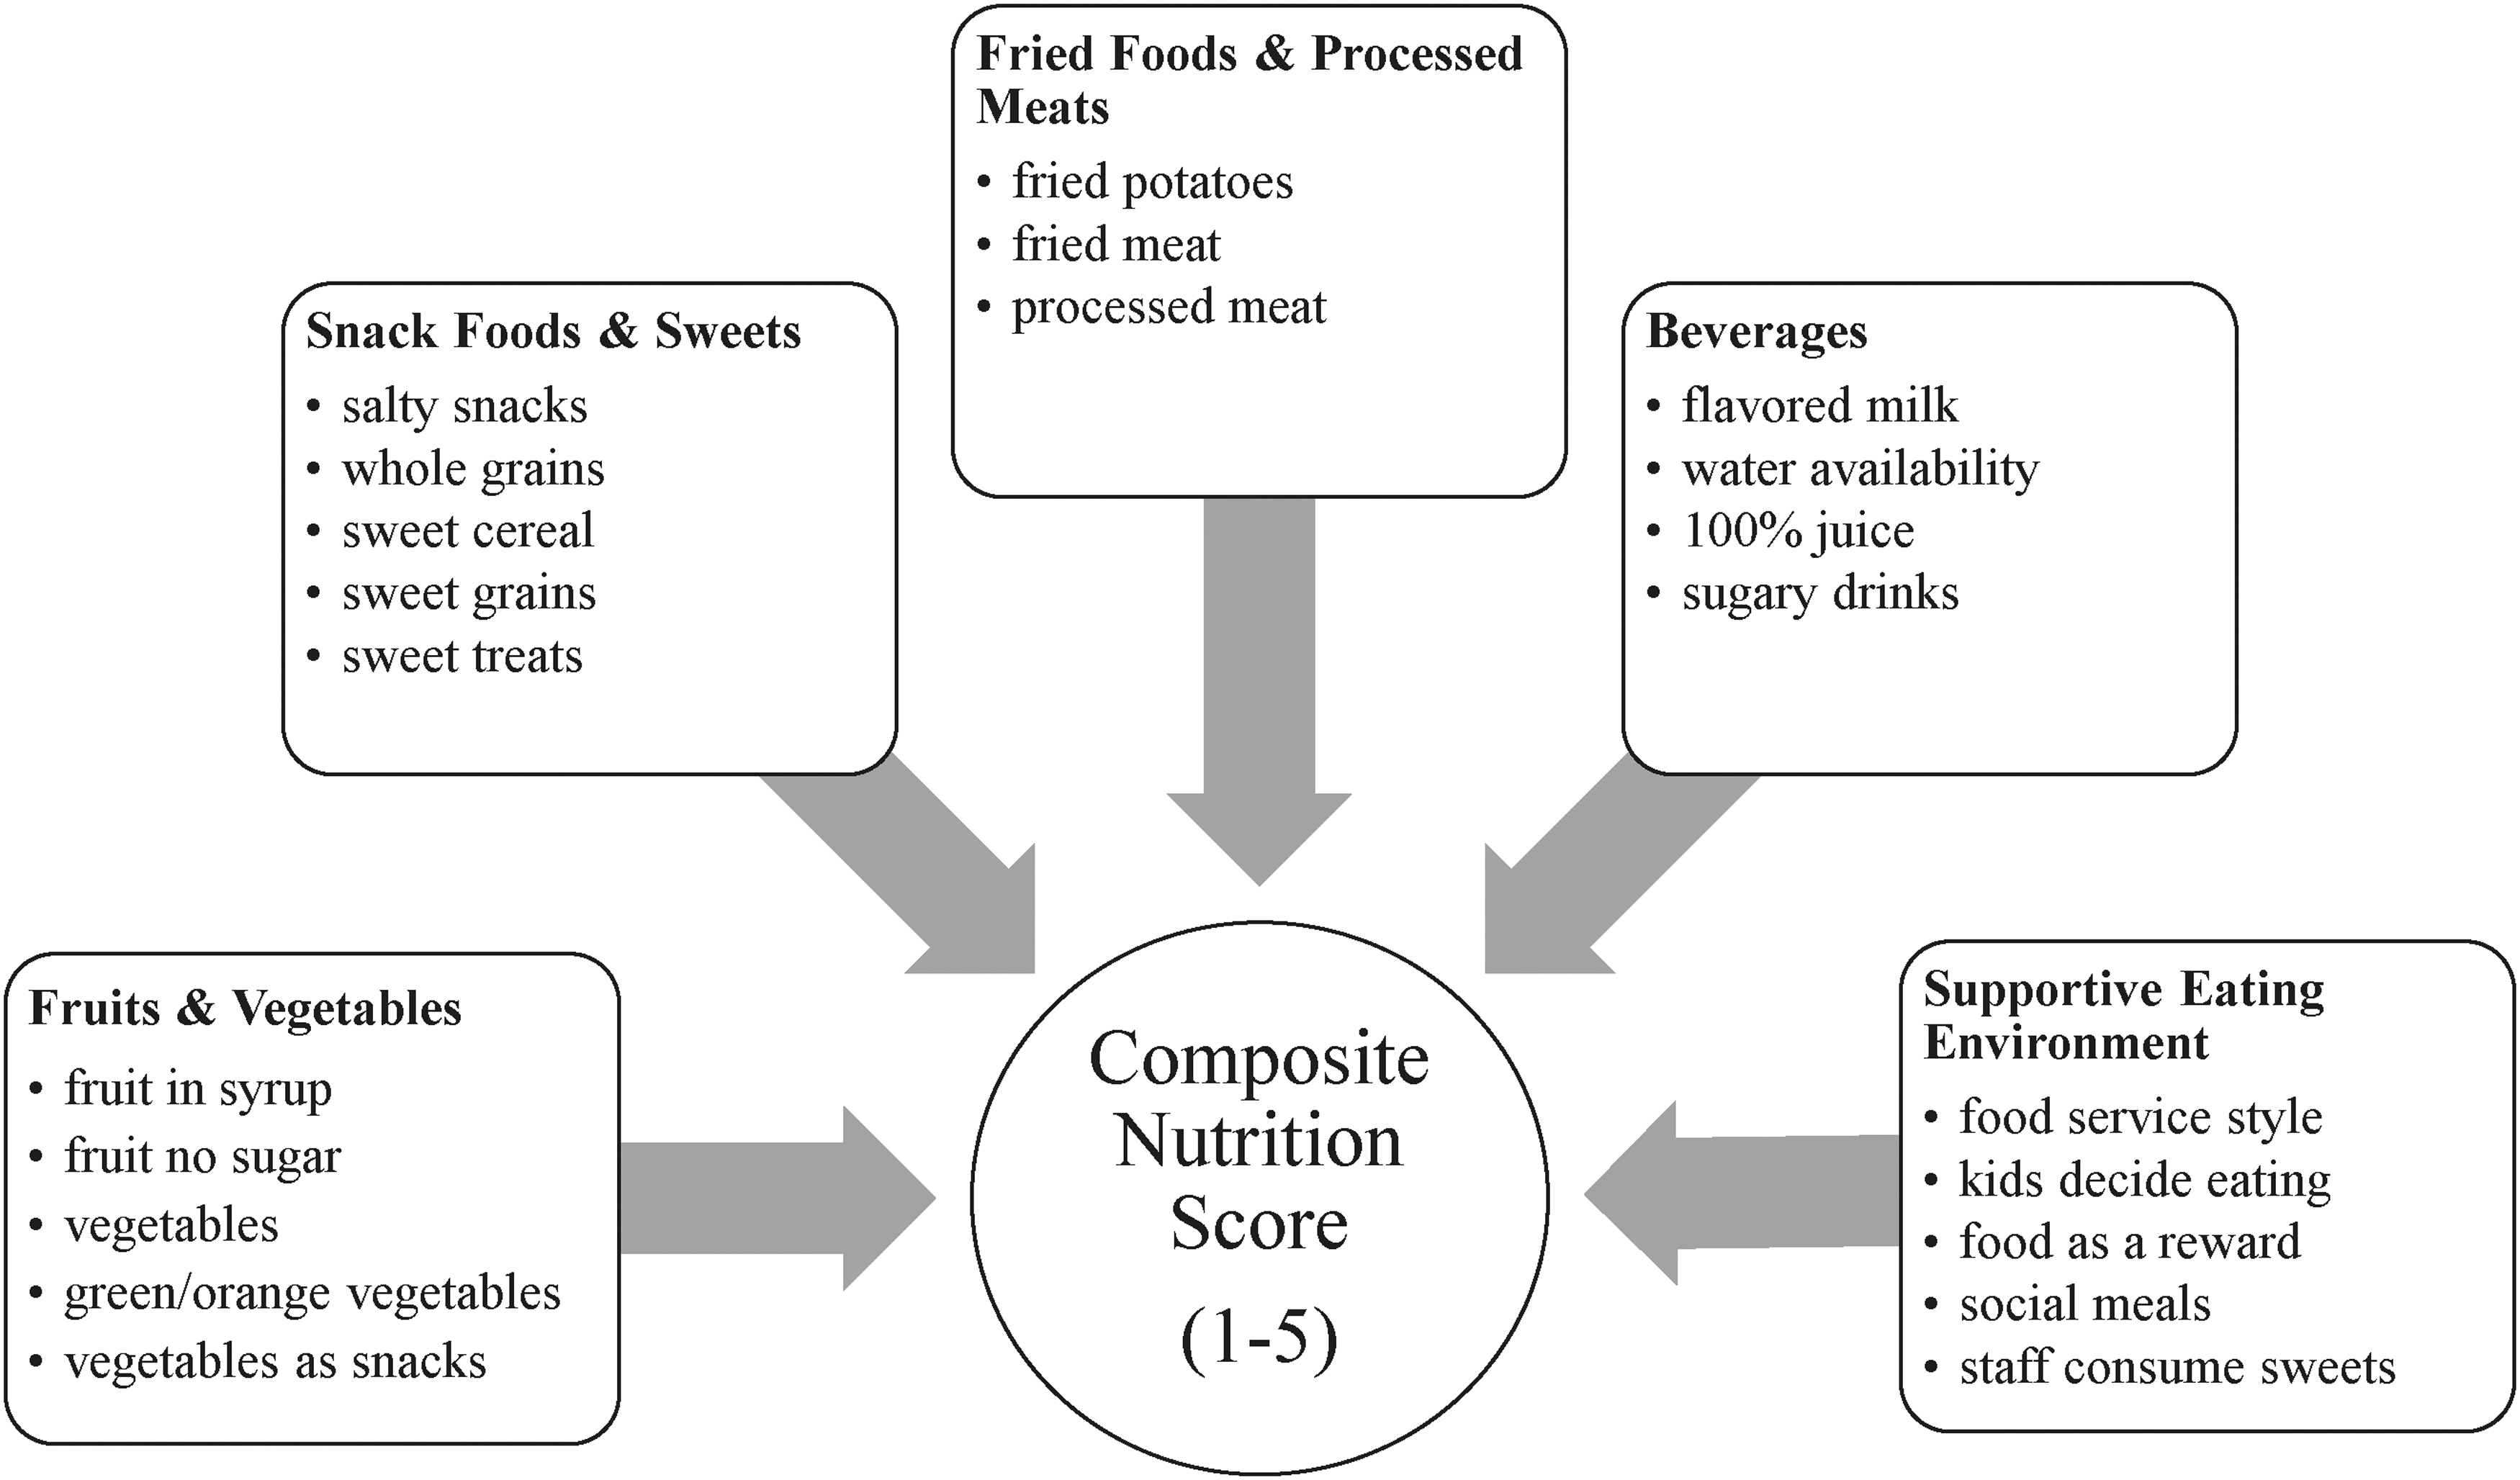
Respondents were asked how many times they served different types of specific foods and beverages to children ages 2–5 years old, and what their meal and snack time environments were like. For example, “How often does your Center offer fruit canned in syrup (heavy or lite syrup),” “What type of milk is offered to children of ages 2 years and older,” and “Are children allowed to decide how much or how little food they will eat?” These questions were categorized into five content areas [(i.e., fruits and vegetables (n = 5), whole grains, snack foods, and sweets (n = 5), fried foods and processed meat (n = 3), beverages (n = 4), and supporting healthy eating (n = 5)]. Each content area had four to five response choices scored on a scale of 1–5, with 5 corresponding to a national best-practice child care standard, and hence the highest score attainable.
Some of the responses to the nutrition questions were reverse coded, to reflect nutrition best practices. Scores for each content area were then averaged and summarized into a composite nutrition score, as shown in Figure 1. We then categorized our composite nutrition scores into tertiles—high, medium, and low composite nutrition score categories.
Statistical Analysis
To compare Centers and FHCCs, chi-square tests were used to test for difference in response distributions for categorical responses and two-sample t-tests were used to test for mean differences in the continuous responses. Linear regressions were used to examine the bivariate associations of composite nutrition scores with key sociodemographic, program, and procurement characteristics. A series of multinomial logistic regression models explored the relationship between each procurement variable (i.e., main store and main mode) and the composite nutrition score tertile categories. The reference groups in all the models were the groups that had the largest proportion of responses.
Results
Out of 5540 programs invited, 36% or 1973 WA Centers and FHCCs took the survey (Center and FHCC response rates were 46% and 32%, respectively). These analyses were limited to the 1950 programs (690 Centers, 1260 FHCCs) that cared for children aged 2–5 years. Table 1 shows the descriptive characteristics of the survey respondents. Responders for the Centers relative to FHCCs tended to have a higher proportion of whites and had higher education levels.
Demographic Characteristics of the 2013 Washington State Survey of Nutrition and Physical Activity in Child Care Survey Respondents
Only includes programs that reported to care for children of ages 2–5 years.
Column totals do not sum up because missing data (unreadable, no response, and “I don't know” responses) were excluded.
Separate questions were asked of Centers and FHCCs.
FHCC, family home child care; HS, high school.
Table 2 shows the program characteristics. As shown in Table 3, a majority of Centers and all FHCCs prefer an in-person food shopping mode for purchases, regardless of CACFP participation. Some Centers and only three FHCCs reported using online resources as their primary mode. Relatively few Centers and no FHCCs reported using the phone as their primary mode.
Program Characteristics of the 2013 Washington State Survey of Nutrition and Physical Activity in Child Care Survey Respondents
Only includes programs that reported to care for children of ages 2–5 years.
Column totals do not sum up because missing data (unreadable, no response, and “I don't know” responses) were excluded.
Comparisons of study groups made with Pearson's chi-squared test (χ2). p Values <0.05 were considered significant.
These questions were only applicable to Centers.
Washington's Quality Rating and Improvement System for early care and education facilities.
Included respondents who had participated in CACFP in the past but not currently participating and those who had never participated in CACFP.
CACFP, Child and Adult Care Food Program; DSHS, Department of Social and Health Services.
Main Mode of Shopping for Washington Child Care Programs by Child Care Type a
Only includes Centers and FHCCs that serve or cater at least one meal or snack to children of ages 2–5 years.
Column totals do not sum up because missing data (unreadable, no response, “I don't know,” and “not applicable” responses) were excluded.
Comparisons of study groups made with Pearson's chi-squared test (χ2). p Values <0.05 were considered significant.
Table 4 illustrates where Centers and FHCCs primarily shop. CACFP and non-CACFP Centers and non-CACFP FHCCs primarily shop at megastores, whereas CACFP FHCCs use megastores and grocery stores at similar rates.
Main Stores Where Washington Child Care Programs Purchase Food by Type of Child Care
Only includes Centers and FHCCs that serve or cater at least one meal or snack to children of ages 2–5 years.
Column totals do not sum up to total because missing data (unreadable, no response, and “I don't know” responses) were excluded.
Comparisons of study groups made with Pearson's chi-squared test (χ2). p Values <0.05 were considered significant.
Megastores indicate Costco, Target, Walmart, and Sam's Club.
Food service distributors indicate Sysco, FSA, FSI, US Foods, URM, Amazon Fresh, UNFI, Charlie's Produce, and NW Deli.
Other indicate organic, commissary, vendors, and farmers markets.
Grocery stores indicate Albertsons, QFC, Safeway, Trader Joes, WinCo, co-ops, etc.
Table 5 shows overall composite nutrition scores and nutrition scores by content area. CACFP sites had significantly higher overall composite nutrition scores and beverage scores and performed better in supporting healthy eating as compared with non-CACFP sites (p < 0.001, p < 0.001, p < 0.05, respectively). Nutrition scores for fruits and vegetables were not significantly different between Centers and FHCCs, regardless of CACFP participation (p = 0.810). Non-CACFP Centers and FHCCs had substantially higher nutrition scores for fried foods and processed meats than their CACFP counterparts (p < 0.001).
Nutrition Scores by Content Area and Composite Nutrition Score by Child Care Type and Child and Adult Care Food Program Status
Only includes Centers and FHCCs that serve or cater at least one meal or snack to children of ages 2–5 years.
Table excludes respondents who did not respond to CACFP participation. Two percent (n = 42) FHCCs and Centers responded “I don't know” and 0.3% (n = 6) FHCCs and Centers had unreadable responses to CACFP participation.
Comparison of study groups done using independent sample t-test and analysis of variance. p Values <0.05 were considered significant.
Table 6 reports the bivariate associations between composite nutrition scores and key sociodemographic, program characteristic, and procurement variables. There was a significant association between composite nutrition scores and key sociodemographics (i.e., race/ethnicity, education, and years employed), child care program characteristics (i.e., child care type and CACFP enrollment), and procurement characteristics (i.e., main store for shopping and main mode of shopping). The composite nutrition score was significantly higher for Centers than for FHCCs (p < 0.001), for CACFP sites than for non-CACFP sites (p < 0.001), and for sites shopping online than for in-person shopping mode (p < 0.001).
Bivariate Association of Composite Nutrition Scores and Key Sociodemographic Variables and Procurement Characteristics Among Child Care Centers and FHCCs
Other race includes Asians, Pacific Islanders, American Indians, unique races, and mixed races.
Megastores indicate Costco, Target, Walmart, and Sam's Club.
Food service distributors indicate Sysco, FSA, FSI, US Foods, URM, Amazon Fresh, UNFI, etc.
Other stores indicate organic, commissary, vendors, and farmers markets.
Grocery stores indicate Albertsons, QFC, Safeway, Trader Joes, WinCo, co-ops, etc.
SE, standard error.
Table 7 shows the multinomial logistic analyses comparing the high and low composite nutrition score category tertiles (i.e., the dependent variable) with procurement variables (i.e., main store and main mode, and the primary independent variables). In Model 1 (adjusted for race/ethnicity, education, and years employed), shopping at food service distributors and shopping at two or more main stores compared with megastores were more likely to result in high composite nutrition scores (p < 0.05). In Model 2 (adjusted for race/ethnicity, education, years employed, and type of child care) and Model 3 (adjusted for race/ethnicity, education, years employed, type of child care, and CACFP participation), shopping at two or more main stores compared with megastores was more likely to result in high composite nutrition scores (p < 0.05). All three models showed that online shopping compared with in-person shopping was significantly more likely to result in high composite nutrition scores.
Odds Ratios from Multinomial Logistic Regression Models Predicting Likelihood of Composite Nutrition Score Category as a Function of Procurement Characteristics (Main Store for Shopping and Main Shopping Mode) after Adjusting for Select Covariates
Megastores indicate Costco, Target, Walmart, and Sam's Club.
Food service distributors indicate Sysco, FSA, FSI, US Foods, URM, Amazon Fresh, UNFI, etc.
Other stores indicate organic, commissary, vendors, farmers markets.
Grocery stores indicate Albertsons, QFC, Safeway, Trader Joes, WinCo, co-ops, etc.
All models compared the high composite nutrition score category with the low nutrition score category (base). Model 1: Adjusted for race/ethnicity, education, and years employed. Model 2: Adjusted for race/ethnicity, education, years employed, and type of child care. Model 3: Adjusted for race/ethnicity, education, years employed, type of child care, and CACFP enrollment.
CI, confidence interval.
Discussion
To our knowledge, this study is the first to look at child care food procurement practices and the relationship between procurement practices and the nutritional quality of foods served to children in ECE settings. We found that the majority of Centers and FHCCs prefer in-person shopping over phone or online shopping and that most ECE programs shop primarily at megastores followed by grocery stores.
Using bivariate analyses, we found that provider sociodemographics (i.e., race/ethnicity, education, and years of ECE employment) and CACFP participation are associated with the nutritional quality of foods in child care programs. Using multinomial analyses adjusted for select covariates, all three models found a significant association between shopping at two or more stores and higher nutritional quality of foods offered in child care programs in this sample and between online shopping and higher nutritional quality as compared with shopping at megastores or shopping in-person, respectively.
These findings are important because they illustrate that the majority of ECE programs purchase food in-person at megastores and grocery stores rather than through phone or online or using other venue types, such as food service distributors. At the same time, shopping online or at two or more stores was associated with higher nutrition scores. Thus, policies and programs that are being designed to reach ECE sites with messages or behavioral interventions targeted at healthy food purchasing patterns may want to explore the reasons why shopping at two or more stores or online might be associated with healthier food purchasing patterns, and, if considering the greatest reach, consider in-person interventions with retailers at megastores and grocery stores.
Our finding that the vast majority of programs prefer in-person shopping is consistent with a 2015 National Bureau of Economic Research (NBER) working article, which found that the proliferation of online retailers in the marketplace had not decreased the traditional in-person shopping mode for food and beverages. 38 The study authors concluded that physical in-person shopping for food and beverages is likely to stay the norm for the next couple of years, if not decades. 38 A small qualitative study on the food purchasing habits of ECE programs found that most programs were doubtful of purchasing food online.11,26 ECE interviewees explained the challenges of online ordering: they did not trust the food quality of products, they found that determining whether products or product substitutions met food standards or legal requirements was difficult, and they often found that the minimum requirements for online purchasing and delivery were prohibitive, especially in the face of limited on-site storage space. 26
Our finding that ECE programs use megastores most, followed by grocery stores, regardless of CACFP participation, is not surprising. Megastores are typically larger and carry a wider variety of food and nonfood products than supermarkets or grocery stores.39,40 Prices at megastores also average 7% lower than grocery stores. 39 Grocery stores were also frequently used by respondents and this may be because they offer more than three times the assortment within product categories than megastores or because many ECE sites throughout Washington State are not located in proximity to a megastore.39,41 In this study, we found that food service distributors were less commonly used. One challenge with procuring food through food service distributors is the issue of minimum orders, which can range from $100 per order for small distributors to $750 per order for large distributors. 42 A food service distributor model for ECE settings may work if ECE sites serve at least 20 meals/day, excluding snacks, in addition to having storage space. 42
The bivariate associations presented in these analyses found that staff members who have worked in ECE settings longer and have higher levels of education were associated with higher nutrition scores. Our sample of FHCC providers had lower education levels than Center providers, and this may be because the Washington Administrative Code (WAC) requires different levels of education for Center directors and FHCC providers. Although Center directors are required to have at least some college-level education in the area of early childhood and development, FHCC providers must have at minimum a HS diploma or equivalent education.43,44 Although research generally supports that well-educated professionals promote high-quality ECE settings, the relationship between education and nutrition quality is complex, and prior studies have been inconsistent with how education is gauged.45,46 In addition, this relationship is not necessarily linear due to potential confounders and mediators such as race, class, gender, age, educational opportunity, and workplace experiences.45,46
Similar to many other studies, this study found that CACFP enrollment was positively associated with the quality of nutrition in child care.12–14 In this study, CACFP sites had higher nutrition scores for beverages and for environments that support healthy eating, both for Centers and for FHCCs. Nationally, CACFP serves 3.3 million children every day, and participating sites must comply with specific meal patterns to be eligible. 47 Prior literature shows that CACFP participation is positively associated with the consumption of milk and vegetables, as well as lower BMI, particularly among low-income children. 12 We found that CACFP enrollment was <70%, both for Centers and FHCCs, indicating that there may be room for including more sites in the program.
Because CACFP has been so positively related to nutrition in ECE settings, one way to improve nutrition at the point of food purchase might be through the use of labels or signage that indicate foods and beverages meet CACFP standards at locations where and how child care caregivers shop the most, such as in-person at megastores and grocery stores. Customers desire support (i.e., shelf labels identifying healthy products, in-store product sampling or tasting, healthy meal ideas and recipes, etc.) in purchasing healthy products, and front of package and simple shelf-labeling systems have been shown to be beneficial in supporting healthy food purchases.48,49 However, there are currently no labels at the point-of-purchase that are child care-specific to nutrition.
One label that exists for child nutrition (CN) programs, in general, is the CN labeling, which is run by the federal USDA Food and Nutrition Service in collaboration with commercial food processing firms. 50 This label only identifies the quantifiable contribution of a product toward meal pattern requirements, using yields from USDA's Food Buying Guide for Child Nutrition Programs, and does not indicate nutritional value.50,51 Moreover, ECE programs are not federally mandated to purchase CN foods. Instead, purchasing decisions are locally determined. 50 There may be an opportunity here for public agencies to collaborate with megastores and grocery stores to develop child care-specific nutrition labels for foods that meet best practice standards to ease purchasing decisions.
Finally, our findings suggest that food procurement characteristics may be related to the nutritional quality of foods offered to children in ECE. Future studies should explore whether these relationships are consistent across other ECE samples and why online shopping or shopping at two or more main stores was associated with higher nutritional quality. This study has several limitations. A major limitation is that our analysis is a secondary analysis of existing survey data. Although the original survey aimed to better understand the nutrition, physical activity and screen time practices, and environments of WA's licensed ECE settings, we were more interested in understanding the relationship between procurement practices and nutrition in ECE settings. Although our specific aim was not the primary focus in the original survey, the advisory group for the original survey did suggest using the collected data to examine the association between food practices and shopping locations and was intentional about including procurement-type questions for this type of secondary analysis. Future research with these relationships as primary aim may be able to add more and more robust questions on food procurement, such as how nutrition-related cues are used at the point-of-selection, and/or obtain actual receipt or purchase data by stores for more granularity. Second, the cross-sectional study design limits our ability to understand these relationships over time. Third, the survey had a 36% response rate. Other survey studies report 35%–45% response rates, suggesting that this response rate is within the common range.52–55 However, there may be selection or response bias associated with those who responded since respondents who choose to answer surveys may differ from those who do not and because respondents might have wanted to portray their child care programs positively. Although survey respondents were guaranteed confidentiality, fear of consequences related to their child care licenses may have also resulted in response bias. Fourth, we were unable to incorporate food cost into the analyses and this variable may have altered our findings. Although respondents were asked to indicate how much money the program spent on food, most responses were implausible. This could have been due to poor wording and/or understanding of the question. Future surveys should pretest cost questions to obtain information about food costs accurately. Fifth, given the multiple analyses done on this data set, there is possibility of multiple inferences, wherein some of the statistically significant findings may have occurred by chance. In addition, given the design of the total nutrition score, the practical significance of some of the statistically significant findings in our analyses with regard to informing practices or policies is unknown. Finally, our ability to generalize the results of this survey to other states may be limited since ECE regulations and licensing vary from state to state. Despite these limitations, this exploratory secondary analysis is informative because it illustrates where and how a majority of child care providers and caregivers procure their foods, possibly informing the design of interventions that might be aimed at supporting healthy ECE food purchases.
Conclusion
By identifying the food procurement practices (i.e., how and where programs shop) of ECE programs, we illuminate potential points of policy or program intervention to support healthy food purchases. We found that ECE programs primarily shop at megastores followed by grocery stores and prefer in-person shopping, although some ECE Centers indicated a preference for online shopping. ECE food procurement practices were related to the nutritional quality of foods served by ECE programs with shopping at two or more stores or online shopping being consistently associated with higher nutrition scores than shopping at megastores or in-person.
Since policy and program interventions often have limited funding and are often targeted at reaching the greatest number possible, this study suggests that interventions to increase healthy food purchases may be best delivered using in-person strategies, such as using ECE-specific labeling systems at megastores and grocery stores, followed by online interventions. Future studies should also explore the reasons why shopping online or at two or more stores was associated with higher nutrition scores.
Footnotes
Acknowledgment
Financial support and grants: Original data were collected with a grant support from the Washington State Department of Health and Public Health—Seattle & King County.