
Abstract
Somatic cell reprogramming was first developed to create induced pluripotent stem (iPS) cells. Since that time, the highly dynamic and heterogeneous nature of the reprogramming process has come to be appreciated. Remarkably, a distinct type of stem cell, called induced extraembryonic endoderm (iXEN) stem cell, is also formed during reprogramming of mouse somatic cells by ectopic expression of the transcription factors, OCT4, SOX2, KLF4, and MYC (OSKM). The mechanisms leading somatic cells to adopt differing stem cell fates are challenging to resolve given that formation of either stem cell type is slow, stochastic, and rare. For these reasons, fluorescent gene expression reporters have provided an invaluable tool for revealing the path from the somatic state to pluripotency. However, no such reporters have been established for comparable studies of iXEN cell formation. In this study, we examined the expression of multiple fluorescent reporters, including Nanog, Oct4, and the endodermal genes, Gata4 and Gata6—alone and in combination, during reprogramming. We show that only simultaneous evaluation of Nanog and Gata4 reliably distinguishes iPS and iXEN cell colonies during reprogramming.
Introduction
Since the initial report that somatic cells can be reprogrammed to induced pluripotent stem (iPS) cells (Takahashi and Yamanaka, 2006), much interest has focused on how to distinguish iPS cell colonies from undesirable colonies, such as partially reprogrammed cell colonies (Buganim et al, 2012; Chan et al, 2009; Mikkelsen et al, 2008; Sridharan et al, 2009; Velychko et al, 2019).
We and others have reported that cells expressing endodermal genes arise during reprogramming of mouse and human somatic cells (Guan et al, 2022; He et al, 2020; Parenti et al, 2016; Schiebinger et al, 2019; Zhao et al, 2015). Moreover, viral transduction of genes encoding pluripotency transcription factors, Oct4, Sox2, Klf4, and Myc (OSKM), leads to formation of stable induced extraembryonic endoderm (iXEN) stem cell lines in murine and canine fibroblasts (Nishimura et al, 2017; Parenti et al, 2016).
Unlike partially reprogrammed cells, iXEN cells are capable of unlimited proliferation and lineage-specific differentiation and therefore meet both criteria of authentic stem cell lines. However, little is known regarding the mechanisms that guide alternative reprogramming outcomes, nor how to distinguish iPS cells and iXEN cells during the reprogramming process.
Fluorescent reporters, such as knock-in reporters of endogenous Oct4 or Nanog expression, are commonly used for quantifying reprogramming efficiency (Brambrink et al, 2008; Buganim et al, 2012; Dos Santos et al, 2014; Huangfu et al, 2008; Judson et al, 2009; Pour et al, 2015; Shi et al, 2008; Tsubooka et al, 2009; Xiao et al, 2016; Zhao et al, 2009). In this application, the number or proportion of fluorescent colonies is often reported. However, the expression of these reporters has not been evaluated in the context of iXEN cells.
This seems important especially given that Oct4 is associated with both pluripotent and extraembryonic endodermal lineages during embryogenesis (Frum et al, 2013; Le Bin et al, 2014; Palmieri et al, 1994) and is a component of the transcription factor cocktails that produce iXEN cells (Nishimura et al, 2017; Parenti et al, 2016). Conversely, a fluorescent reporter that specifically labels iXEN cell colonies during reprogramming has not been identified.
The identification of fluorescent reporters to reliably distinguish iPS and iXEN cell colonies would enable new approaches to the discovery of mechanisms underlying the reprogramming process. Identification of specific fluorescent reporters requires a more systematic evaluation of the expression and coexpression of pluripotency and endodermal gene expression reporters over the course of somatic cell reprogramming.
We therefore evaluated the expression dynamics of fluorescent reporters of the transcription factors important for pluripotency (OCT4 and NANOG) and extraembryonic endoderm (XEN) (GATA6 and GATA4), in conjunction with colony morphology, during mouse somatic cell reprogramming. We chose to focus on these transcription factors because they are all involved in the earliest stages of segregating pluripotent and endodermal cell fates during development (Artus and Hadjantonakis, 2012; Bassalert et al, 2018; Frum and Ralston, 2015).
Materials and Methods
Mouse lines
All animal research procedures were conducted in accordance with the guidelines of the Michigan State University Institutional Animal Care and Use Committee. The following alleles were maintained in a CD-1 background: Gata4H2B-eGFP (Simon et al, 2018), Gata6tm1Hadj (Freyer et al, 2015), Pou5f1tm2Jae (Lengner et al, 2007), and NanogmCherry (reported here).
The NanogmCherry mouse was created through a CRISPR/Cas9-mediated knock-in of mCherry immediately downstream of, and in frame with, the Nanog coding region using a published donor plasmid (Addgene 59995) (Yang et al, 2013). The CAS9 protein and guide RNA (5′-CGTAAGTCTCATATTTCACC-3′) (50–200 ng/μL) and circular donor plasmid (5–20 ng/μL) were injected into C57Bl/6 zygotes, which were then transferred to pseudopregnant female mice.
Offspring were then screened by Nanog locus-specific polymerase chain reaction (PCR) (5′-TACCACCATGCCAGGCTGAGAATGT-3′ and 5′-TCAACAGGGAGAAGTTAGTGGCGCT-3′). Using this approach, a 2105 bp PCR product can only be generated if homologous recombination has occurred between the donor plasmid's upstream homology arm and the Nanog locus, and 9 of 22 offspring were positive using this criterion for an overall knock-in efficiency of ∼40%. The Nanog locus of a single founder mouse was confirmed by sequencing. The NanogmCherry mouse line was maintained in a CD-1 background.
Immunofluorescence and confocal microscopy
Mice carrying NanogmCherry were naturally mated and then embryos were obtained from pregnant moms around embryonic day (E) E3.75. Embryos were then processed for immunofluorescence, as previously described (O'Hagan et al, 2021), using the following reagents: goat-anti-SOX17 (1:2000; R&D; AF1924), goat-anti-SOX2 (1:2000; Neuromics; GT15098), donkey-anti-goat Alexa488 (1:400; Invitrogen; A-11055), and DRAQ5 (1:400; Cell Signaling Technology; 4084).
Embryos were imaged using an Olympus FluoView FV1000 Confocal Laser Scanning Microscope system with a 20 × UPlanFLN objective (0.5 NA) and 3 × digital zoom. For each embryo, z-stacks were collected with 5-μm intervals between optical sections. Optical sections are displayed as an intensity projection over the z-axis.
Cell lines and cellular reprogramming
R1 embryonic stem (ES) cell lines (ATCC; SCRC-1011) and XEN cell lines (derived in-house from CD-1 blastocysts) were cultured in the presence of mouse embryonic fibroblasts (MEFs) and leukemia inhibitory factor, as previously described (Blij et al, 2015; Parenti et al, 2016) (Moauro and Ralston, 2022). To derive MEF lines, mice carrying one or more fluorescent reporter alleles were naturally mated and then embryos were collected from pregnant females at E13.5.
MEF lines were established and genotyped from individual E13.5 embryos, as previously described (Moauro and Ralston, 2022). Cellular reprogramming was achieved using the modified Moloney murine leukemia virus retrovirus, as previously described (Moauro and Ralston, 2022). pMX plasmids expressing Oct4, Klf4, Sox2, or Myc cDNAs were obtained from Addgene (13366, 13367, 13370, and 13375).
Throughout reprogramming, expression of fluorescent markers was detected using a Lumen Prior 200 camera and Leica microscope. Our reprogramming efficiency ranged from 0.44% to 0.63% ± 0.025% (total colonies per MEFs plated).
The Nanog-mCherry knock-in ES cell line was generated by electroporation of ES cells with a plasmid carrying Nanog-2A-mCherry (Addgene; p59995) and pSpCas9(BB)-2A-Puro (Addgene; pX459), which was modified to carry the Nanog guide RNA and then cultured in the presence of 1.25 μg/mL puromycin (Gibco; A1113803). Fluorescent colonies were isolated, expanded, and then PCR screened, as described above.
RNA isolation and quantitative PCR
RNA was harvested using 1:6 chloroform to TRIzol (Invitrogen) and then 1 μg RNA was reverse transcribed to create cDNA using the QuantiTect Reverse Transcription Kit (Qiagen), following manufacturer instructions. For quantitative PCR (qPCR), cDNA was amplified in quadruplicate using transcript-specific primers (Table 1) and quantified on LightCycler 480 (Roche).
Quantitative Polymerase Chain Reaction Primers for Detecting Endogenous Transcripts
Genotyping Primers
Primer amplification efficiency was determined empirically by generating a standard curve using XEN cells and ES cell cDNA libraries.
Results
The making of a Nanog-2A-mCherry fluorescent reporter mouse line
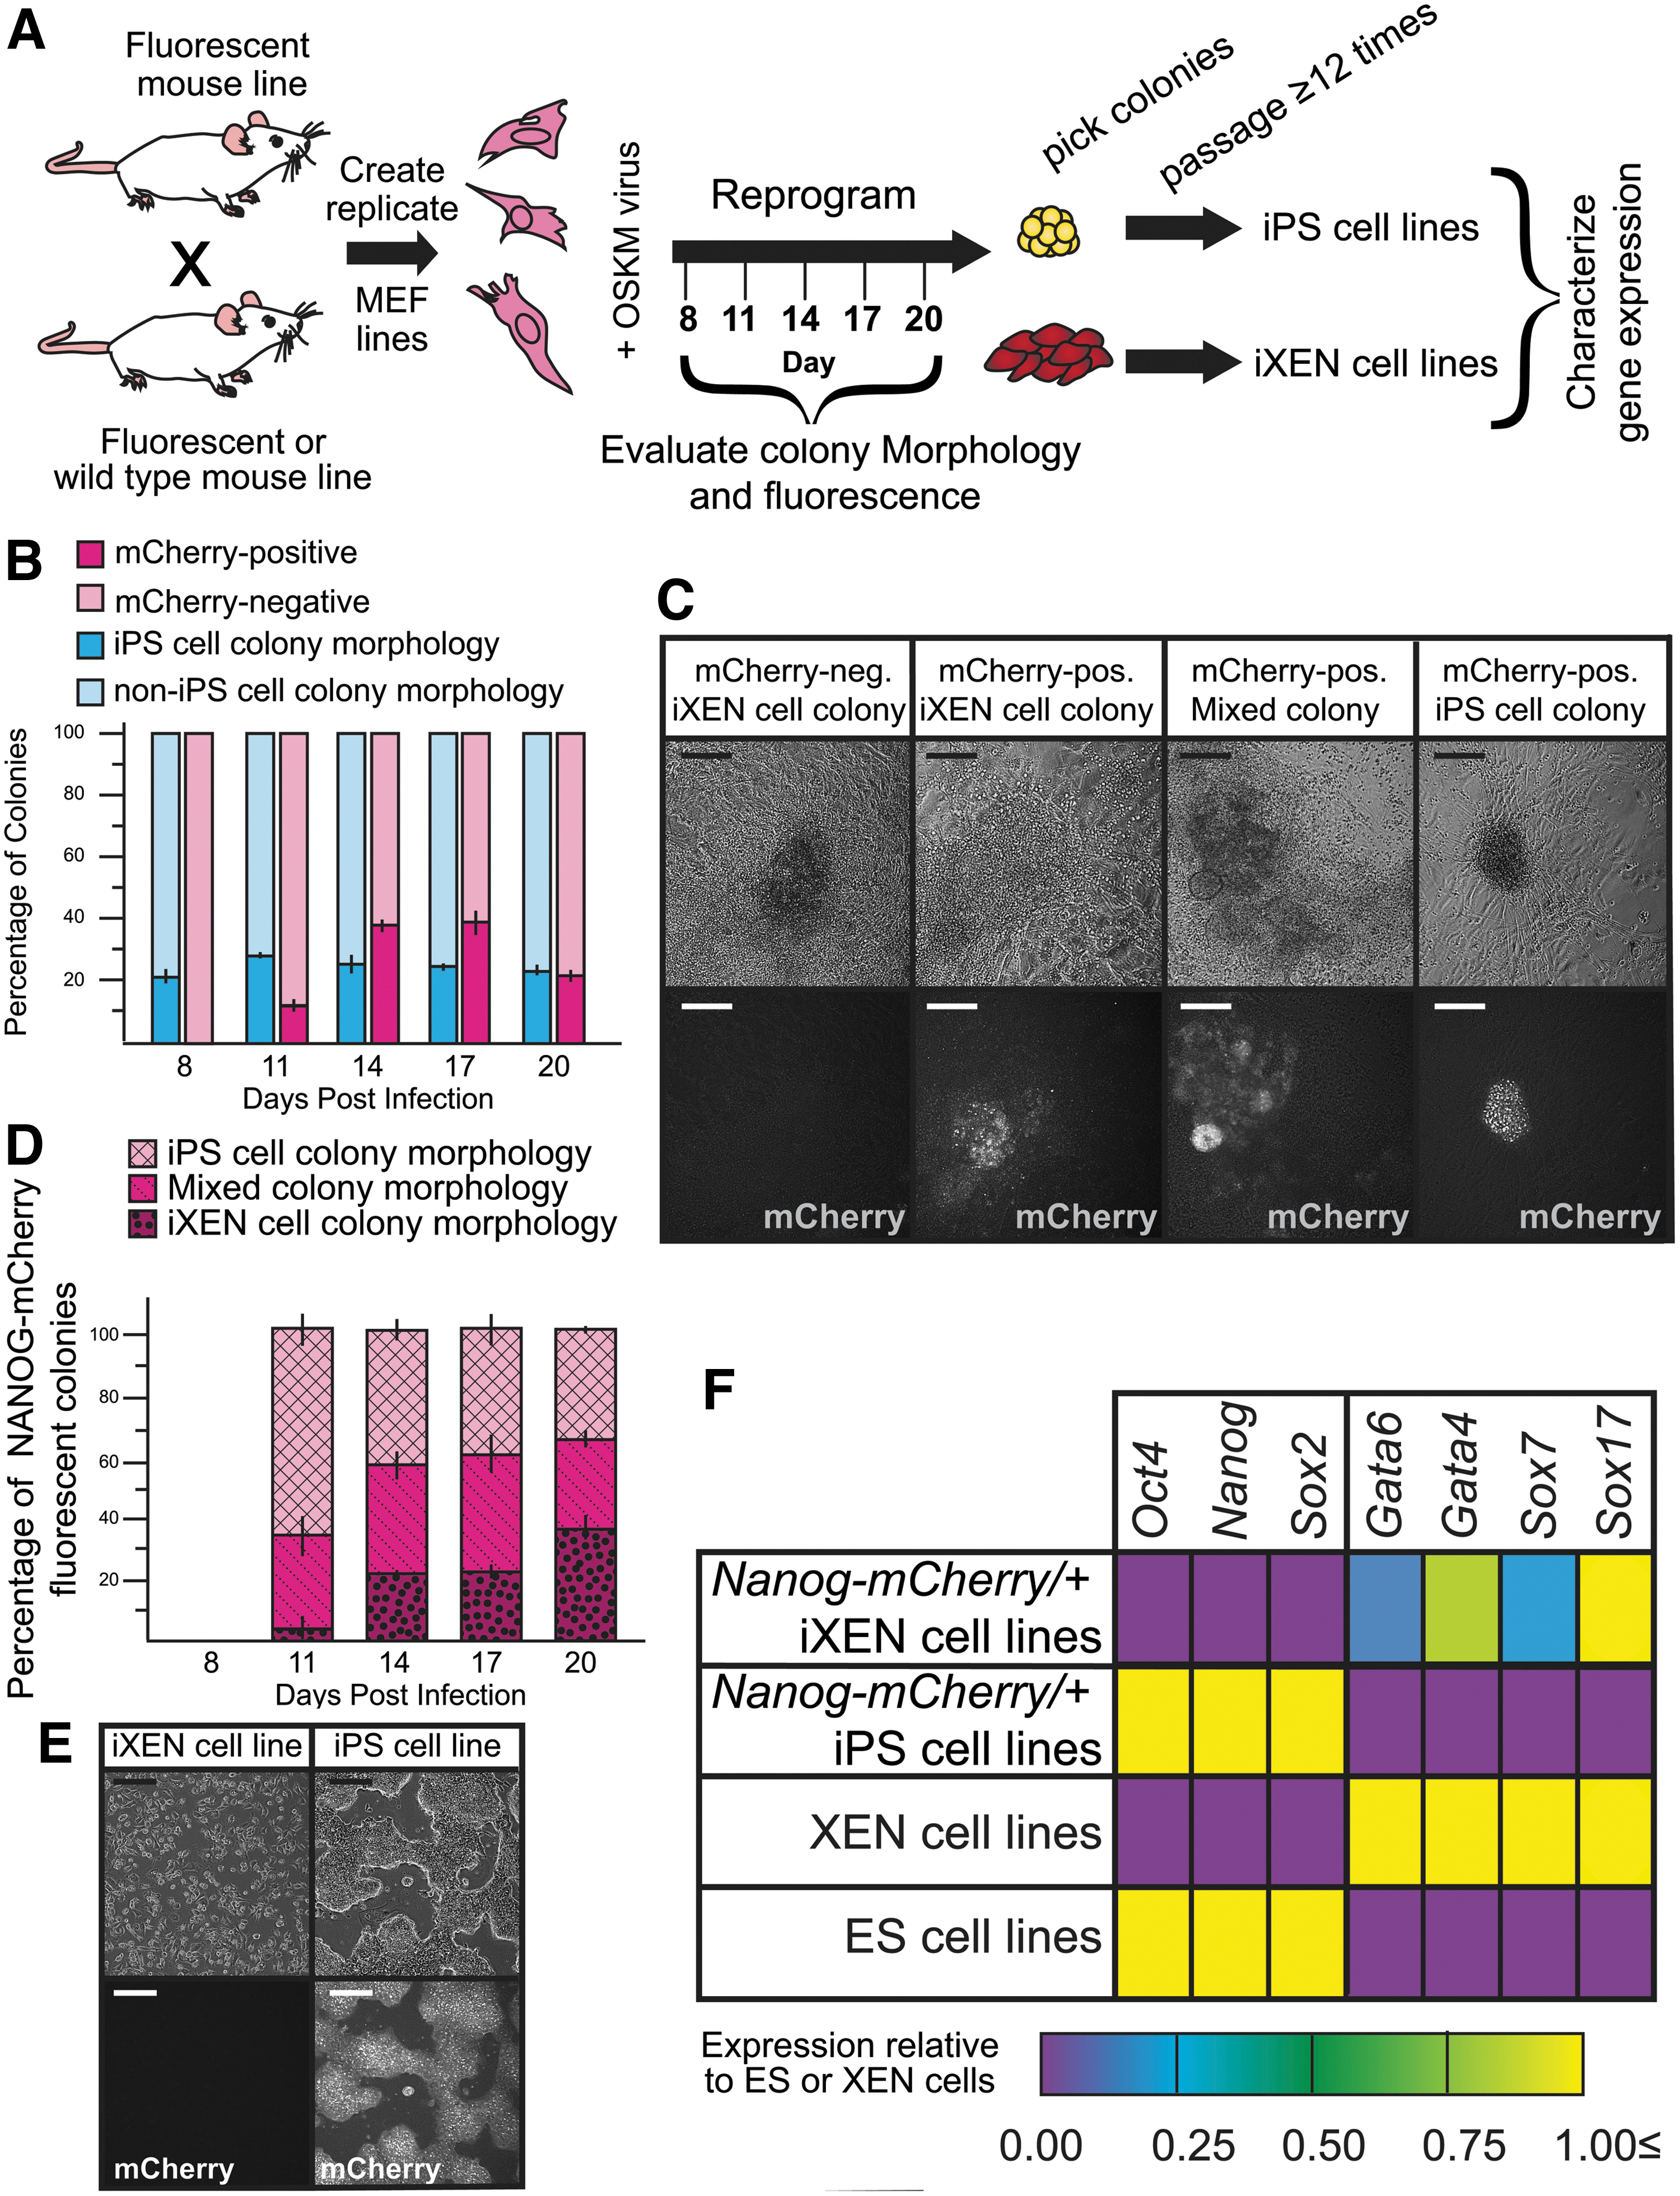
Our goal was to determine whether Nanog, together with other reporters, reliably distinguishes iPS and iXEN cells during reprogramming (Fig. 1A). Because only GFP-like reporters of many different genes are available, we first created a new Nanog-mCherry mouse line (Supplementary Fig. S1) that would enable simultaneous evaluation of multiple fluorescent reporters.
NANOG-mCherry expression is detected in colonies bearing non-iPS cell colony morphology during reprogramming.
To evaluate the specificity of this reporter for the pluripotent lineage, we examined blastocysts carrying Nanog-mCherry at embryonic day E3.75. At this stage, embryos possess pluripotent and nonpluripotent cell types, including the pluripotent epiblast and the primitive endoderm (progenitors of XEN cells) (Chazaud et al, 2006; Kunath et al, 2005).
Indeed, we observed expression of NANOG-mCherry only in epiblast cells and not within the nonpluripotent cell types (Supplementary Fig. S1C). Moreover, NANOG-mCherry was detected in ES cells, but not in differentiated ES cells (Supplementary Fig. S1D). We therefore conclude that the NanogmCherry allele is a faithful reporter of endogenous Nanog expression.
Nanog-mCherry and Oct4-eGFP do not reliably identify iPS cell colonies
Next, we evaluated the expression of NANOG-mCherry during reprogramming. We reprogrammed MEFs carrying one allele of Nanog-mCherry by retroviral delivery of OSKM and then tracked colony morphology and fluorescence. During reprogramming, presumptive iPS cell colonies appear as round compact colonies with smooth borders (Meissner et al, 2007).
Using these criteria, we first determined that around 20% of all observable colonies possessed morphological features of iPS cell colonies, starting around day 8 and at 3-day intervals until day 20 (Fig. 1B). We next quantified the proportion of colonies expressing NANOG-mCherry, with the expectation that if Nanog is a specific reporter of iPS cell colonies, then the proportion of fluorescent colonies should be equivalent to the proportion of morphologically apparent iPS cell colonies.
However, at several points, the proportion of NANOG-mCherry-expressing colonies appeared to be greater than the proportion of colonies that morphologically resembled iPS cell colonies (Fig. 1B), suggesting that Nanog is expressed in non-iPS cell colonies during reprogramming. We therefore evaluated the expression of NANOG-mCherry in non-iPS cell colonies, including iXEN colonies.
As we previously reported, presumptive iXEN colonies appear flatter and more spread, with less defined borders than iPS cells (Moauro and Ralston, 2022; Parenti et al, 2016). Additionally, we observed a third type of colony that displayed morphological features of both iPS and iXEN cell colonies, which we termed Mixed colonies. Mixed colonies possessed domed, smooth-edged, iPS cell-like clusters, which cascaded into flatter, rough-edged, iXEN cell-like colonies (Fig. 1C).
Consistent with our prior observations, we observed that NANOG-mCherry expression was not always restricted to presumptive iPS cell colonies, but was also observed in presumptive iXEN and Mixed colonies (Fig. 1C, D) during reprogramming. However, NANOG-mCherry was expressed evenly throughout presumptive iPS cell colonies, while NANOG-mCherry was observed in diffuse patches of presumptive iXEN cell and Mixed colonies (Fig. 1D).
Moreover, expression of NANOG-mCherry was largely restricted to iPS cell-like regions of the Mixed colonies during reprogramming. To evaluate the expression of NANOG-mCherry within stable iPS and iXEN cell lines, we manually picked presumptive iPS and iXEN colonies and derived stable cell lines, as previously described (Parenti et al, 2016; Takahashi and Yamanaka, 2006). Ultimately, iPS cell lines expressed NANOG-mCherry, while iXEN cell lines did not (Fig. 1E).
These stem cell lines also expressed appropriate markers (Fig. 1F), authenticating their identities as iPS or iXEN cell lines and confirming the validity of our morphological criteria for selecting stem cell colony subtypes. Taken together, these observations indicate that while Nanog-mCherry is detected in established iPS cell lines, it is also detected in cells that do not appear to be part of iPS cell colonies during reprogramming. This observation underscores the importance of using both morphology and fluorescence to identify emerging iPS cell colonies.
Finally, we asked whether the combined use of two pluripotency reporters could more reliably identify iPS cell colonies during reprograming than NanogmCherry alone. We reprogrammed MEFs carrying alleles of both Oct4-eGFP (Lengner et al, 2007) and Nanog-mCherry as before. Overall, we observed concordance between the proportions of morphologically apparent iPS cells and eGFP/mCherry double-positive colonies (Fig. 2A). However, closer examination revealed that double-positive cells were present in all three colony types (Fig. 2B, C).
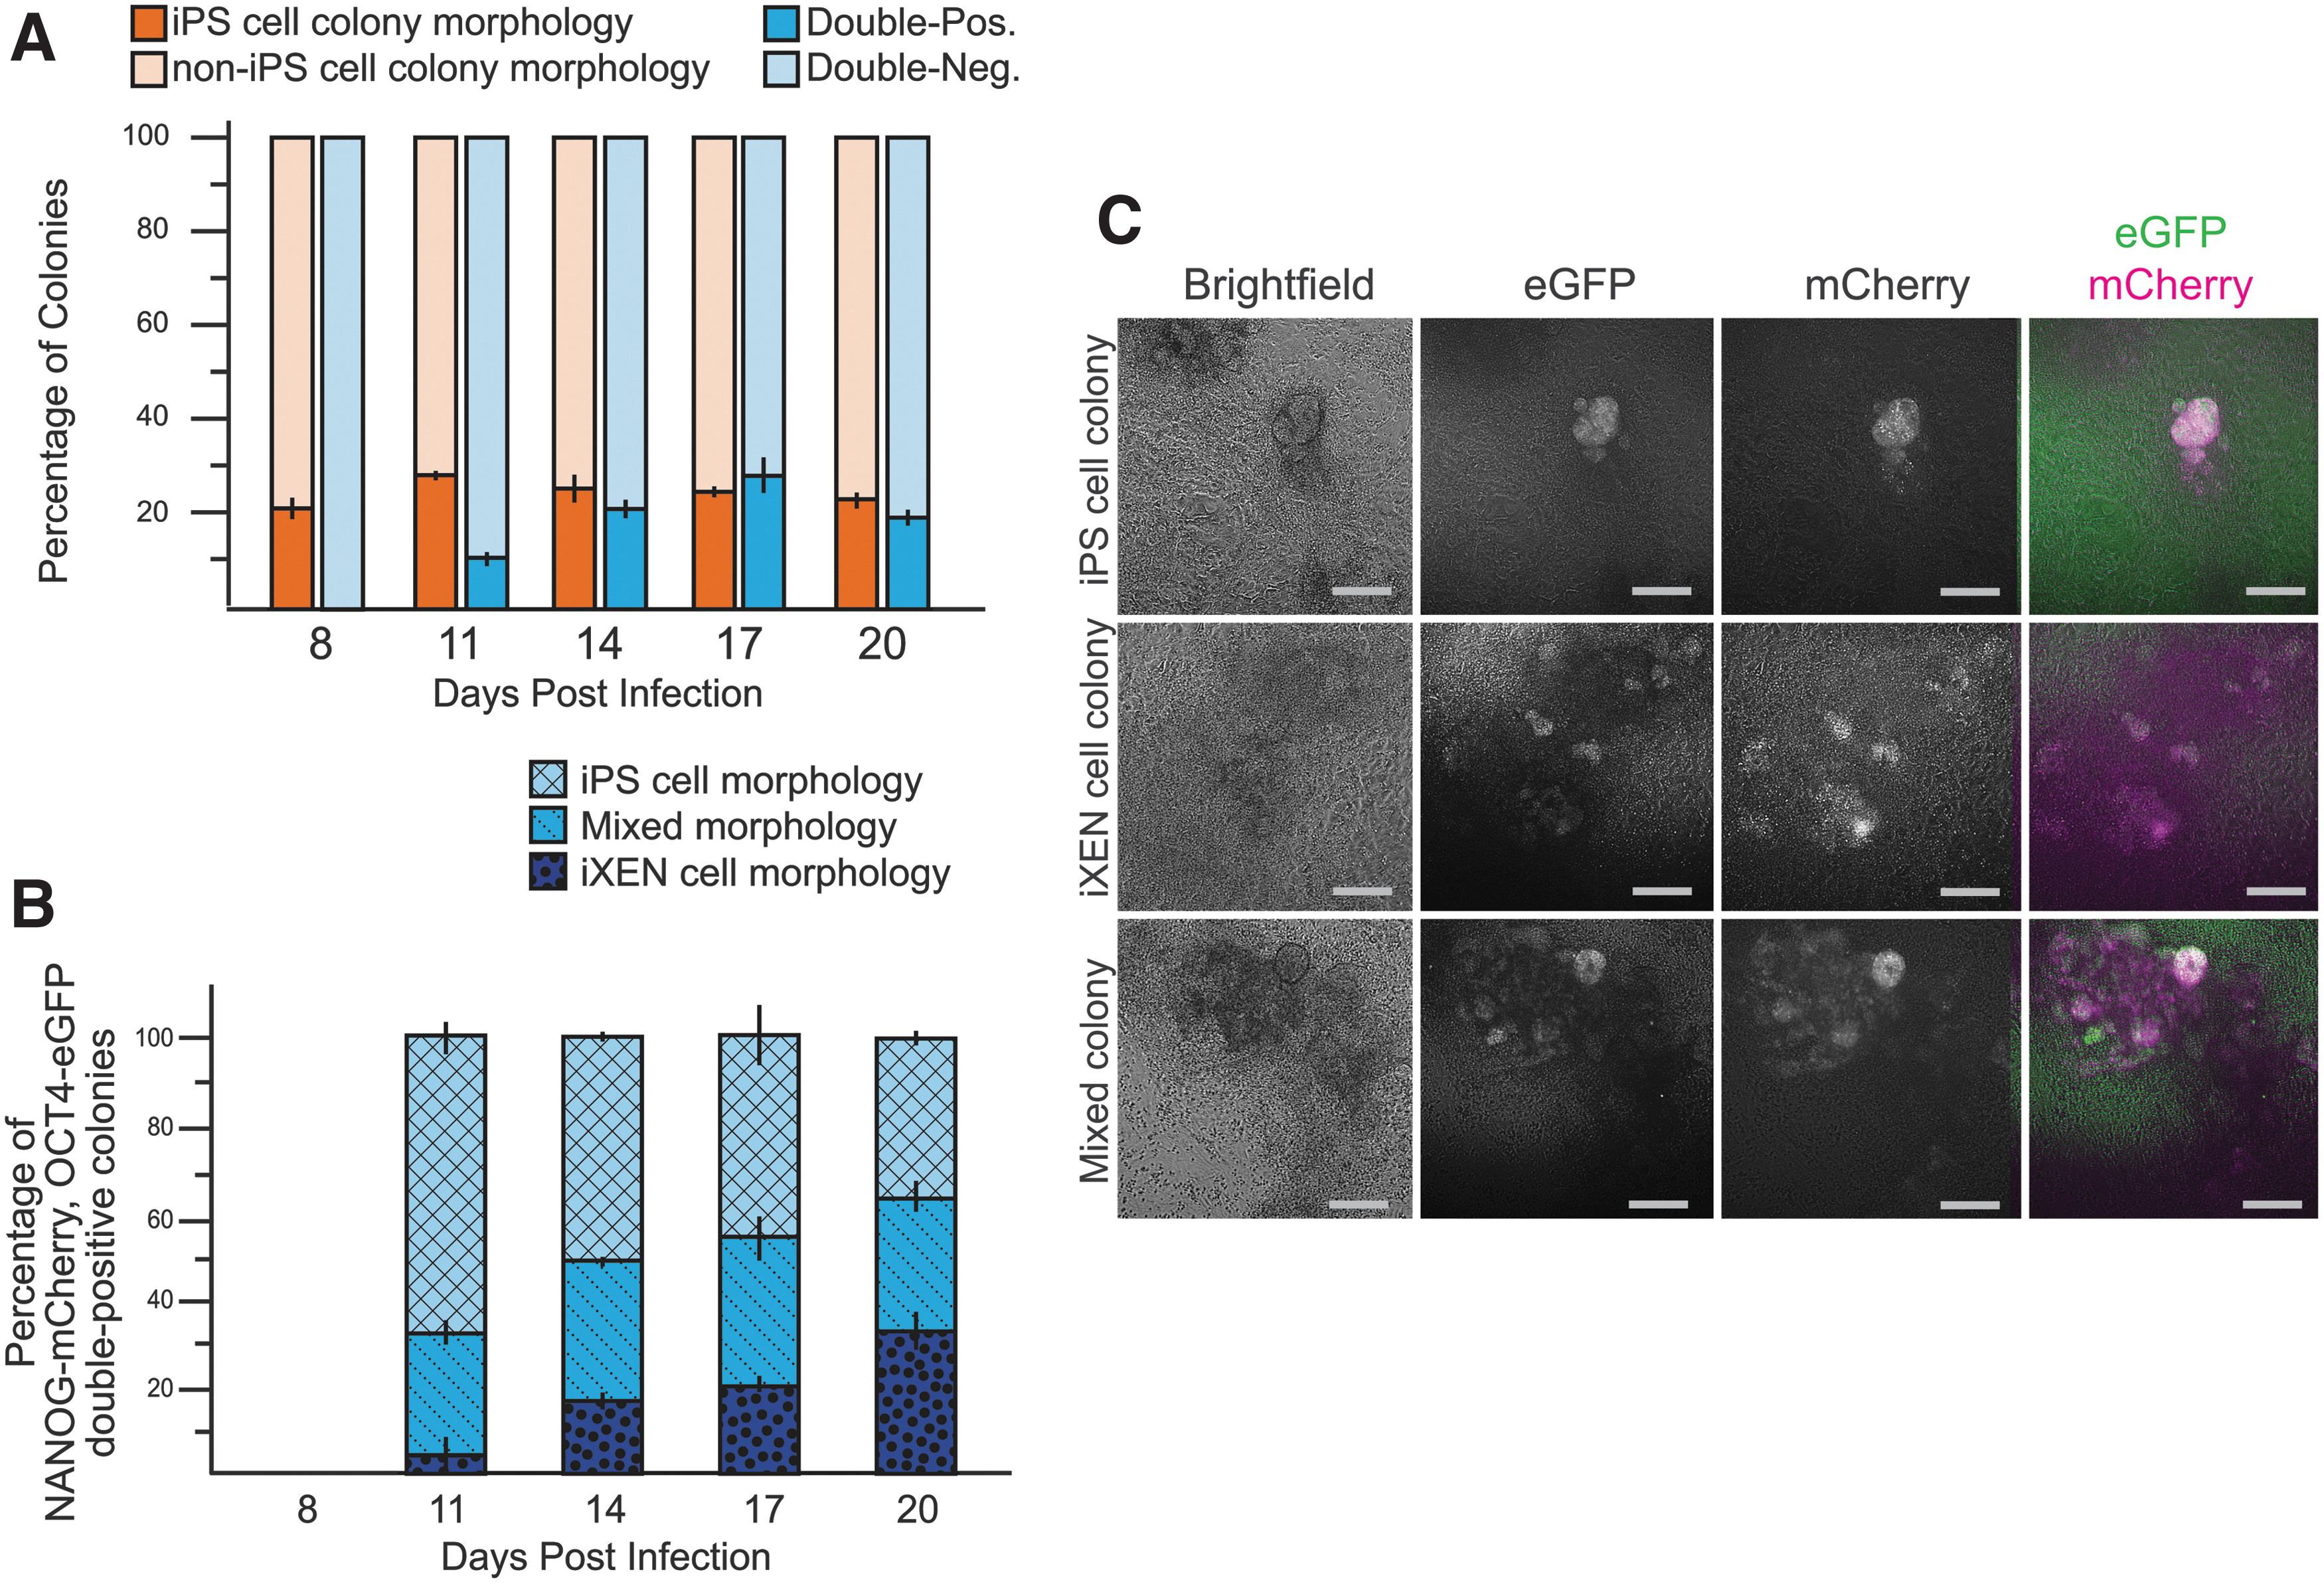
NANOG-mCherry and OCT4-eGFP are coexpressed in multiple colony subtypes during reprogramming.
Interestingly, OCT4-eGFP and NANOG-mCherry appeared to be coexpressed within individual cells of the double-positive colonies (Fig. 2B). Our observations indicate that these pluripotency markers label cells that are not part of presumptive iPS cell colonies and/or that colony subtypes are potentially highly heterogeneous.
Gata6-H2B-Venus is expressed in multiple colony subtypes during reprogramming
Because our previous results suggested that pluripotency reporters alone are not sufficient to distinguish iPS and iXEN cell colonies during reprogramming, we next sought to identify a reliable reporter for iXEN cell fate. In the embryo, GATA6 is considered to be one of the earliest-acting regulators of XEN development (Artus et al, 2011; Chazaud et al, 2006; Koutsourakis et al, 1999; Morrisey et al, 1996; Schrode et al, 2014). Additionally, GATA6 is sufficient to induce an XEN phenotype in ES cells (Capo-Chichi et al, 2005; Fujikura et al, 2002; Shimosato et al, 2007; Wamaitha et al, 2015).
These observations suggest that GATA6 could be a marker of XEN cell fate during somatic cell reprogramming. A mouse knock-in line carrying Gata6-H2B-Venus has been established, and Venus was observed within XEN lineages (Freyer et al, 2015). We therefore evaluated the expression of GATA6-H2B-Venus during reprogramming of MEFs carrying Gata6-H2B-Venus.
We began by quantifying the proportion of presumptive iXEN colonies present throughout reprogramming, using morphological criteria defined above (Fig. 3A). Next, we quantified the proportion of all colonies in which GATA6-H2B-Venus was detected. Starting around day 14, we observed expression of GATA6-H2B-Venus in 10%–20% of all colonies (Fig. 3A), suggesting that not all presumptive iXEN cell colonies express GATA6-H2B-Venus.
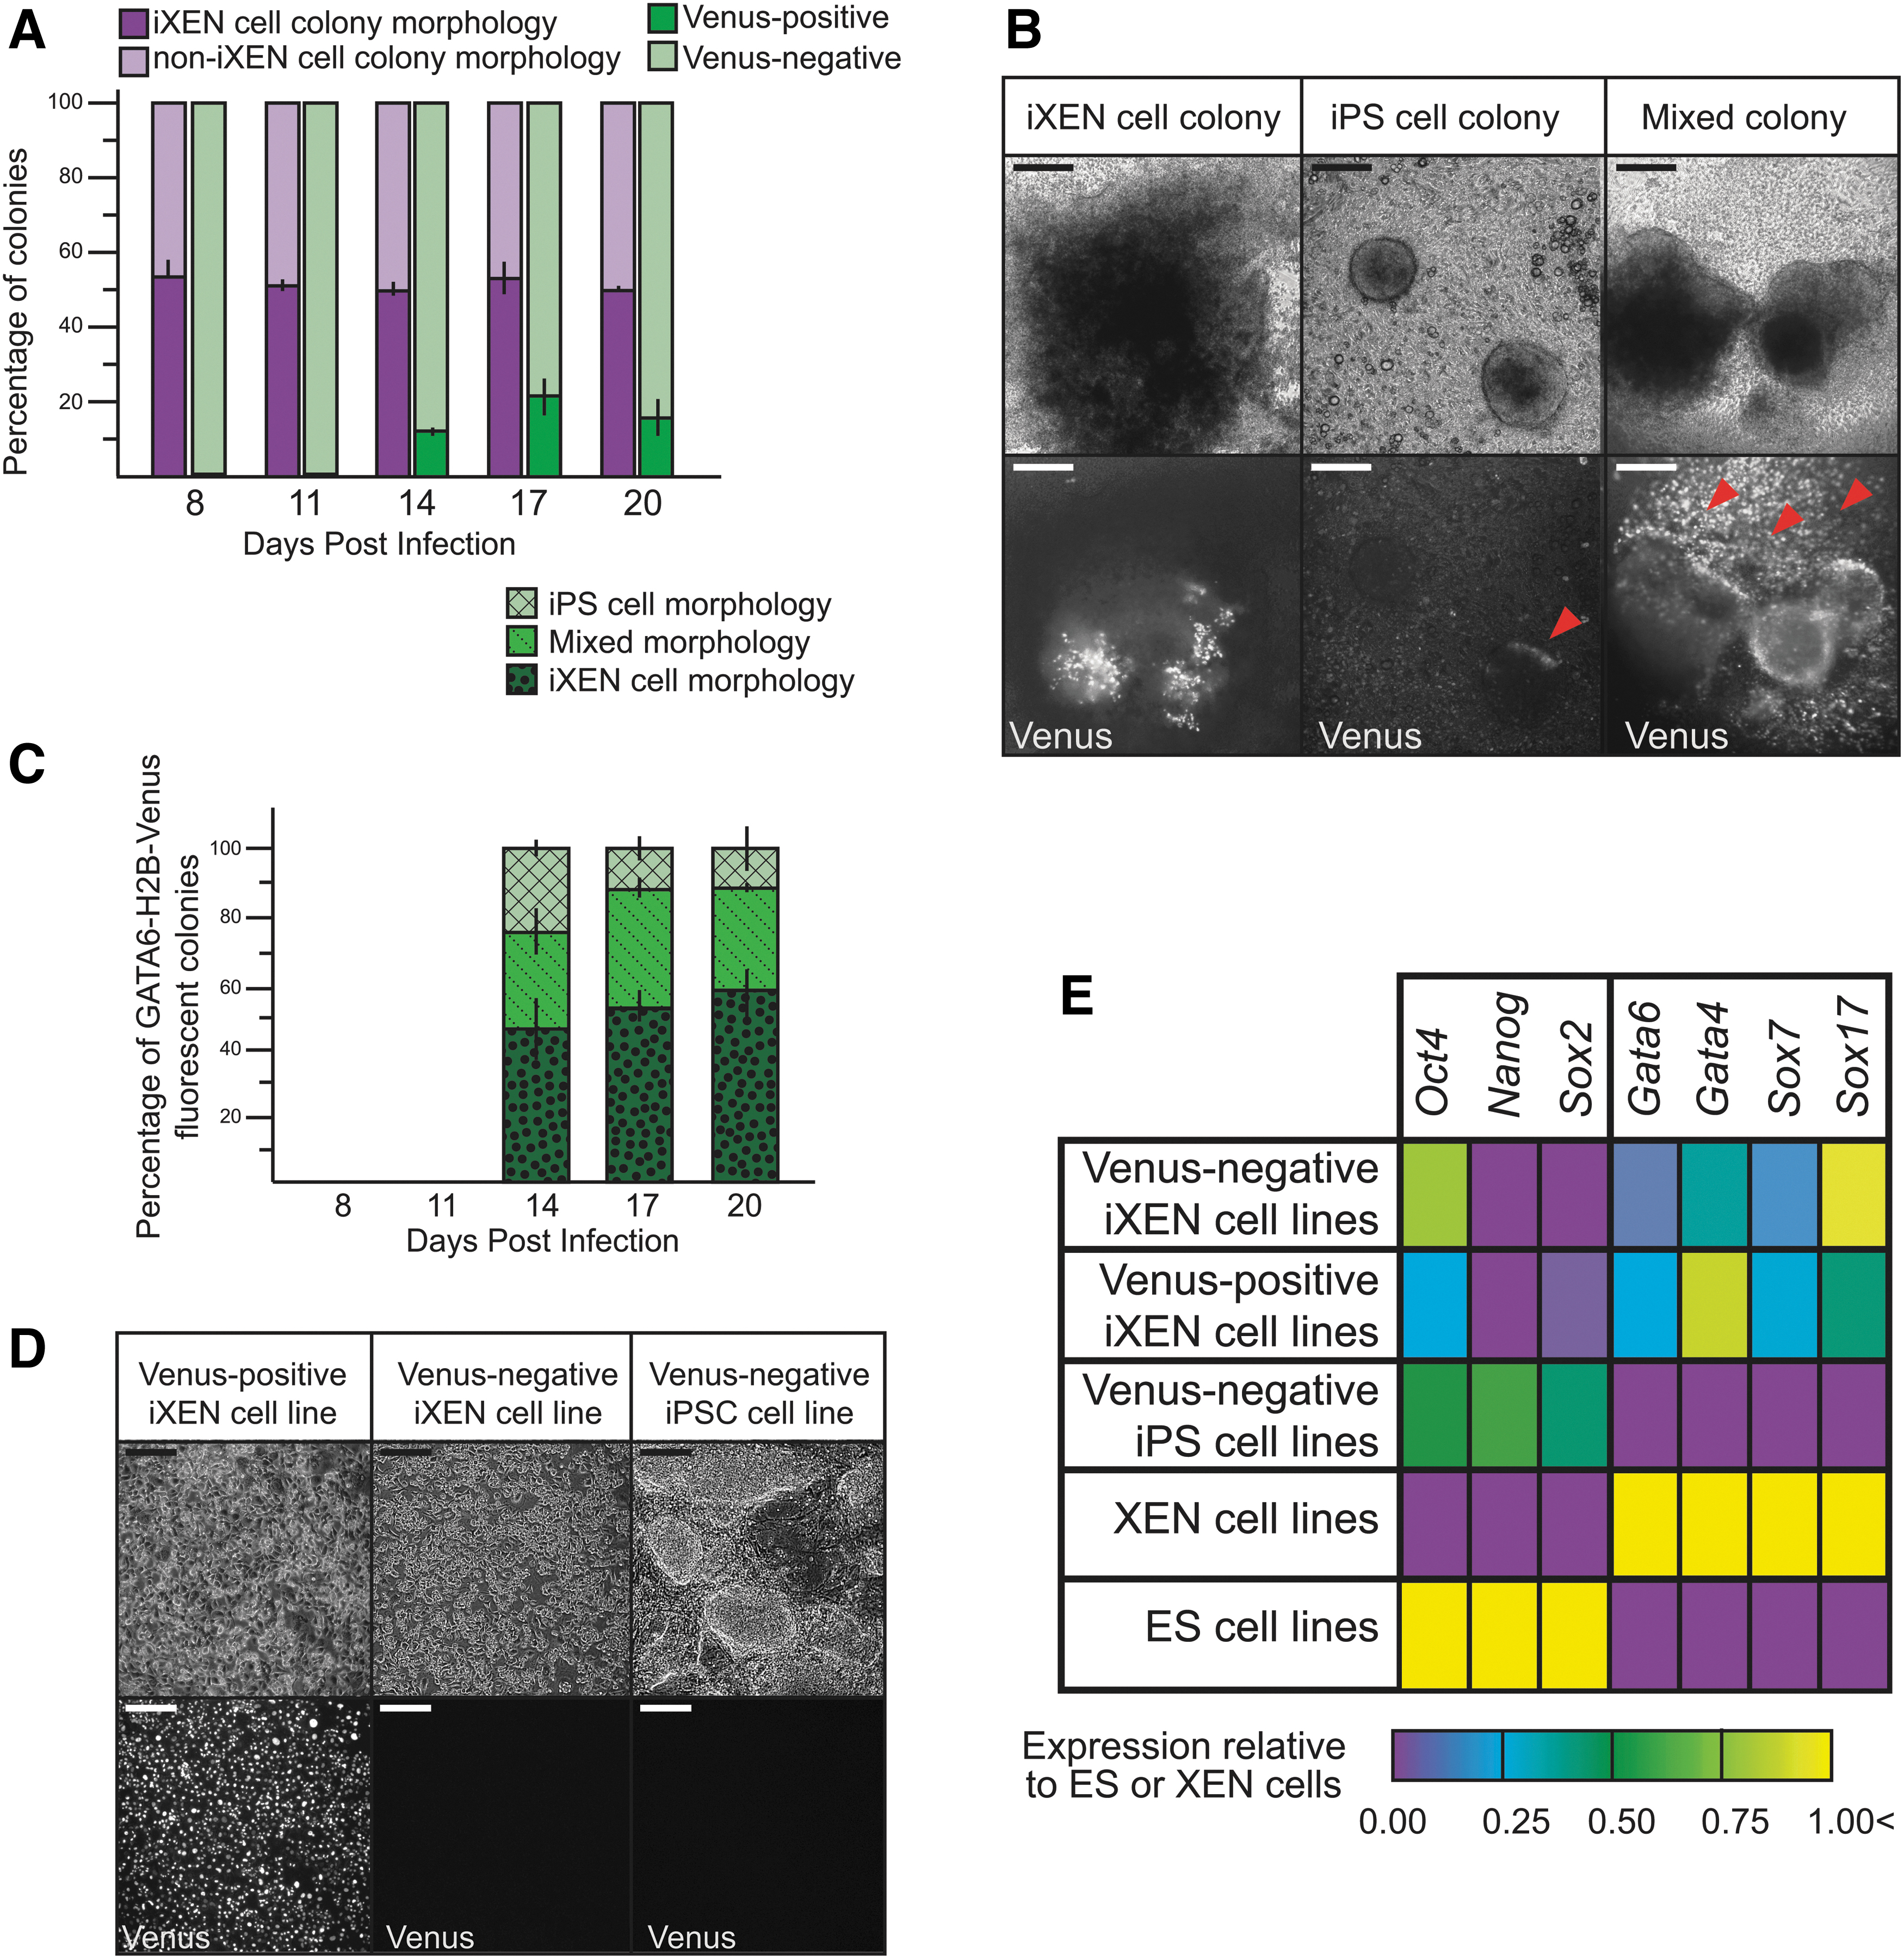
GATA6-H2B-Venus expression is detected in colonies bearing non-iXEN cell colony morphology during reprogramming.
We next evaluated the expression of GATA6-H2B-Venus within iPS, Mixed, and iXEN cell colonies. Surprisingly, GATA6-H2B-Venus was diffusely expressed in all three colony types (iPS, iXEN, and Mixed), localizing to subsets of cells within each colony subtype (Fig. 3B, C). To test whether GATA6-H2B-Venus eventually becomes restricted to iXEN cell lines, presumptive iPS and iXEN cell colonies were picked and passaged to create stable cell lines. After passaging, all cell lines maintained appropriate morphologies (Fig. 3D) and expression of key lineage-determining genes (Fig. 3E).
Notably, GATA6-H2B-Venus was only expressed in some iXEN cell lines despite qPCR evidence of Gata6 expression (Fig. 3D, E). These observations are consistent with the observation that Gata6-H2B-Venus was not detected in all XEN cells during development (Freyer et al, 2015). For these reasons, we conclude that Gata6-H2B-Venus may not be useful for distinguishing stem cell colony subtypes during reprogramming.
Gata4-H2B-eGFP is expressed in iXEN and not iPS cell colonies
Like GATA6, the closely related factor, GATA4, is also thought to play an essential and instructional role in XEN development in vivo and in ES cell lines (Artus et al, 2011; Capo-Chichi et al, 2005; Fujikura et al, 2002; Kuo et al, 1997; Molkentin et al, 1997; Shimosato et al, 2007). The Gata4-H2B-eGFP reporter has been shown to faithfully recapitulate expression of Gata4 during development (Simon et al, 2018).
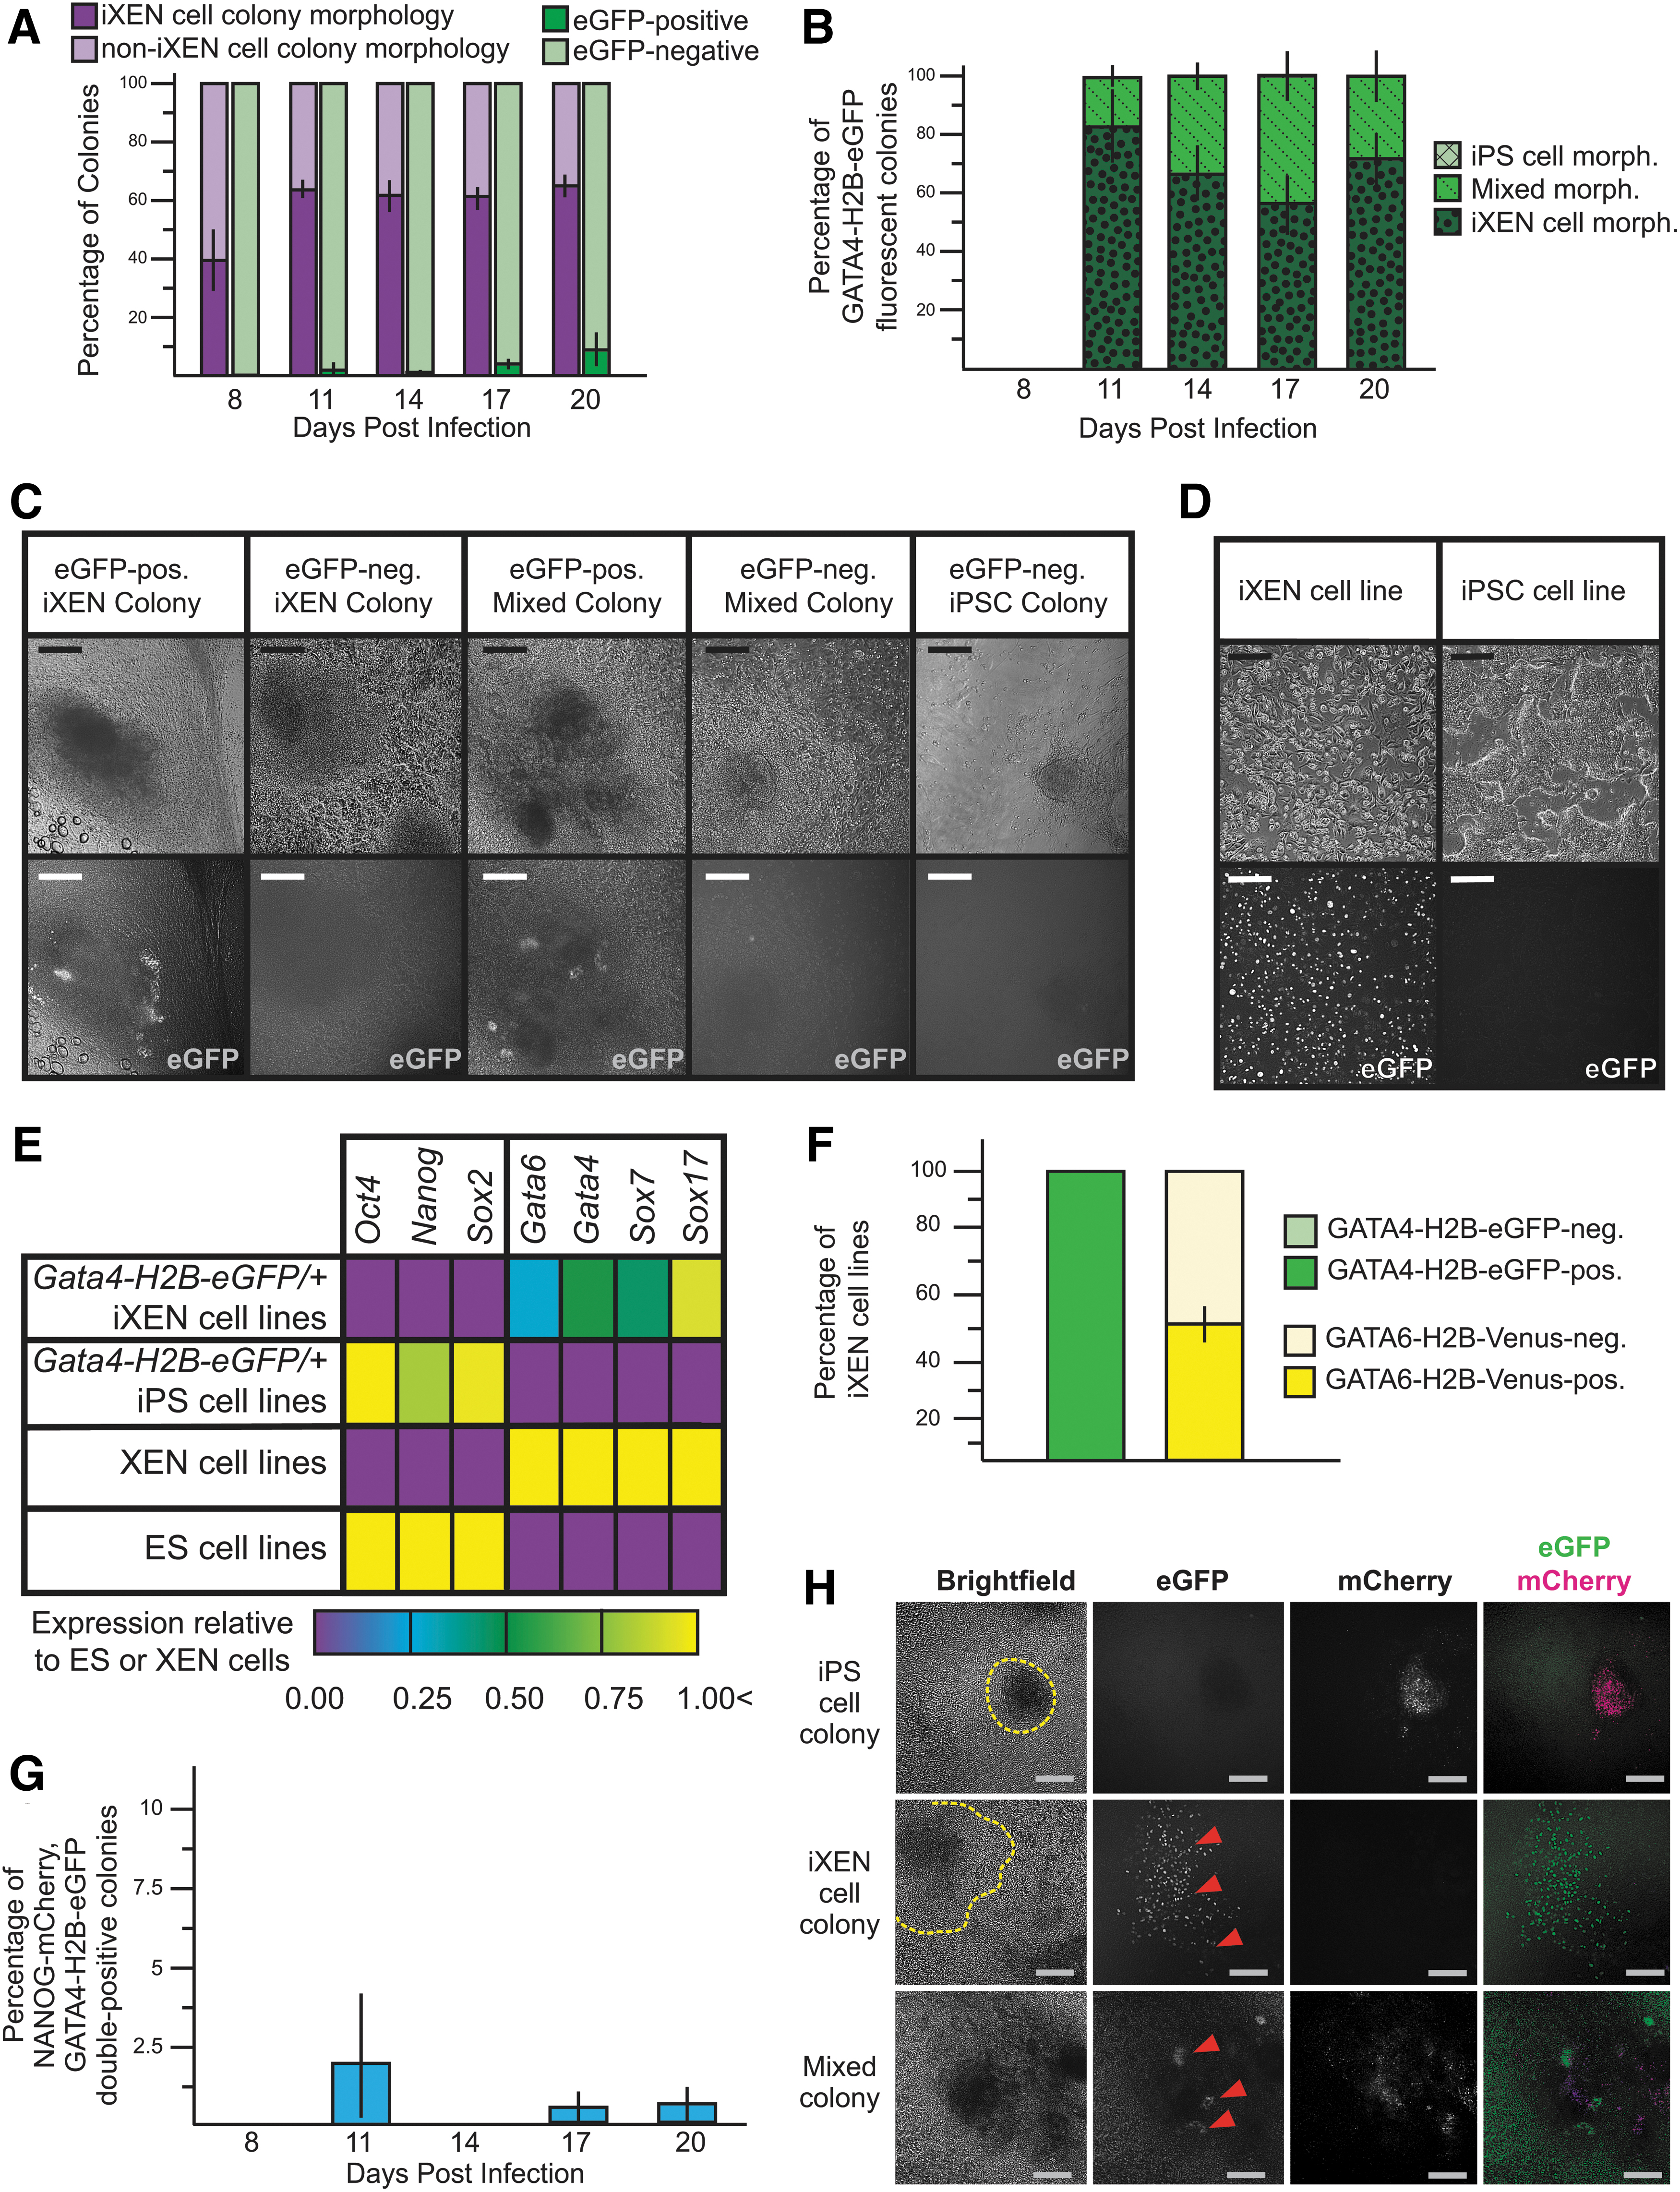
During reprogramming of MEFs carrying the Gata4-H2B-eGFP allele, we observed expression of GATA4-H2B-eGFP in very few colonies (Fig. 4A). However, GATA4-H2B-eGFP was only detected in presumptive iXEN and Mixed colonies and not in iPS cell colonies (Fig. 4B, C), indicating that GATA4-H2B-eGFP may be more informative than GATA6-H2B-Venus for identifying presumptive iXEN cells during reprogramming.
GATA4-H2B-eGFP, in combination with NANOG-mCherry, distinguishes iPS and iXEN cell colonies during reprogramming.
However, like GATA6-H2B-Venus, GATA4-H2B-eGFP was detected nonuniformly throughout presumptive iXEN and Mixed colonies, raising questions about the fidelity of this marker and the identity of the GATA4-H2B-eGFP-positive cells within these colonies. To investigate this further, presumptive iXEN colonies were picked and passaged to create stable cell lines. Encouragingly, all iXEN cell lines expressed GATA4-H2B-eGFP in conjunction with appropriate morphology and gene expression (Fig. 4D, E).
Moreover, all iXEN cell lines carrying an allele of Gata4-H2B-eGFP expressed GATA4-H2B-eGFP by passage 5, regardless of whether Gata4 had been expressed initially, unlike iXEN cell lines carrying an allele of Gata6-H2B-Venus (Fig. 4F). We conclude that Gata4-H2B-Venus is expressed in iXEN and not iPS cell colonies.
We next sought to examine the expression of GATA4-H2B-eGFP and NANOG-mCherry simultaneously. As expected, based on their individual expression patterns, these two reporters were coexpressed in very few colonies during reprogramming (Fig. 4G). Strikingly, however, only Mixed colonies coexpressed both GATA4-H2B-eGFP and NANOG-mCherry (Fig. 4H).
In addition, these two reporters exhibited complementary expression patterns within the Mixed colonies, consistent with cell type-specific expression of these two genes in embryos (Artus et al, 2011; Chazaud et al, 2006; Niakan and Eggan, 2013). We therefore propose that the combination of GATA4-H2B-eGFP and NANOG-mCherry can be used to resolve specific stem cell colony subtypes during reprogramming.
Discussion
Although transcription factor-mediated somatic cell reprogramming has been possible for over a decade, we still have only a rough understanding of the molecular events that each cell undergoes as it acquires the iPS or iXEN cell fate. As single-cell genomic approaches become more commonplace, we are beginning to understand the stages of the reprogramming process.
However, most genomic approaches do not permit the long-term evaluation of cellular changes over time in real time. For these reasons, fluorescent reporters, which permit live imaging, individual cell tracking, and readout of gene expression, are an appealing complement to genomic studies of somatic cell reprogramming.
We have identified a combination of two mouse gene expression fluorescent reporter lines that can reliably distinguish colonies of presumptive iPS and iXEN cells. One limitation of this approach is the need to derive MEF lines from mice carrying multiple distinct reporter alleles. However, the reliable identification of early iXEN and iPS cell lines will lead to discovery of more facile approaches for cell isolation, such as unique cell surface markers that label live iXEN and iPS cells early in their formation. Nevertheless, the ability to select cells on the basis of the expression of potent developmental regulators of pluripotent and XEN cell fate provides additional advantages.
First, we note that while Gata4 was detected within presumptive iXEN cell colonies, it did not appear to be expressed in all cells of those colonies. The reasons for the limited expression of Gata4 within iXEN cell colonies are not yet clear. One possibility is that Gata4 expression is dynamically regulated in nascent iXEN cells, giving the illusion (in snapshots) that Gata4 is only expressed in a subset of iXEN cells.
Similarly, expression of Gata4 may be progressive, consistent with the gradual adoption of iXEN cell fate. Another possibility is that the Gata4 reporter labels a unique subtype of iXEN cells. These possibilities could be investigated using live imaging and fluorescent cell sorting in future studies.
Second, we were surprised that the Nanog reporter was detected within non-iPS cell colony subtypes, including iXEN and Mixed colonies. While this pattern could raise some concern for the fidelity of Nanog as a marker for the emergence of pluripotency, we do not yet understand the dynamics of Nanog expression outside of iPS cell colonies.
One possibility is that Nanog is expressed very transiently in most cells that undergo reprogramming regardless of their ultimate fates. Another possibility is that bona fide, Nanog-expressing iPS cells arise within Mixed and iXEN cell colonies. These possibilities could again be addressed using live imaging and fluorescent cell sorting in future studies, which could reveal whether Nanog expression is stable or transient and whether Nanog-expressing cells give rise to iPS, iXEN, Mixed, or failed cell lines.
Last, we observed a significant number of Mixed colonies in all of our reprogramming experiments. These colonies could be considered to have failed or stalled during reprogramming. However, it is intriguing that Mixed colonies possess characteristics of both iPS and iXEN colonies, including morphology and fluorescent marker expression.
Therefore, it is tempting to speculate that Mixed colonies also give rise to bona fide iPS and iXEN cells. However, the quality and properties of stem cell lines that can be derived specifically from the Mixed colonies await further investigation. Similarly, these reporters can be used in future studies to determine when and how iXEN and iPS cell fates first diverge from each other because they will enable identification of differences in transcriptional signature and developmental potential in single-cell studies.
Ultimately, the use of fluorescent gene expression reporters will likely enable us to address these and other exciting questions about how and why reprogramming works.
Footnotes
Acknowledgments
The authors would like to thank Anna-Katerina Hadjantonakis and her laboratory for providing Gata4H2B-eGFP and Gata6tm1Hadj/J mice and the Michigan State University Transgenic Core for assistance creating the Nanog-mCherry mouse line.
Authors' Contributions
A.M. was involved in methodology, validation, formal analysis, investigation, writing—original draft, and visualization. R.E.K. was involved in validation, investigation, and writing—review and editing. D.O. was involved in methodology, validation, and writing—review and editing. A.R. was involved in conceptualization, resources, writing—original draft, supervision, project administration, and funding acquisition.
Author Disclosure Statement
The authors declare they have no conflicting financial interests.
Funding Information
This work was supported by a grant (R35 GM131759) from the National Institutes of Health to A.R. R.E.K. has also been supported by a grant (T32 HD087166) from the National Institutes of Health.
References
Supplementary Material
Please find the following supplemental material available below.
For Open Access articles published under a Creative Commons License, all supplemental material carries the same license as the article it is associated with.
For non-Open Access articles published, all supplemental material carries a non-exclusive license, and permission requests for re-use of supplemental material or any part of supplemental material shall be sent directly to the copyright owner as specified in the copyright notice associated with the article.