
Abstract
Objective:
The aim of this study was to develop a 18F-fluorodeoxyglucose (18F-FDG) positron emission tomography/computed tomography (PET/CT) radiomic model for predicting mediastinal lymph node metastasis (LNM) in presurgical patients with lung adenocarcinoma.
Methods:
The study enrolled 320 patients with lung adenocarcinoma (288 internal and 32 external cases) and extracted 190 radiomic features using the LIFEx package. Optimal radiomic features to build a radiomic model were selected using the least absolute shrinkage and selection operator algorithm. Logistic regression was used to build the clinical and complex (combined radiomic and clinical variables) models.
Results:
Ten radiomic features were selected. In the training group, the area under the receiver operating characteristic curve of the complex model was significantly higher than that of the radiomic and clinical models [0.924 (95% CI: 0.887–0.961) vs. 0.863 (95% CI: 0.814–0.912; p = 0.001) and 0.838 (95% CI: 0.783–0.894; p = 0.000), respectively]. The sensitivity, specificity, accuracy, and positive and negative predictive values of the radiomic model were 0.857, 0.790, 0.811, and 0.651 and 0.924, respectively, which were better than that of visual evaluation (0.539, 0.724, 0.667, and 0.472 and 0.775, respectively) and PET semiquantitative analyses (0.619, 0.732, 0.697, and 0.513 and 0.808, respectively).
Conclusions:
18F-FDG PET/CT radiomics showed good predictive performance for LNM and improved the N-stage accuracy of lung adenocarcinoma.
Introduction
Lung cancer is the most diagnosed cancer and primary cause of cancer-related death. 1 Currently, more than 85% of cases have been diagnosed with nonsmall cell lung cancer (NSCLC). Among them, adenocarcinoma is a common histopathological type. 2 Lymph node metastasis (LNM) is the main metastatic pathway and an essential prognostic factor. The 5-year survival rates of patients with NSCLC stages N0–N3 differ. 3 Surgery is the optimal choice for patients at early stages, and complete excision of the lymph node (LN) with histopathology is the most precise method for diagnosis. 4
The 2021 National Comprehensive Cancer Network guidelines recommend that patients with lung cancer should undergo complete LN dissection or sampling of at least three N2 stations, which affects the prognosis of patients with NSCLC. 5 The pathological type or histological grade is an important predictive factor for early LNM. 6 However, it requires invasive biopsy or surgery. Accurate imaging to predict LNM can guide adjuvant therapy and affect clinical treatment. 7
Due to the relatively high sensitivity for N staging, 18F-fluorodeoxyglucose ( 18 F-FDG) positron emission tomography/computed tomography (PET/CT) has become a standard, noninvasive imaging modality for lung cancer. However, infectious, inflammatory, or granulomatous diseases may cause high PET sensitivity, leading to false positives, 8,9 and a small LN size and low FDG uptake can lead to false negatives, challenging the diagnosis of occult LNs.
Radiomics is a quantitative and noninvasive approach that can reveal tumor information associated with the underlying pathophysiology by extracting a large amount of minable high-dimensional data from images, 10 providing promising opportunities for analyzing tumor heterogeneity. 11 It uses many automated data description algorithms to translate the region of interest (ROI) into quantitative high-throughput space features. 12
Recent advances in radiomics have provided insights into clinical oncology, including tumor detection, subtype classification, therapy response assessment, and gene mutation prediction; hence, it provides numerous possibilities for qualitative diagnosis of LN status. 13 -15
This study aimed to improve N-stage accuracy by establishing an 18 F-FDG PET/CT radiomic scoring system and validating its prediction efficiency.
Patients and Methods
Patient selection
This retrospective study was approved by the authors' institutional review board, and the requirement for informed consent was waived. Patients were recruited from two institutions. For the internal cases, 288 patients with lung adenocarcinoma were enrolled after analyzing 606 consecutive patients with pulmonary nodules at the Fourth Hospital of Hebei Medical University (HBMU) between January 2016 and February 2021. For the external cases, 32 patients with lung adenocarcinoma at Baoding No. 1 Central Hospital (BDCH) between November 2017 and April 2021 were enrolled.
The inclusion criteria were (1) underwent complete dissection of the primary lung lesion and mediastinal LNs; (2) had postoperative pathology-confirmed lung adenocarcinoma and reported LNM status; and (3) underwent 18 F-FDG PET/CT before surgery (interval <4 weeks). The exclusion criteria were (1) a history of other tumors; (2) underwent chemotherapy, radiotherapy, or other preoperative treatment; (3) had a primary lung lesion with maximum diameter <1 cm or pure ground-glass nodules; and (4) incomplete clinical characteristic data.
Following the abovementioned criteria, 288 patients were enrolled in the internal group (153 females and 135 males), with an average age of 61.60 ± 8.51 years (range 29–80), including 259 cases of lobectomy and complete LN dissection and 29 sublobar cases with sampling of LNs of at least three N2 stations. The sample size was confirmed to be 90 (31.25%) patients with LNM and 198 (68.75%) patients without LNM. A total of 288 patients were randomly divided into the training group (n = 201, 70%) and internal validation group (n = 87, 30%).
Furthermore, 32 patients were included in the external validation group, wherein 18 (56.25%) patients had LNM and 14 (43.75%) patients had no LNM. Twenty cases underwent surgery, and 12 cases underwent LN biopsy. Figure 1 illustrates the selection process. The clinical characteristics of primary lung lesions [lung lesion location and tumor maximum diameter (TMD)] were collected from the enrolled patients.
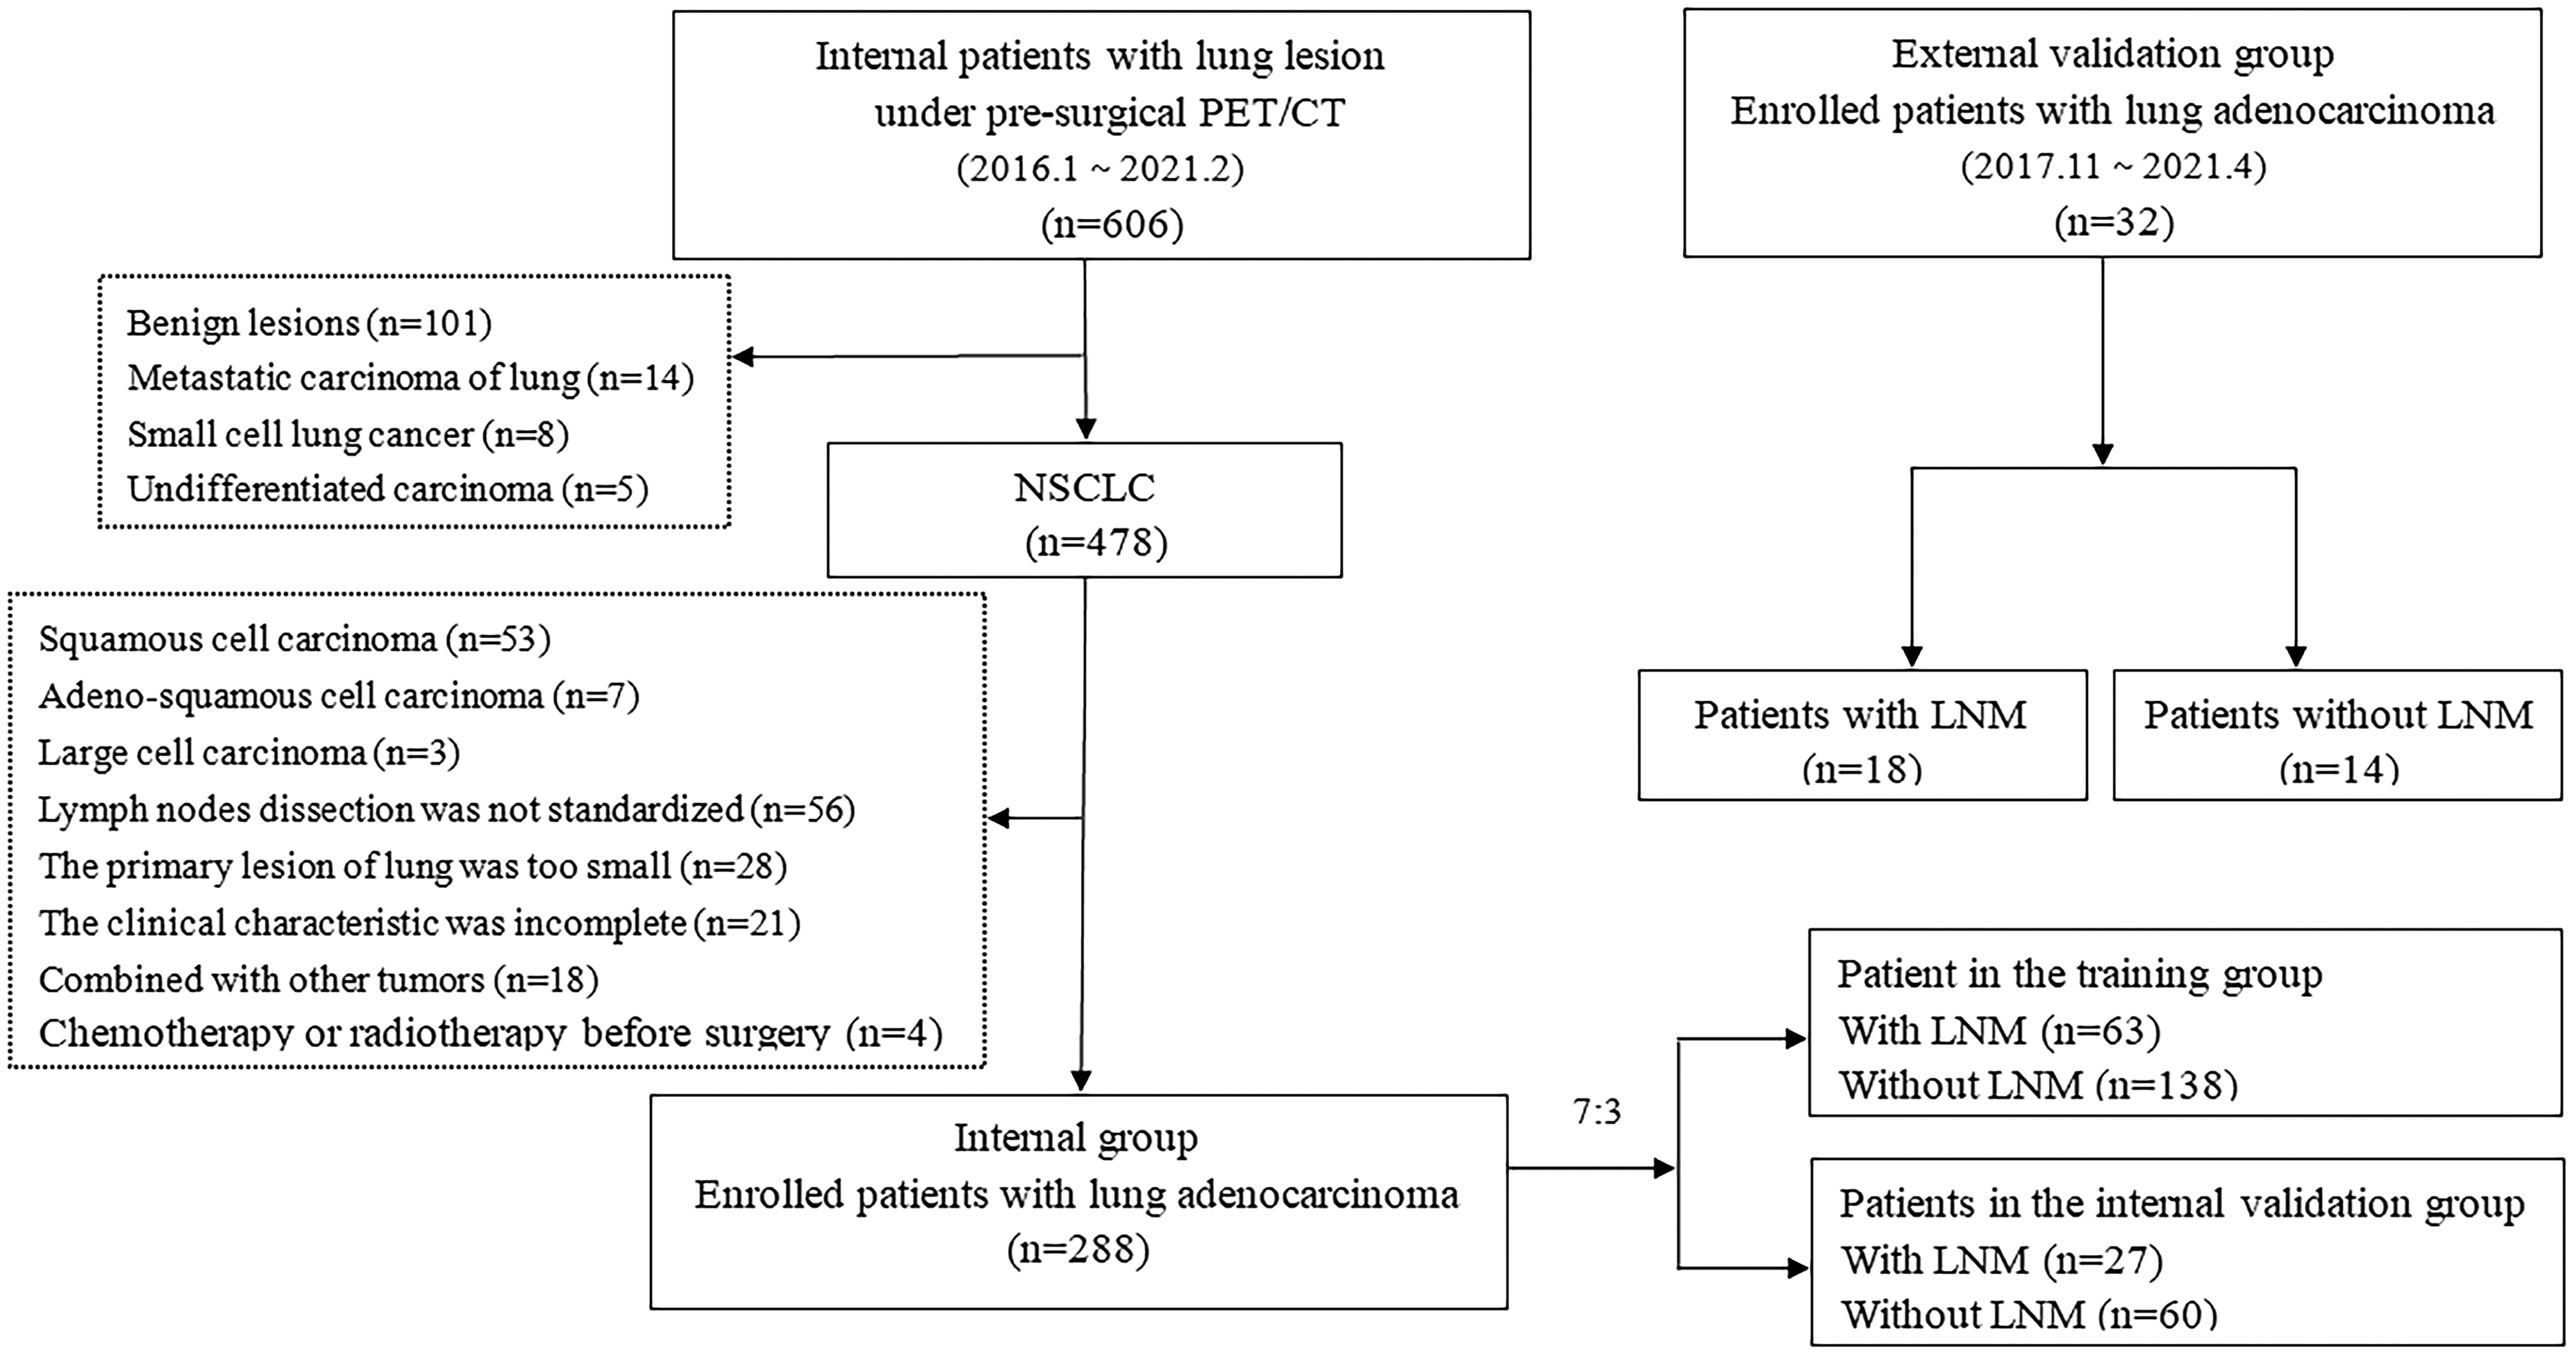
Flowchart of patient selection and grouping.
18 F-FDG PET/CT acquisition and reconstruction
PHILIPS GEMINI GXL16 (216 patients, 75%) and PHILIPS Vereos (72 patients, 25%) scanners from the HBMU PET/CT department were used for 18 F-FDG PET/CT acquisition. Before injecting 18 F-FDG (3.7–5.55 MBq/kg), patients fasted for more than 6 h. PET/CT acquisition was performed 60 ± 5 min after the injection. PET images were attenuated using CT image data, CT fusion display, and corrected PET images. Supplementary Table S1 provides details of the 18 F-FDG PET/CT image acquisition parameters.
Visual evaluation and semiquantitative analyses of PET/CT images
The 18 F-FDG PET/CT images were reviewed separately by two nuclear medicine physicians with more than 10 years of experience. Both readers were blinded to the clinical and pathological findings. The location of mediastinal LNs was recorded according to the American Thoracic Society criteria for LN partitioning. Metabolism, distribution, size, density, and calcification of LNs were comprehensively analyzed to obtain standard visual diagnosis results.
If the results of the two physicians differed, they discussed the findings until a consensus was reached. The semiquantitative parameters of LNs were measured, including SUVmax, average CT value (HUmean), long diameter (LD), short diameter (SD), and ratio of LD to SD (L/S). Differences between semiquantitative parameters of the positive and negative LN groups were compared, and the diagnostic efficacy of the PET image metabolic parameter, SUVmax, for LNM was evaluated.
Image segmentation and radiomic feature extraction
The LIFEx software package (version 6.20), was used to extract the radiomic features of the 18 F-FDG PET/CT digital imaging and communications in medicine (DICOM) images. Spatial resampling was set to 2 mm along the X, Y, and Z axes for PET and CT images. The intensity discretization was normalized. 16 The ROI from the primary lung tumor was semiautomatically drawn by two experienced PET/CT nuclear medicine diagnostic radiologists.
PET and CT images were mismatched for a few (<5%) patients due to respiratory movement, and the manual setting was processed. Overall, 190 radiomic features were automatically processed and extracted, which were connected to 40% of the maximum standardized uptake value (SUVmax) as a threshold. 17 Supplementary Table S2 shows the radiomic features.
Model development and validation
The optimal features were selected to establish a radiomic model in the training group. The radiomic score (rad-score) of each patient was calculated using the radiomic model formula. Simultaneously, clinical characteristic variables were used to build the clinical model.
A complex model was obtained by combining the radiomic features and clinical characteristic variables. A nomogram of the complex model was developed to display the predictive activity of each patient. Calibration curves were generated to determine the prediction accuracy of the nomogram in the training and internal validation groups.
In the training, internal validation, and external validation groups, the receiver operating characteristic (ROC) curve and decision curve analysis (DCA) evaluated the predictive performance and clinical influence in the three models. The sensitivity (SEN), specificity (SPE), accuracy (ACC), positive predictive value (PPV), and negative predictive value (NPV) of the three models estimated the capacity.
Statistical analysis
IBM SPSS Statistics for Windows, version 26 (IBM Corp., Armonk, NY), was used for analysis. Continuous variables, presented as mean ± SD or median and interquartile range, were compared using the independent sample t-test or the Mann–Whitney U test. Categorical variables are presented as counts and analyzed using the chi-square test. Statistical significance was set at p < 0.05 (two-sided).
For the R software (version 4.1.0), the “glmnet” package of the least absolute shrinkage and selection operator (LASSO) binary logistic regression analysis was used to select the optimal radiomic features for modeling the radiomic formula. The “rms” package was used to create the nomogram. The DeLong nonparametric test (MedCalc 19.0) was used to examine differences in the areas of the ROC curves (AUCs).
Results
Patient clinical characteristic and image analyses
In total, 320 patients with lung adenocarcinoma were enrolled from two institutions (288 internal and 32 external cases), including 108 cases with LNM and 212 cases without LNM. Twelve and 308 patients underwent LN biopsy and surgical operation and LN dissection, respectively. There were 212, 32, 69, and 7 patients with pN0, pN1, pN2, and pN3, respectively. For the PET/CT visual evaluation, 129 cases were diagnosed as LNM (including 74 cases of true-positive LNM) and 191 cases were diagnosed as non-LNM (including 34 cases of false-negative LNM).
Significant differences were not observed in age, gender, smoking history, and lung lesion location in the training and validation groups (all p > 0.05). In the training group, the clinical characteristic variable of TMD differed significantly between positive and negative LN status (2.92 vs. 2.33, p = 0.000); and SUVmax (2.79 vs. 1.93, p = 0.000), HUmean (26.09 vs. 33.21, p = 0.000), LD (11.11 vs. 10.94, p = 0.001), SD (9.68 vs. 7.22, p = 0.000), and L/S (1.16 vs. 1.58, p = 0.000) of LNs showed significant differences.
The optimal clinical characteristic parameters of TMD and LN L/S were selected to establish the clinical model. Table 1 shows the clinical characteristics of patients in the training, internal validation, and external validation groups.
Clinical Characteristic Variables of the Enrolled Patients with Lung Adenocarcinoma
According to WHO standards, those who have smoked continuously or cumulatively for more than 6 months in their life shall be considered as smokers.
LN, lymph node; LNM, lymph node metastasis; TMD, tumor maximum diameter; LD, long diameter; SD, short diameter; L/S, ratio of long diameter to short diameter.
Radiomic feature extraction and model development
In the training group, 118 radiomic features were selected using the Mann–Whitney U test. Values of 0.0186 (minλ) were selected as the optimal λ using the LASSO algorithm. Therefore, 10 optimal radiomic features were used to establish the radiomic model (Fig. 2).
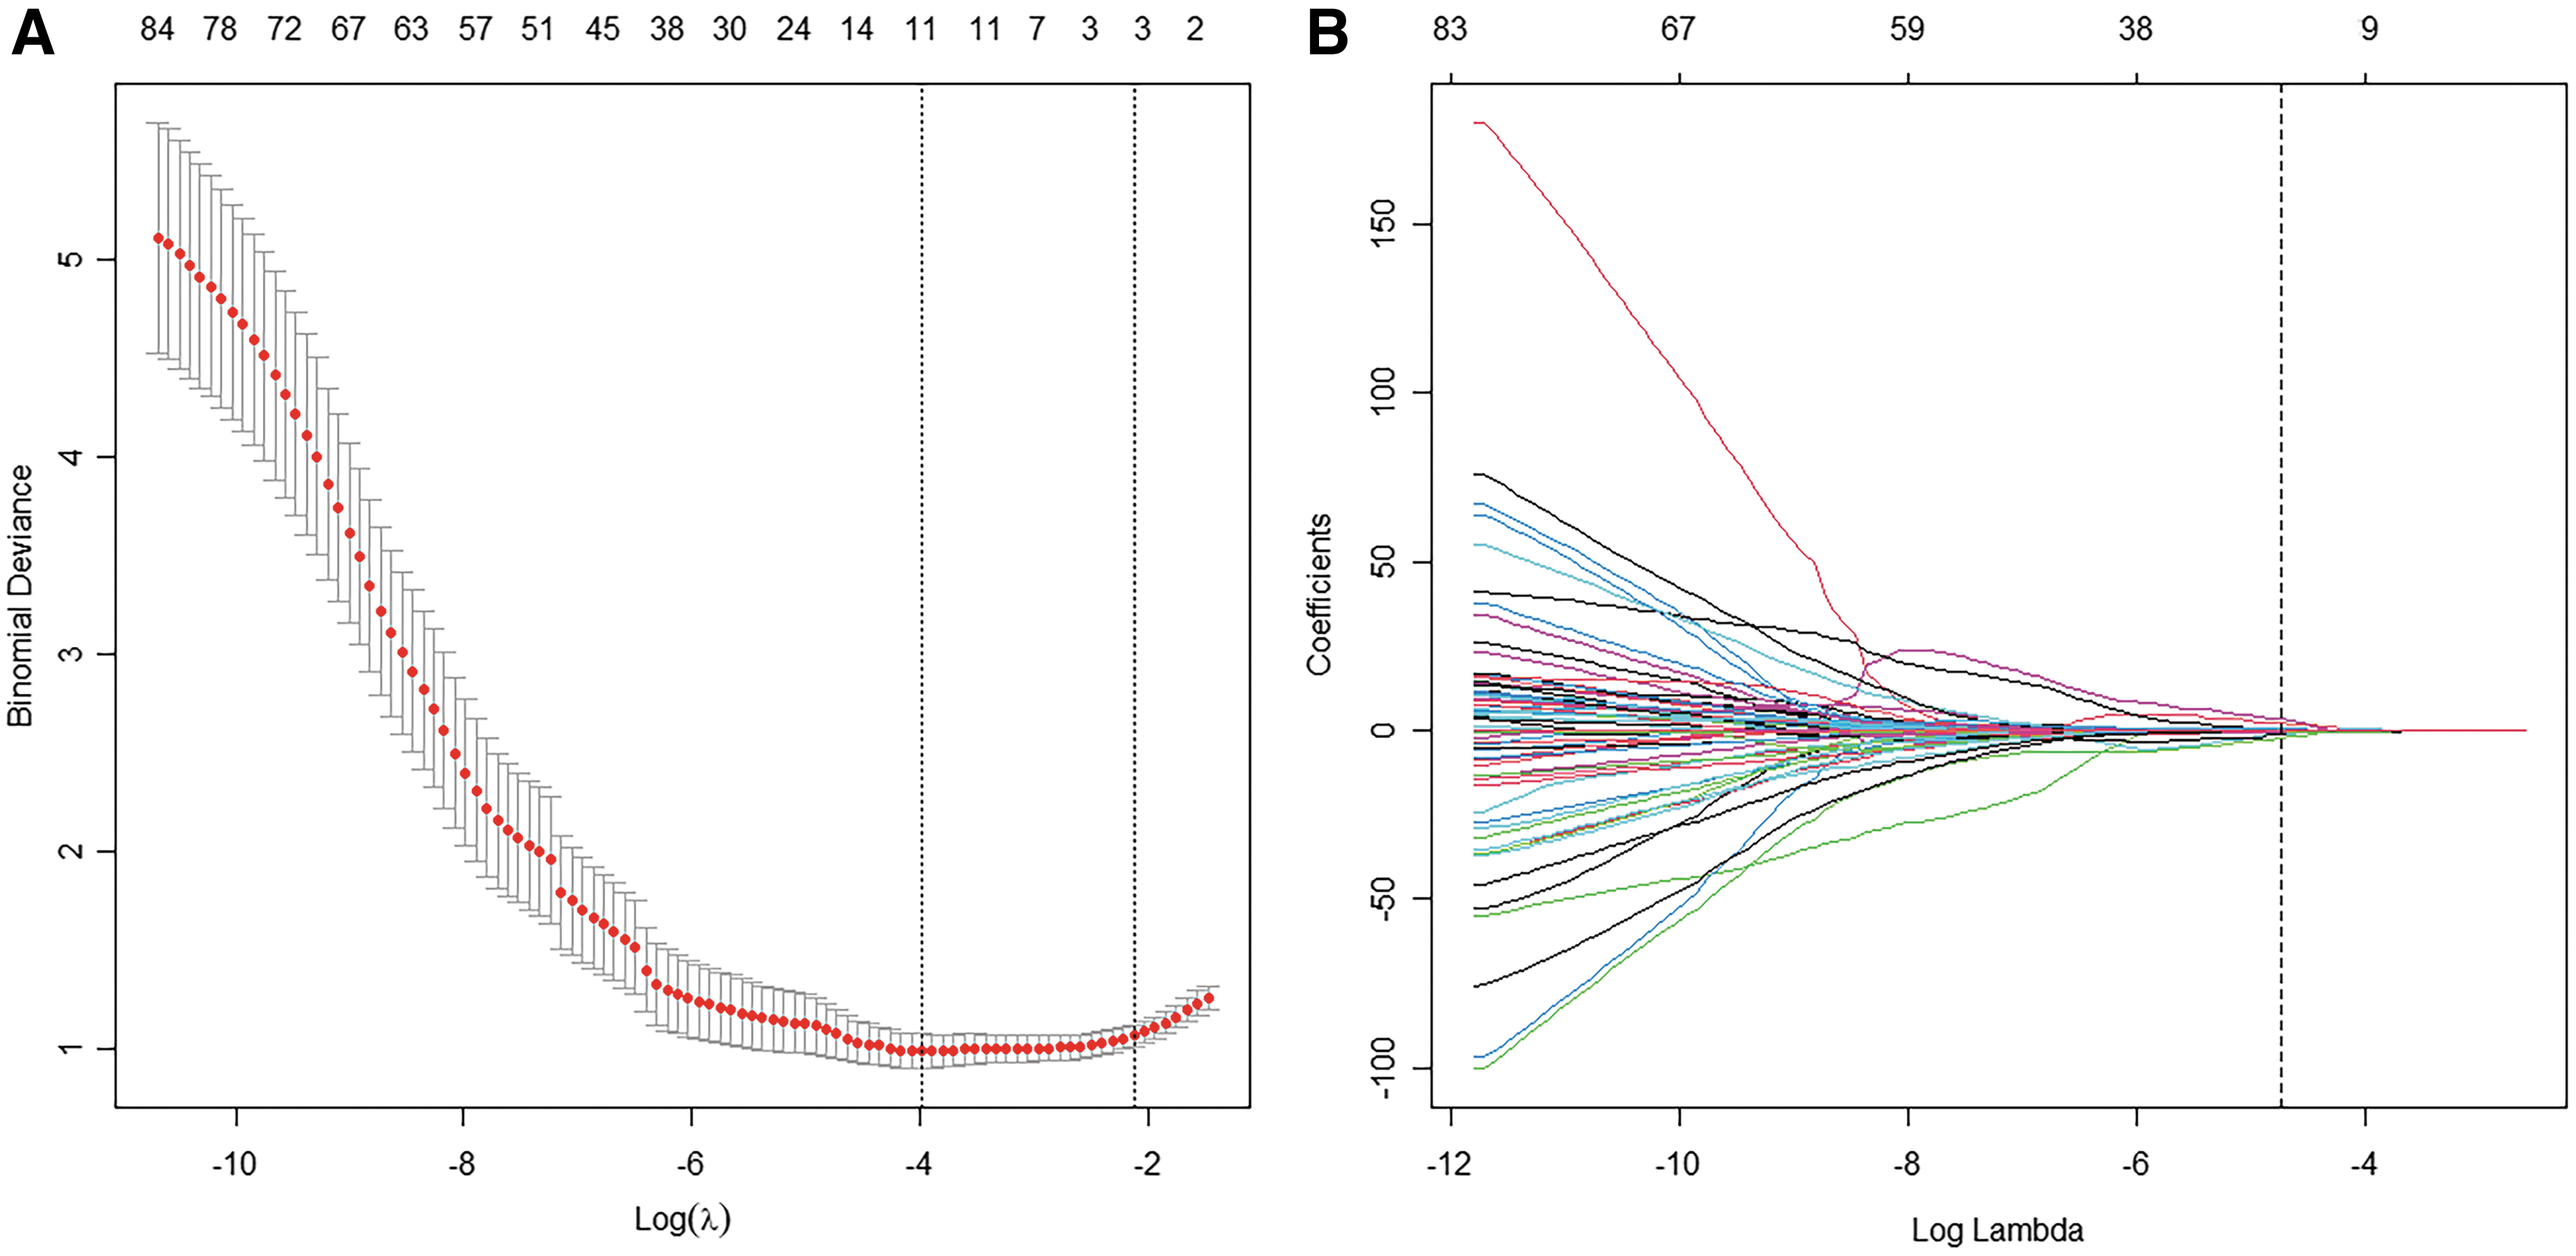
Ten optimal radiomic features were selected using the LASSO algorithm.
Among these, four were PET radiomic features [gray-level run-length matrix _short-run emphasis (GLRM_SRE), GLZLM_zone percentage (GLZLM_ZP), gray-level zone length matrix_short-zone low gray-level emphasis (GLZLM_SZLGE), and GLZLM_zone length nonuniformity (GLZLM_ZLNU)] and six were CT radiomic features [HUKurtosis, HUmin, HUQ3, histogram_skewness (HISTO_Skewness), GLZLM_gray-level nonuniformity (GLZLM_GLNU), and GLZLM_ZLNU]. The rad-score formula is calculated as follows:
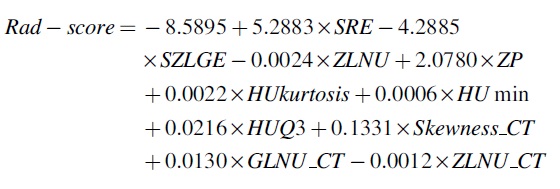
The rad-score in the LNM group was significantly higher compared with the LN without metastasis group in the training (0.005 vs. −1.901, p = 0.000) and internal validation (0.156 vs. −2.203, p = 0.000) groups. All 10 optimal radiomic features differed significantly between the LNM and LN without metastasis groups in the training and internal validation groups (Table 2).
Comparison of 10 Optimal Radiomic Features and Radiomic Scores in Patients With and Without Metastasis
LNM, lymph node metastasis; GLRM, gray-level run-length matrix; SRE, short-run emphasis; GLZLM, gray-level zone length matrix; SZLGE, short-zone low gray-level emphasis; ZLNU, zone length nonuniformity; ZP, zone percentage; HU, heat unit; GLNU, gray-level nonuniformity.
Figure 3 shows the rad-scores of each patient in the two groups as column diagrams. The optimal clinical characteristic parameters (TMD and LN L/S) and rad-score were combined to establish a complex model.
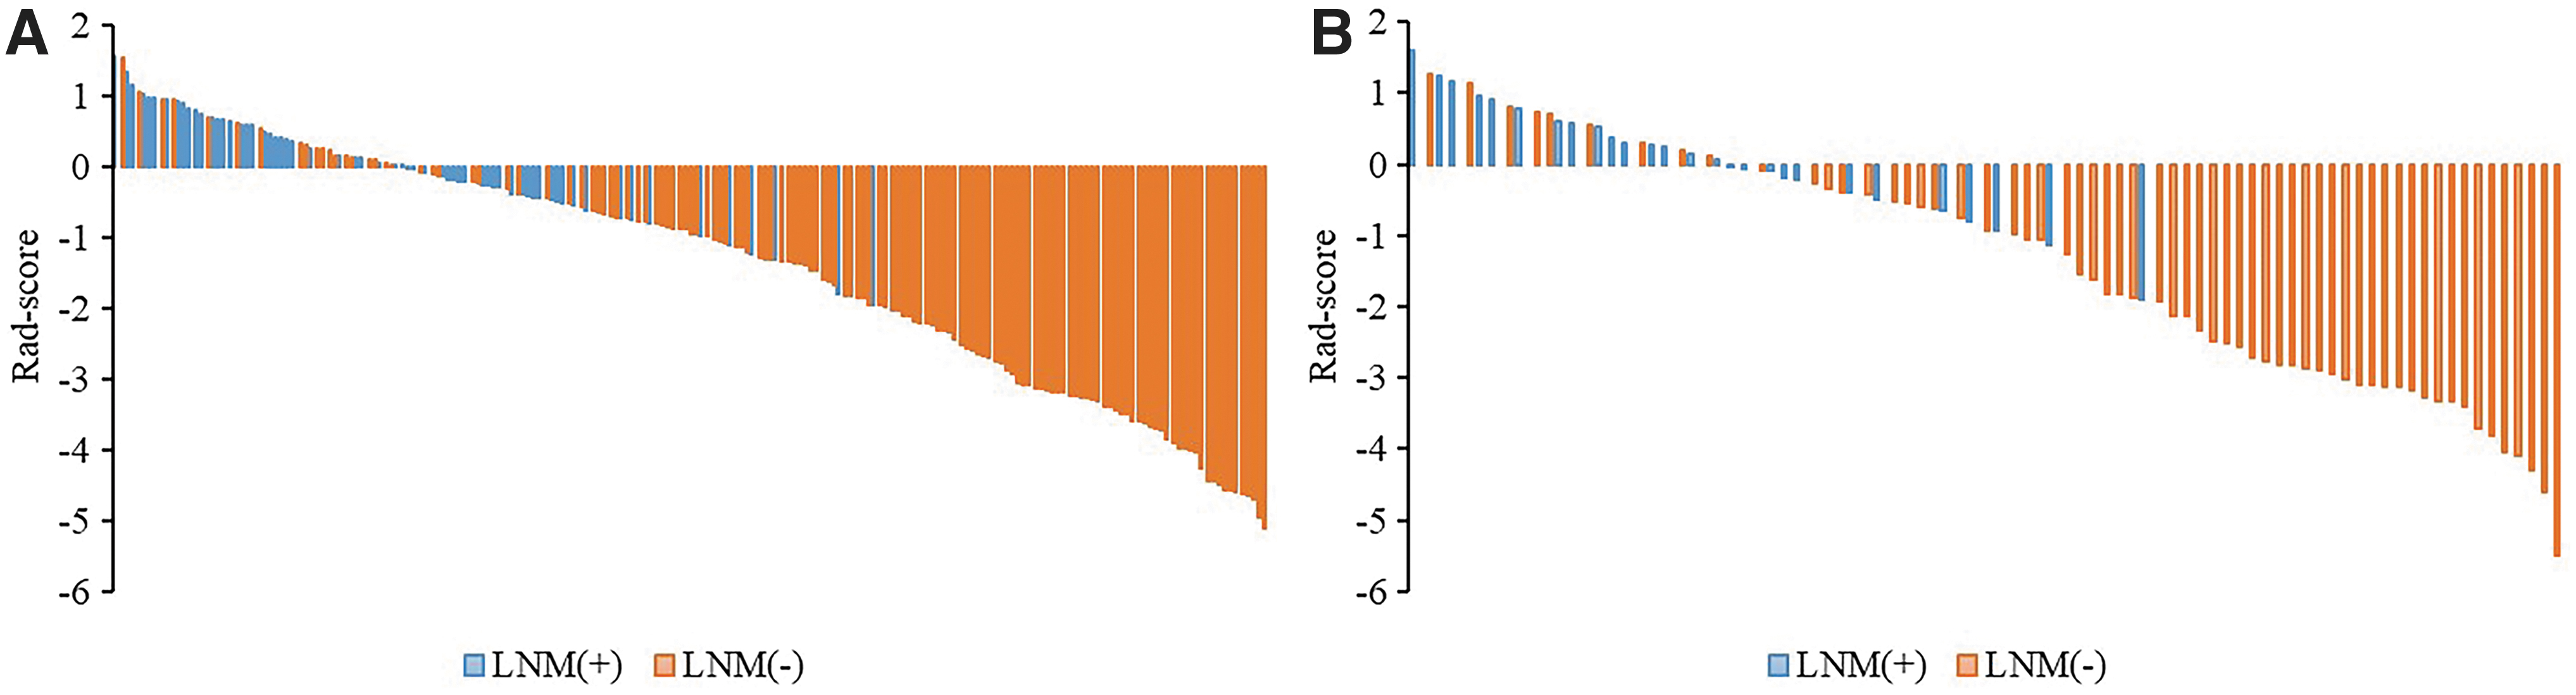
Rad-score column diagrams of patients in the training
Internal validation
In the training group, AUCs of the complex, radiomic, and clinical models were 0.924 [95% confidence interval (CI): 0.887–0.961], 0.863 (95% CI: 0.814–0.912), and 0.838 (95% CI: 0.783–0.894), respectively. The complex model showed better predictive performance than the radiomic (p = 0.001) and clinical (p = 0.000) models. The AUC of the radiomic model was slightly higher than that of the clinical model (0.866 vs. 0.838); however, significant differences were not observed (p = 0.461).
The performance of the complex model in predicting LNM was remarkable [SEN: 0.921 (58/63), SPE: 0.812 (112/138), ACC: 0.846 (170/201), PPV: 0.690 (58/74), and NPV: 0.957 (112/117)]. The specificity of the radiomic model was significantly better than that of the clinical model (0.790 vs. 0.667, p = 0.021). In the internal validation group, AUCs of the radiomic and complex models [0.844 (95% CI: 0.764–0.925) and 0.885 (95% CI: 0.806–0.964)] showed better performance than that of the clinical model (0.821 (95% CI: 0.714–0.928).
The predictive efficiency of the radiomic and complex models was satisfactory [SEN: 0.926 (25/27) and 0.815 (22/27); SPE: 0.667 (40/60) and 0.883 (53/60); and ACC: 0.747 (65/87) and 0.862 (75/87), respectively]. The radiomic–clinical complex model significantly outperformed the radiomic and clinical models alone in the DeLong test (Table 3).
DeLong Test for the Receiver Operating Characteristic Curves of the Three Models
External validation
In the external validation group, AUCs of the radiomic and complex models were higher than that of the clinical model [0.869 (95% CI: 0.721–1.017) and 0.948 (95% CI: 0.879–1.018) vs. 0.792 (95% CI: 0.629–0.954), respectively]. The predictive efficiency of the radiomic model was better than that of the clinical model [SEN: 0.889 vs. 0.778; SPE: 0.857 vs. 0.786]. SEN and SPE of the complex model for predicting LNM were 1.000 (18/18) and 0.786 (11/14), respectively.
Twenty-nine (29/32, 90.6%) cases were correctly predicted, including 18 patients with LNM and 11 patients without LNM. Figure 4A–C shows the ROC curves of the training, internal validation, and external validation groups; Figure 4D–F shows DCAs of the three models. All predictive results are presented in Table 4.
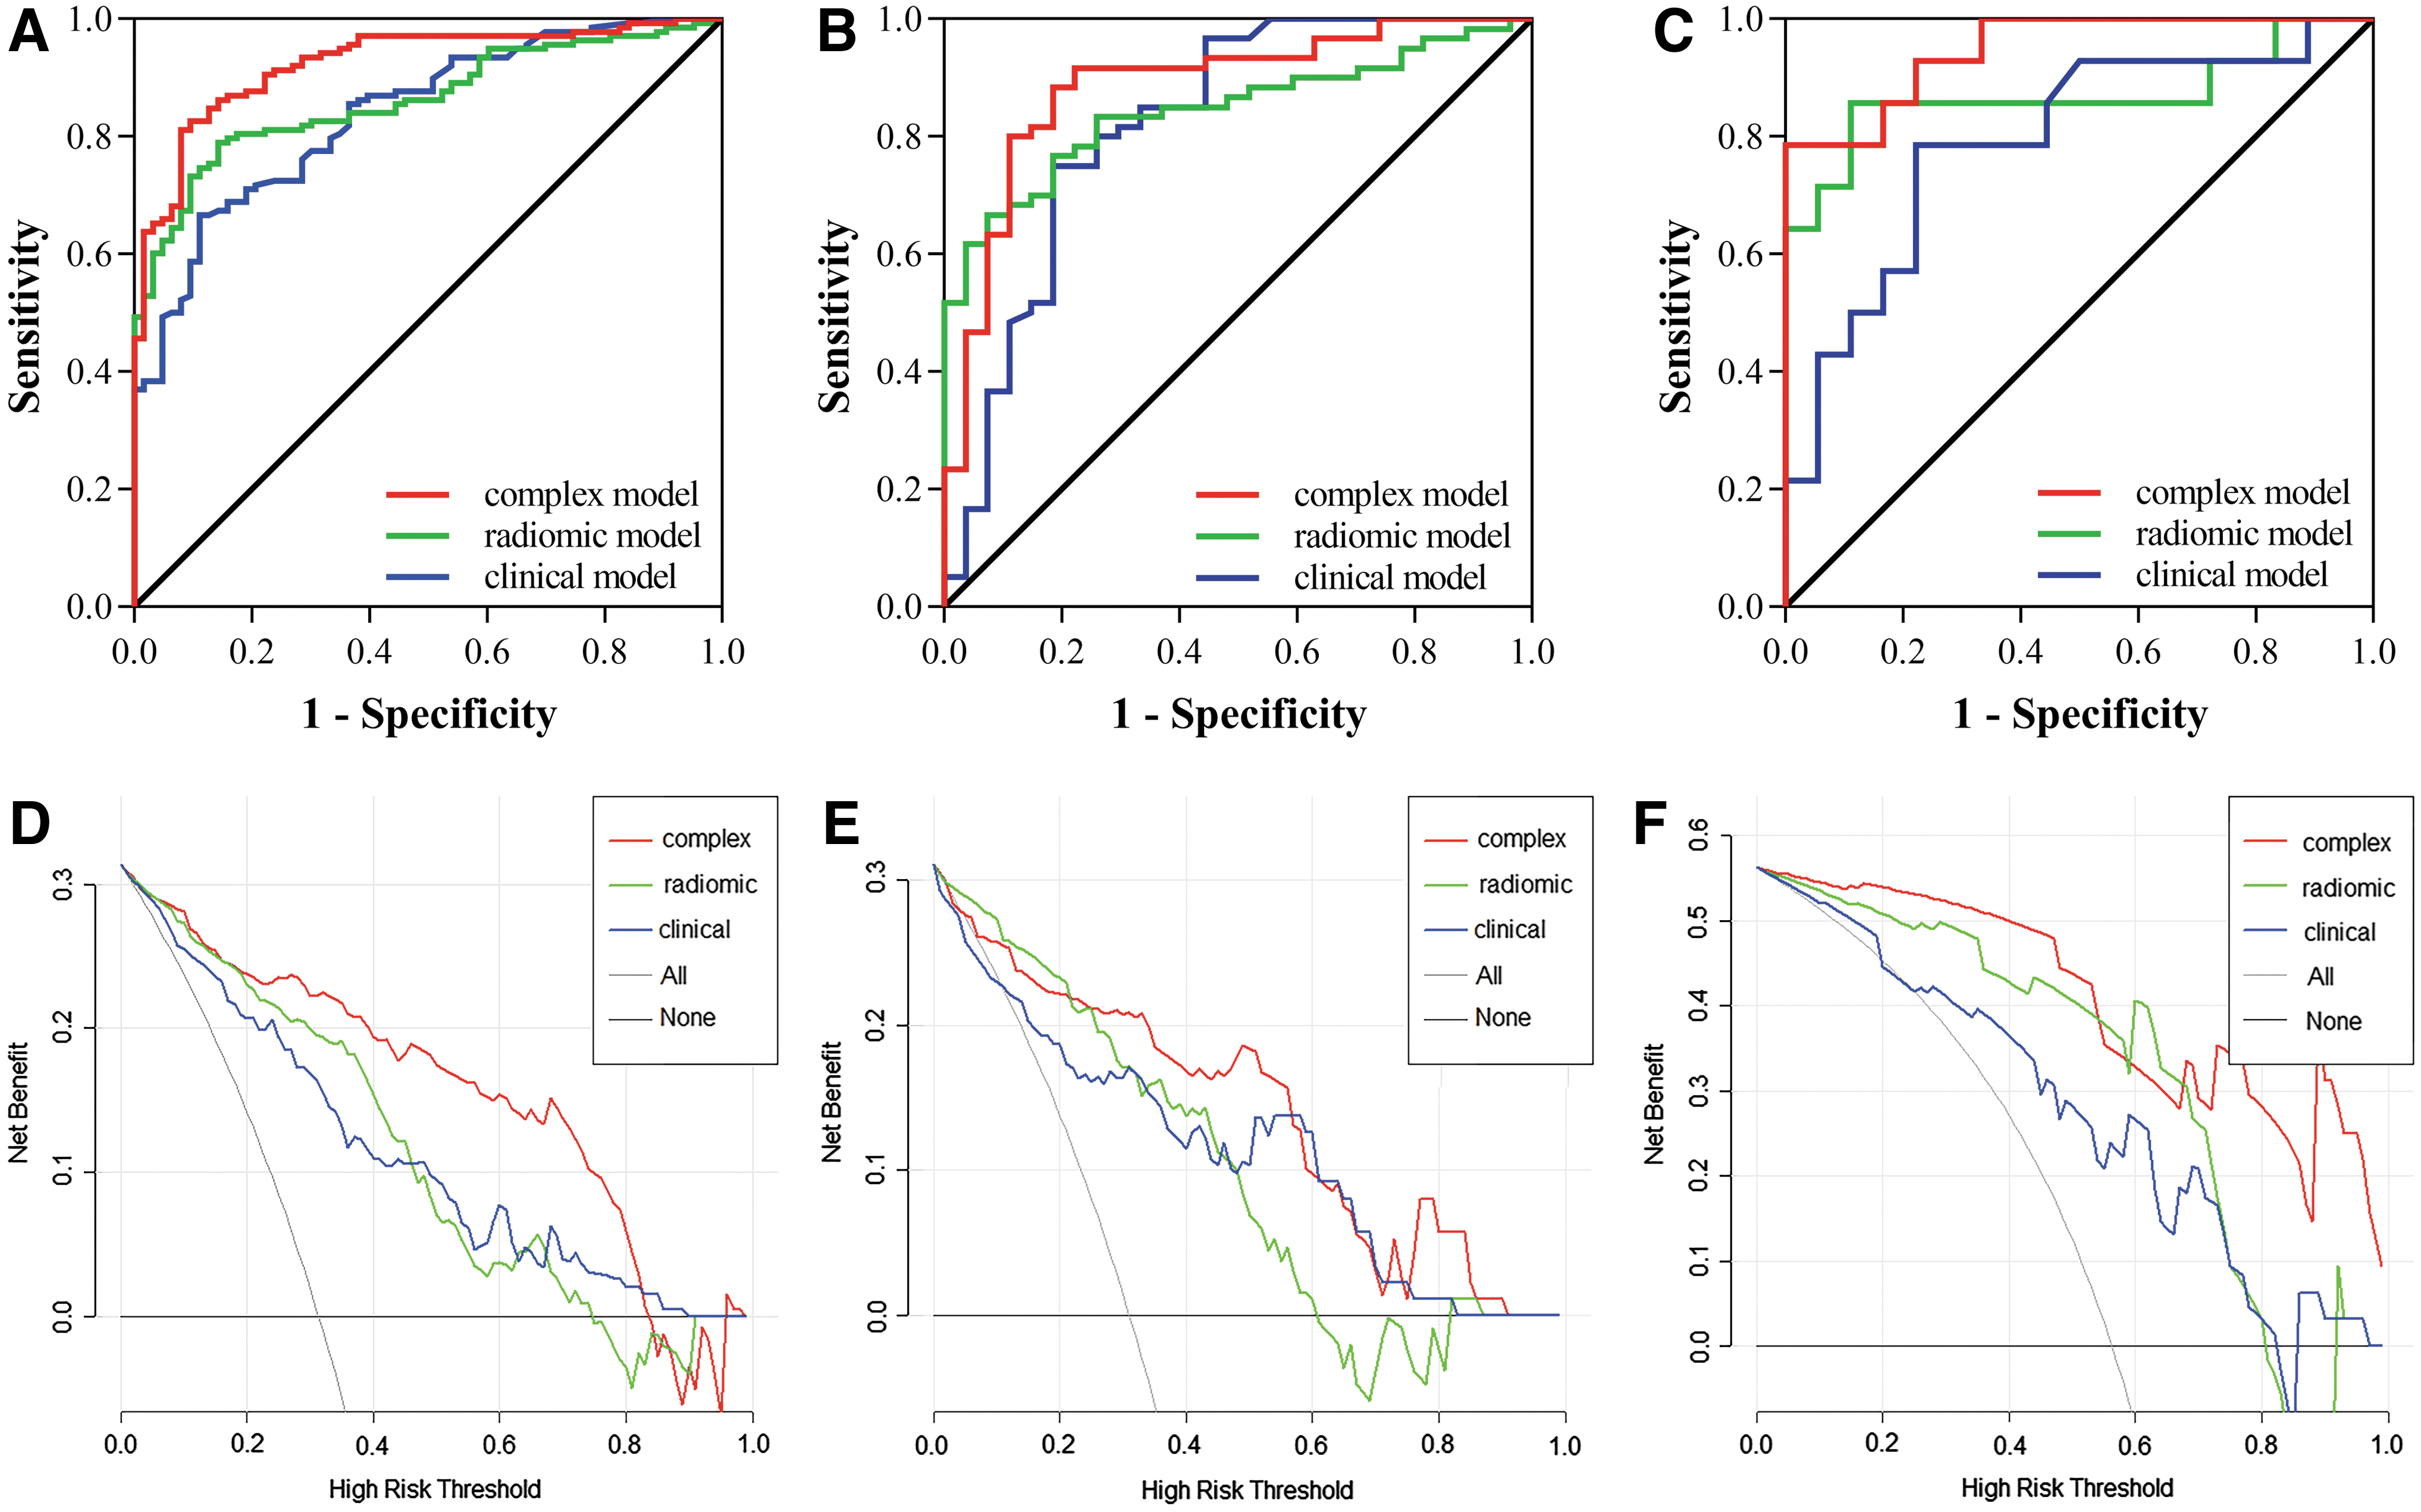
ROC curves of the training
Predictive Performance of Three Models in the Enrolled Patients with Lung Adenocarcinoma
AUC, area under the curve; CI, confidence interval; ACC, accuracy; SEN, sensitivity; SPE, specificity; PPV, positive predictive value; NPV, negative predictive value.
Comparison of PET/CT radiomic model and image analyses
SEN, SPE, ACC, PPV, and NPV of the 201 enrolled patients in the training group undergoing PET/CT visual evaluation for diagnosing LNM were 0.539 (34/63), 0.724 (100/138), 0.667 (134/201), 0.472 (34/72), and 0.775 (100/129), respectively. Analyses of the semiquantitative metabolic parameter, SUVmax, of LNs showed that with the optimal cutoff value of 1.755, the SEN, SPE, ACC, PPV, and NPV for diagnosing LNM were 0.619 (39/63), 0.732 (101/138), 0.697 (140/201), 0.513 (39/76), and 0.808 (101/125), respectively.
SPE and SEN of the PET/CT radiomic model were better than those of visual analyses and SUVmax, and SEN differed significantly between the groups [SEN: 0.857 vs. 0.539, p = 0.000 and 0.619, p = 0.000; and SPE: 0.790 vs. 0.724, p = 0.491 and 0.732, p = 0.676]. The radiomic model corrected 22 false-positive cases and 26 false-negative cases in visual analyses, changing the N stage in 23.9% (48/201) of patients.
Table 5 shows a head-to-head comparison of the performance of the three LN evaluations.
Comparison of the Performance of Visual Evaluation, Semiquantitative Parameter Analysis, and Radiomic Model in 201 Patients with Lung Adenocarcinoma in the Training Group
Nomogram development
The results with accurate prediction in the complex model, a nomogram developed from the training group, could evaluate the rad-score and clinical characteristic variables (TMD and LN L/S) of each patient (Fig. 5A). The training and internal validation groups showed no statistical significance in the Hosmer–Lemeshow test (p = 0.597 and 0.711, respectively). The calibration curves indicated good consistency between predicted and observed values (Fig. 5B, C).
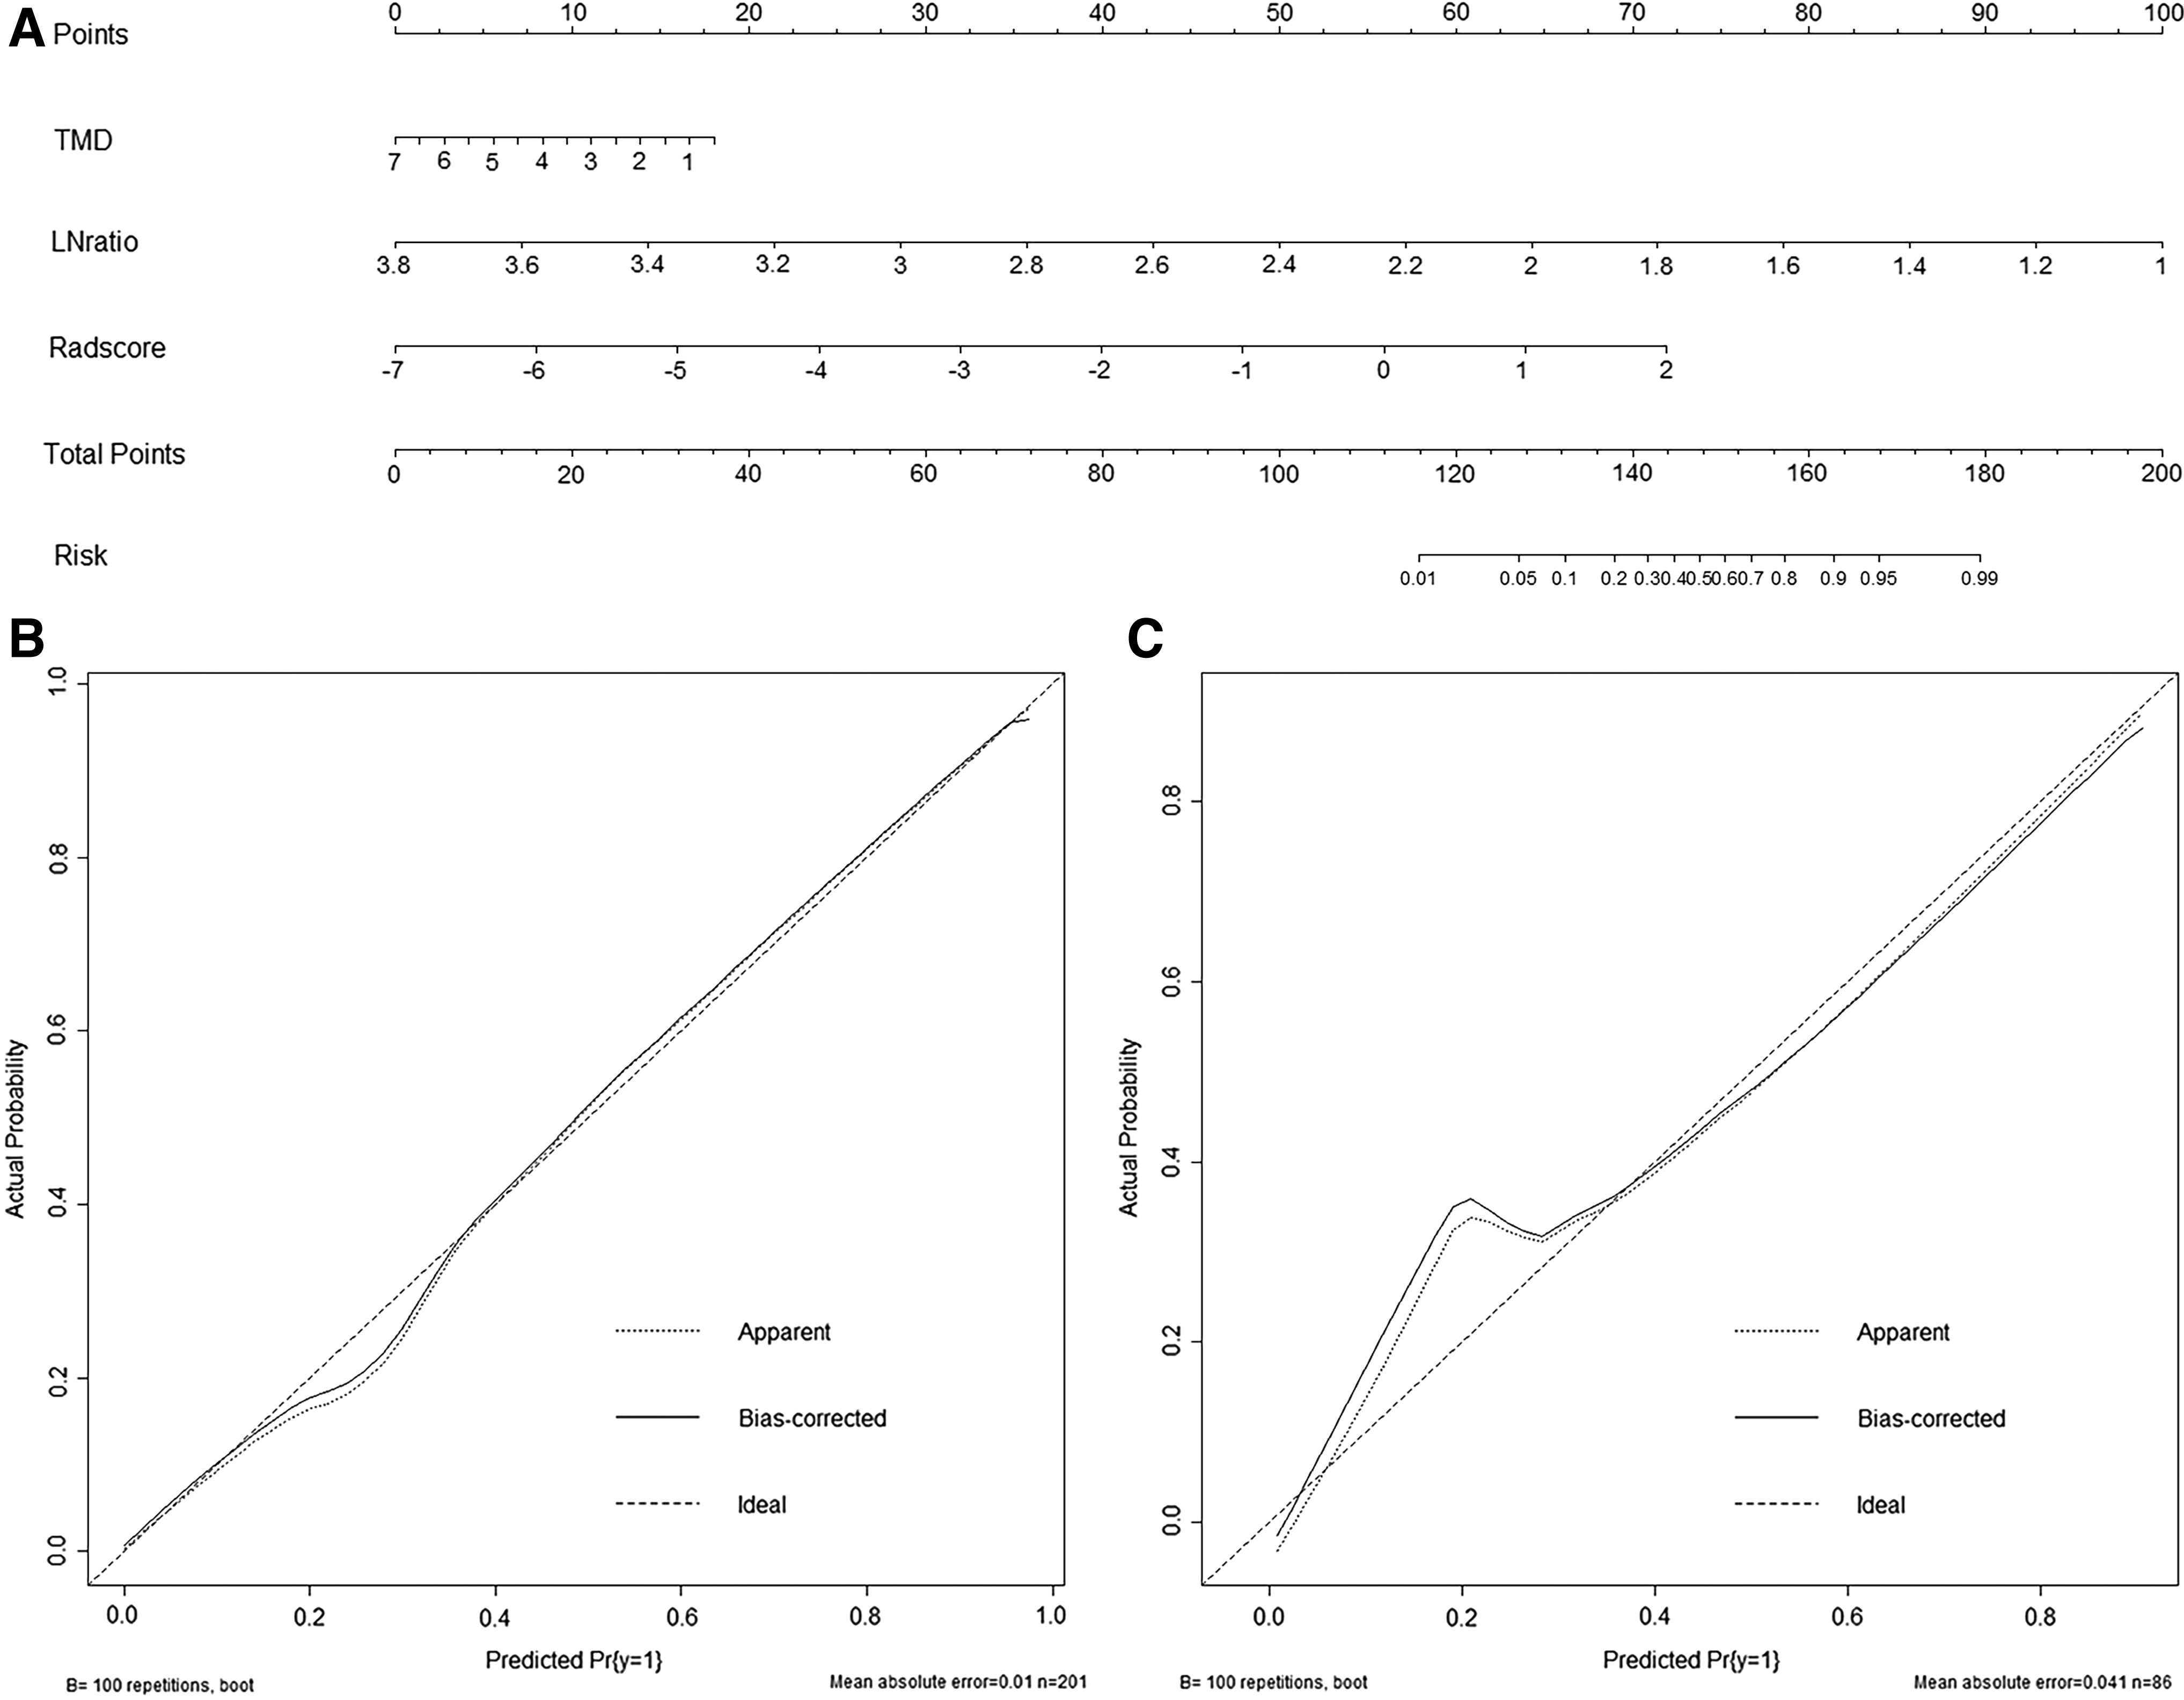
Development and performance of the nomogram. Nomogram
Discussion
18 F-FDG PET/CT showed better accuracy in the clinical staging of lung cancer than CT or MR. Moreover, its SEN and SPE reached 58%–94% and 76%–96%, respectively, in detecting mediastinal LNM. 18 However, some limitations in the diagnosis of false-positive LNs and occult LNM remain. In this study, 18 F-FDG PET/CT radiomics of the primary lung lesion could accurately predict the status of mediastinal LNs in lung adenocarcinoma.
In addition, the complex model based on PET/CT radiomics showed excellent results in the internal (SEN: 81.5%, SPE: 88.3%) and external (100%, 78.6%) validation groups, which were better than that of PET/CT visual evaluation (53.9%, 72.4%) and semiquantitative metabolic parameters of PET images (61.9%, 73.2%).
CT radiomic features can efficiently predict the LNM in patients with NSCLC. 19 -21 Yang et al. 19 established a radiomic nomogram based on CT radiomic features to predict LNM in 159 patients with solid lung adenocarcinoma, and the results showed that AUC values for training and validation groups were 0.871 and 0.856, respectively. Cong et al. 20 developed the venous phase of the contrast-enhanced CT radiomic model, which had the potential for LNM prediction in presurgical patients with stage IA NSCLC, and the AUC value was 0.851.
In addition, PET/CT radiomics have also been used to predict LNM in lung cancer. 22 -24 Zheng et al. 25 built a PET/CT radiomic model using a support vector machine and extremely randomized trees to explore its LNM predictive value in NSCLC. In this study, four PET (SRE, SZLGE, ZLNU, and ZP) and six CT radiomic features were screened using the LASSO algorithm, and five radiomic features were related to GLZLM. GLZLM expresses the size of the homogeneous region for every gray level in a three-dimensional space.
The radiomic texture parameters derived from oncologic images have the potential to act as imaging correlates for tumor hypoxia and angiogenesis. 26 The predictive model combined PET and CT radiomic features of the patients with lung adenocarcinoma showed well performance in predicting LNM, with the AUC of 0.863 in the training group.
Some previous studies focused only on the PET/CT radiomic features to build models. 22,23 In this study, TMD and LN L/S showed significant differences in the establishment of a clinical model compared with other clinical characteristics and showed good performance results in predicting LNM. The results were partly consistent with those of Yang et al. 19 ; however, clinical characteristic variables were not combined in their study model.
The role of TMD in predicting LNM in lung adenocarcinoma has been confirmed. The AUC value of the complex model based on PET/CT radiomic features was 0.94 (95% CI: 0.86–0.97). 27 Chang et al. 28 developed a complex model with 10 PET/CT radiomic features and clinical characteristic variables, which included CEA and some clinical features of primary lesions. The results showed that the location of the primary lung lesion was an independent risk factor for predicting LNM in lung adenocarcinoma. However, in this study, it was not significantly correlated with LNM, possibly due to the large diameter range of primary lung lesions among the enrolled patients.
Ouyang et al. 29 added the LN size and CT mean to the predictive model construction, but used radiomic features of extracted LNs to construct the model in their study. The results of this study showed that LN L/S was an independent predictor of LNM in lung adenocarcinoma. Compared with the other characteristic variables, LN L/S was more stable and not easily affected by the clinical stage.
Although only 32 patients with lung adenocarcinoma were enrolled in the external validation group, preliminary study results showed that SEN and ACC of the complex model based on 18 F-FDG PET/CT radiomics were 100% (18/18) and 90.6% (29/32), respectively, which played an important auxiliary role in clinical treatment decision-making. In future studies, the authors aim to increase the number of patients in the external validation to further confirm the results of this study.
In this study, the radiomic and complex models showed high SPE, while the complex model showed relatively higher SEN, which may be related to the clinical stage of the enrolled patients. All internal group patients underwent complete primary lung lesion surgery and systematic LN dissection. Most patients were in stages I–III—mainly in stage I, and nearly two-thirds of patients were at N0. There were more negative than positive LNs, and radiomic features can better identify negative LNs, resulting in high SPE of the model.
The complex model, which combined the primary lung lesion (TMD) and LN clinical characteristics (L/S), showed advantages in prediction of positive LNs and further improved the SPE. When the number of patients with LNM in lung adenocarcinoma increased in the external validation group, the model still proved to have high predictive efficiency, demonstrating its universal applicability.
Furthermore, the developed visual nomogram could provide supplementary information for images, calculate the probability of the individual LNM in each patient, improve the diagnosis before clinical treatment, and play a role in differential diagnosis. This method is noninvasive, convenient, and easy to implement. By combining the advantages of microscopic radiomic features and macroscopic clinical features, this method is expected to enable more patients to obtain more accurate N staging before surgery or treatment in the future, avoid unnecessary surgery for some patients, improve current treatment strategies, and benefit more patients.
Nevertheless, the present study had several limitations. This was a retrospective study. Selection bias in patient enrollment is possible in this study since most patients who underwent surgery were at an early stage with metastasis of only a few or even isolated occult LNs. Therefore, further studies with larger sample sizes and more patients with advanced lung adenocarcinoma are necessary to address this issue.
Moreover, only the structural information of LNs was combined to develop the prediction model, but the PET/CT radiomic features of LNs were not extracted into the present study. It may be more promising to combine radiomic features of primary lung lesions and LNs. Furthermore, although the predictive model was initially validated in external patients, the sample size was small and prospective studies with large numbers of patients at multiple centers should be conducted.
Finally, the LNM condition could affect the treatment and prognosis of patients; therefore, it is necessary to continue to follow-up patients and establish a survival and prognosis predictive model for patients with lung adenocarcinoma.
Conclusions
The authors analyzed the radiomic features extracted from primary lung lesions and developed an 18 F-FDG PET/CT-based radiomic model that was externally validated. 18 F-FDG PET/CT radiomics, especially the complex model that combines primary lung lesion and LN visual features, improved the predictive power of mediastinal LNM in lung adenocarcinoma.
Ethical Approval
This retrospective analysis was approved by the Institutional Review Board of the Fourth Hospital of Hebei Medical University (No.2020ky339) and the requirement for informed consent was waived.
Footnotes
Acknowledgments
The authors thank all the coworkers involved in the study for their support and assistance.
Disclosure Statement
The authors declare that the research was conducted in the absence of any commercial or financial relationships that could be construed as potential conflicts of interest.
Funding Information
This work was financially supported by the Health Commission Foundation of Hebei Province (No.20210720) and the Hebei Medical Applicable Technology Tracking Project (No.GL2011-52).
Supplementary Material
Supplementary Table S1
Supplementary Table S2
References
Supplementary Material
Please find the following supplemental material available below.
For Open Access articles published under a Creative Commons License, all supplemental material carries the same license as the article it is associated with.
For non-Open Access articles published, all supplemental material carries a non-exclusive license, and permission requests for re-use of supplemental material or any part of supplemental material shall be sent directly to the copyright owner as specified in the copyright notice associated with the article.