
Abstract
Objective:
Colorectal cancer (CRC) is the leading cause of mortality worldwide. Growing evidence suggests that the current pathological staging system is inadequate for efficient and accurate prognosis. In this study, we aim to build a prognosis model to predict the survival outcome of CRC patients by using gene expression profiles from The Cancer Genome Atlas (TCGA).
Materials and Methods:
Univariate and multivariate Cox regression analysis were used to assess the relationship between clinical factors and P4HA1 expression regarding the prognosis of patients with colon adenocarcinoma (COAD). The least absolute shrinkage and selection operator (LASSO) Cox regression model was used to select prognostic differential expression genes (DEGs) for the construction of prognostic risk score model. Kaplan–Meier and receiver operating characteristic (ROC) survival analysis were used to assess the performance of the model on both TCGA cohort and an independent dataset GSE39582.
Results:
Overexpression of P4HA1 was confirmed to be associated with poor clinical outcome of colon cancer patients in both TCGA and GSE39582 cohorts. Using the TCGA cohort, we identified 1528 DEGs related to elevated P4HA1 expression, and we established a 11-gene panel to construct the prognostic risk score model by LASSO Cox regression analysis based on their expression profiles. The 11-gene signature was further validated in the independent dataset GSE39582. Time-dependent ROC curves indicated good performance of our model in predicting 1, 2, and 3-years overall survival in COAD patients. Additionally, gene set enrichment analysis indicated that the 11-gene signature was related to pathways involved in tumor progression.
Conclusions:
Together, we have established a 11-gene signature significantly associated with prognosis in COAD patients, which could serve as a promising tool for clinical application in the future.
Introduction
Colorectal cancer (CRC) is the third most common malignancy worldwide, 1 and one of the major subtypes of CRC is colon adenocarcinoma (COAD). Even though the 5-year survival rates have recently increased, it is still ranked as the second leading cause of mortality in the United States. 2 In 2021, ∼149,500 individuals were projected to be diagnosed with CRC and 53,200 would die from the disease, including 17,930 cases and 3,640 deaths in individuals younger than 50 years. 3 Curative treatment of CRC involves surgery resection, radiation, and local ablation. And the likelihood of successful treatment relied heavily on early diagnosis. Recent advances in treatment have considerably improved the prognosis for CRC patients. 4 Currently tumor staging represents the most important prognostic predictor of clinical outcome for patients with colorectal carcinoma. However, determination of late stages (e.g., T4a and T4b) of disease can be problematic due to the complexity of the disease progression. Therefore, developing better models for risk assessment, diagnosis, and prognosis has become an urgent need for managing CRC, which requires a systematic catalog of the molecular screening to identify candidate diagnosis or prognosis markers.
Fortunately, recent advances in next-generation sequencing technologies such as RNA-seq have greatly increased the capability for simultaneously detecting large number of molecules, enabling us to study the gene expression in an unbiased manner. Large consortiums such as The Cancer Genome Atlas (TCGA) have since published genome-wide transcript level quantifications, in a range of primary tumors. In addition, bioinformatic tools and statistic models enable the researchers to rapidly analyze genes of interest in the context of clinical and other molecular data, both within and across tumor types. Taken together, these resources and tools have largely facilitated the discoveries of biomarkers in various types of cancer and their clinical applications. Actually, numerous models for cancer prognosis have been reported leveraging on the accessibility of the large pool of gene expression profiles. Kirschner et al. reported a six-microRNA signature to predict the survival of malignant pleural mesothelioma patients. 5 A prognostic model composed of 12 genes was constructed for risk stratification and overall survival (OS) prediction in hepatocellular carcinoma patients. 6 Recently, several studies have investigated the tumor markers associated with CRC recurrence and survival of CRC patients. 7,8 Biomarkers for CRC metastasis was identified based on the analysis of gene expression of primary CRC sample and live metastasis. However, most of these studies only focused on immune-related genes.
Prolyl-4-hydroxylase (P4H) is of great significance for collagen biosynthesis. Previous evidence indicated that elevated P4HA1 expression was related to poor prognosis in some solid tumors, such as pancreatic cancer, head and neck cancer, high-grade gliomas, and lung cancer. 9 –12 P4HA1 has been implicated to play oncogenic function in CRC as well. Knockdown of P4HA1 led to decreased cell proliferation, invasion, and migration and inhibited tumor growth in addition to metastases in colon cancer cell lines. 13 Moreover, high expression of P4HA1 protein was an independent poor prognostic marker for patients with early stage CRC. 14 However, the underlying mechanism of P4HA1 resulting in unfavorable clinical outcome remains unclear.
In this study, we identified the differential expression genes (DEGs) related to P4HA1 and then established a prognostic model upon the expression of these DEGs to effectively predict patients' survival in CRC.
Materials and Methods
Data acquisition
The gene expression profiles and corresponding clinical records of COAD patients in TCGA cohort were downloaded from University of California Santa Cruz (UCSC) Xena browser. The dataset contains RNA-seq data from 458 COAD tumor tissues and 41 normal tissues. Among those, 440 tumor samples have complete clinical characteristics from the patients. The gene expression profiles of the GEO cohort (GSE39582) were downloaded from GEO website (
Survival analysis and stromal/immune scores analysis
COAD patients with complete annotation of clinical outcome from TCGA cohort was classified into two groups with either high or low P4HA1 expression. Kaplan–Meier estimator was utilized to estimate the survival function. The curve was created using the survival and survminer packages in R. ESTIMATE algorithm was used to calculate the stromal/immune scores on the basis of unique expression profiles of stromal/immune cells by the ESTIMATE package in R. To probe into the clinical significance of stromal/immune scores, we analyzed the correlation between clinical characteristics (including P4HA1 expression and risk score) and stromal/immune scores.
Differential gene expression analysis
Differential expression analysis was performed on the two groups using limma R package. DEGs were selected with the condition of fold change >|±1.5|, false discovery rate (FDR) (adjusted p-values, Benjamini-Hochberg) <0.05. The results were visualized on the volcano plot.
Gene set variation analysis
Gene set variation analysis (GSVA) method was applied to identify the differential activation of functional related gene sets. Briefly, GSVA transformed the gene by sample matrix to a gene set by sample matrix through a nonparametric, unsupervised manner. Empirical Bayes moderated t statistics was calculated and gene sets with p < 0.05 was considered significantly between samples with high and low P4HA1 expression. The GSVA analysis was performed using GSVA package in R on MSigDB gene sets associated with cell migration. Unsupervised clustering of samples and gene sets in heat maps was performed using the ggplot2 package in R using a Euclidean distance metric and complete-linkage clustering.
Construction of the risk score model
A total of 440 COAD patients from TCGA cohort were randomly separated into either training or testing set with the same sample size. The training set was used for risk score model construction. The testing set and the whole cohort (sum) were used for model validation. An external validation set, GSE39582 was also included. Univariate Cox regression analysis was performed to identify the genes associated with significant prognostic value. Feature selection was achieved by least absolute shrinkage and selection operator (LASSO) analysis, which further reduces multicollinearity and minimizes the overfitting in the model. R package glmnet was used for the LASSO Cox regression analysis, which yields a series of lambda and models. The optimal model was chosen based on the 1000-fold cross-validation with the most suitable lambda. Using the function lambda.min, gene features with non-zero LASSO coefficients were obtained. The risk score was calculated as the linear combination of the expression of each gene feature multiplied by the LASSO coefficient as follows: Risk score = 0.1837*MIR210HG −0.012*SLC4A7 − 0.3793*CDCA2 + 0.1394*C5orf46 + 0.0942*DAPK1 + 0.1093*HOXC6 + 0.0587*TNNT1 + 0.0574*ULBP2 + 0.0555*SERPINE1 − 0.3773*WFDC21P+0.1357*FOXD1.
Validation of risk score model
The validation of the risk score model was carried out on the testing, sum, and external validation sets independently. Risk score of each patient was calculated using our predictive model. The patients were then classified into either high or low risk score groups using median risk score as cutoff. Kaplan–Meier curves was utilized to estimate the survival probability. Receiver operating characteristic (ROC) curves were drawn and the area under the curve (AUC) was calculated to predict 1-year, 2-year and 3-year survival rates. The correlation between clinical characteristics (including stromal/immune scores, age, gender, and pathologic stage and status) and the risk score was assessed to determine the predictive power of the risk score model.
Gene set enrichment analysis
Gene set enrichment analysis (GSEA) analysis was performed and visualized between the high- and low-risk group by using ClusterProfiler package in R on gene sets from MSigDB. 15 The significant pathways were identified with threshold setting as |NES| (normalized enrichment score) >1, nominal (NOM) p < 0.05 and FDR q < 0.05 after performing 1000 permutations.
Statistical analysis
Normality test was performed using Shapiro–Wilk test. Then to evaluate the statistically significant differences between two groups, either unpaired t test or Wilcoxon test were applied for data that follows or does not follow normal distribution, respectively. For multiple groups one-way analysis of variance (ANOVA) or the nonparametric Kruskal–Wallis test were used to determine the significance. pROC was used to create the ROC curves and compute the AUC. Time-dependent ROC curves were created using R package timeROC. Kaplan–Meier estimator was utilized and visualized to estimate the survival curve. Statistical significance was determined by log rank test between the comparison of two groups. All survival curves were created using R package of survminer. The heatmaps were depicted using R package pheatmap. All analysis was performed in R version 3.6.1. All the tests were two-sided and p-values <0.05 were considered statistically significant.
Results
Expression of P4HA1 is significantly elevated in COAD and associated with poor clinical outcome
P4HA1 has been implicated to regulate tumor growth, invasion, and metastasis in multiple cancer types. 16 –18 However, its role in COAD prognosis remains unknown. By analyzing the expression profiles of 458 COAD tumor and 41 normal tissue samples from TCGA dataset, we found that the expression level of P4HA1 is significantly elevated in COAD (p < 0.001, Fig. 1A). We then ran the same analysis on an independent cohort (GSE39582), which contains 566 COAD and 19 normal tissue samples. The high expression of P4HA1 in COAD was further confirmed in this dataset (p = 0.001, Fig. 1C), suggesting that P4HA1 may be universally overexpressed in COAD. We thus sought to investigate whether the expression level of P4HA1 correlates with any clinical outcomes. Patients with integrated OS data of the two independent cohorts were classified into the high and low P4HA1 expression groups. Kaplan–Meier survival analysis revealed that COAD patients with low expression of P4HA1 have significantly higher survival rates (Fig. 1B, D), indicating P4HA1 could be a promising prognostic marker for COAD. Besides the expression level of P4HA1, we also studied the correlation between COAD prognosis and six other clinicopathological factors [including age, gender, and multiple variables in pathologic staging (Table 1)] by univariate Cox regression analysis. The results revealed that prognosis was significantly related to cancer stage (p < 0.001), including pathologic T (p = 0.005), pathologic M (p < 0.001), and pathologic N (p < 0.001). Additional multivariate analysis of these variables further confirmed that there were three prognostic factors independently impacting the survival in the TCGA cohort of COAD patients. They are stage (p = 0.006), pathologic T (p = 0.044), and pathologic M (p < 0.001).
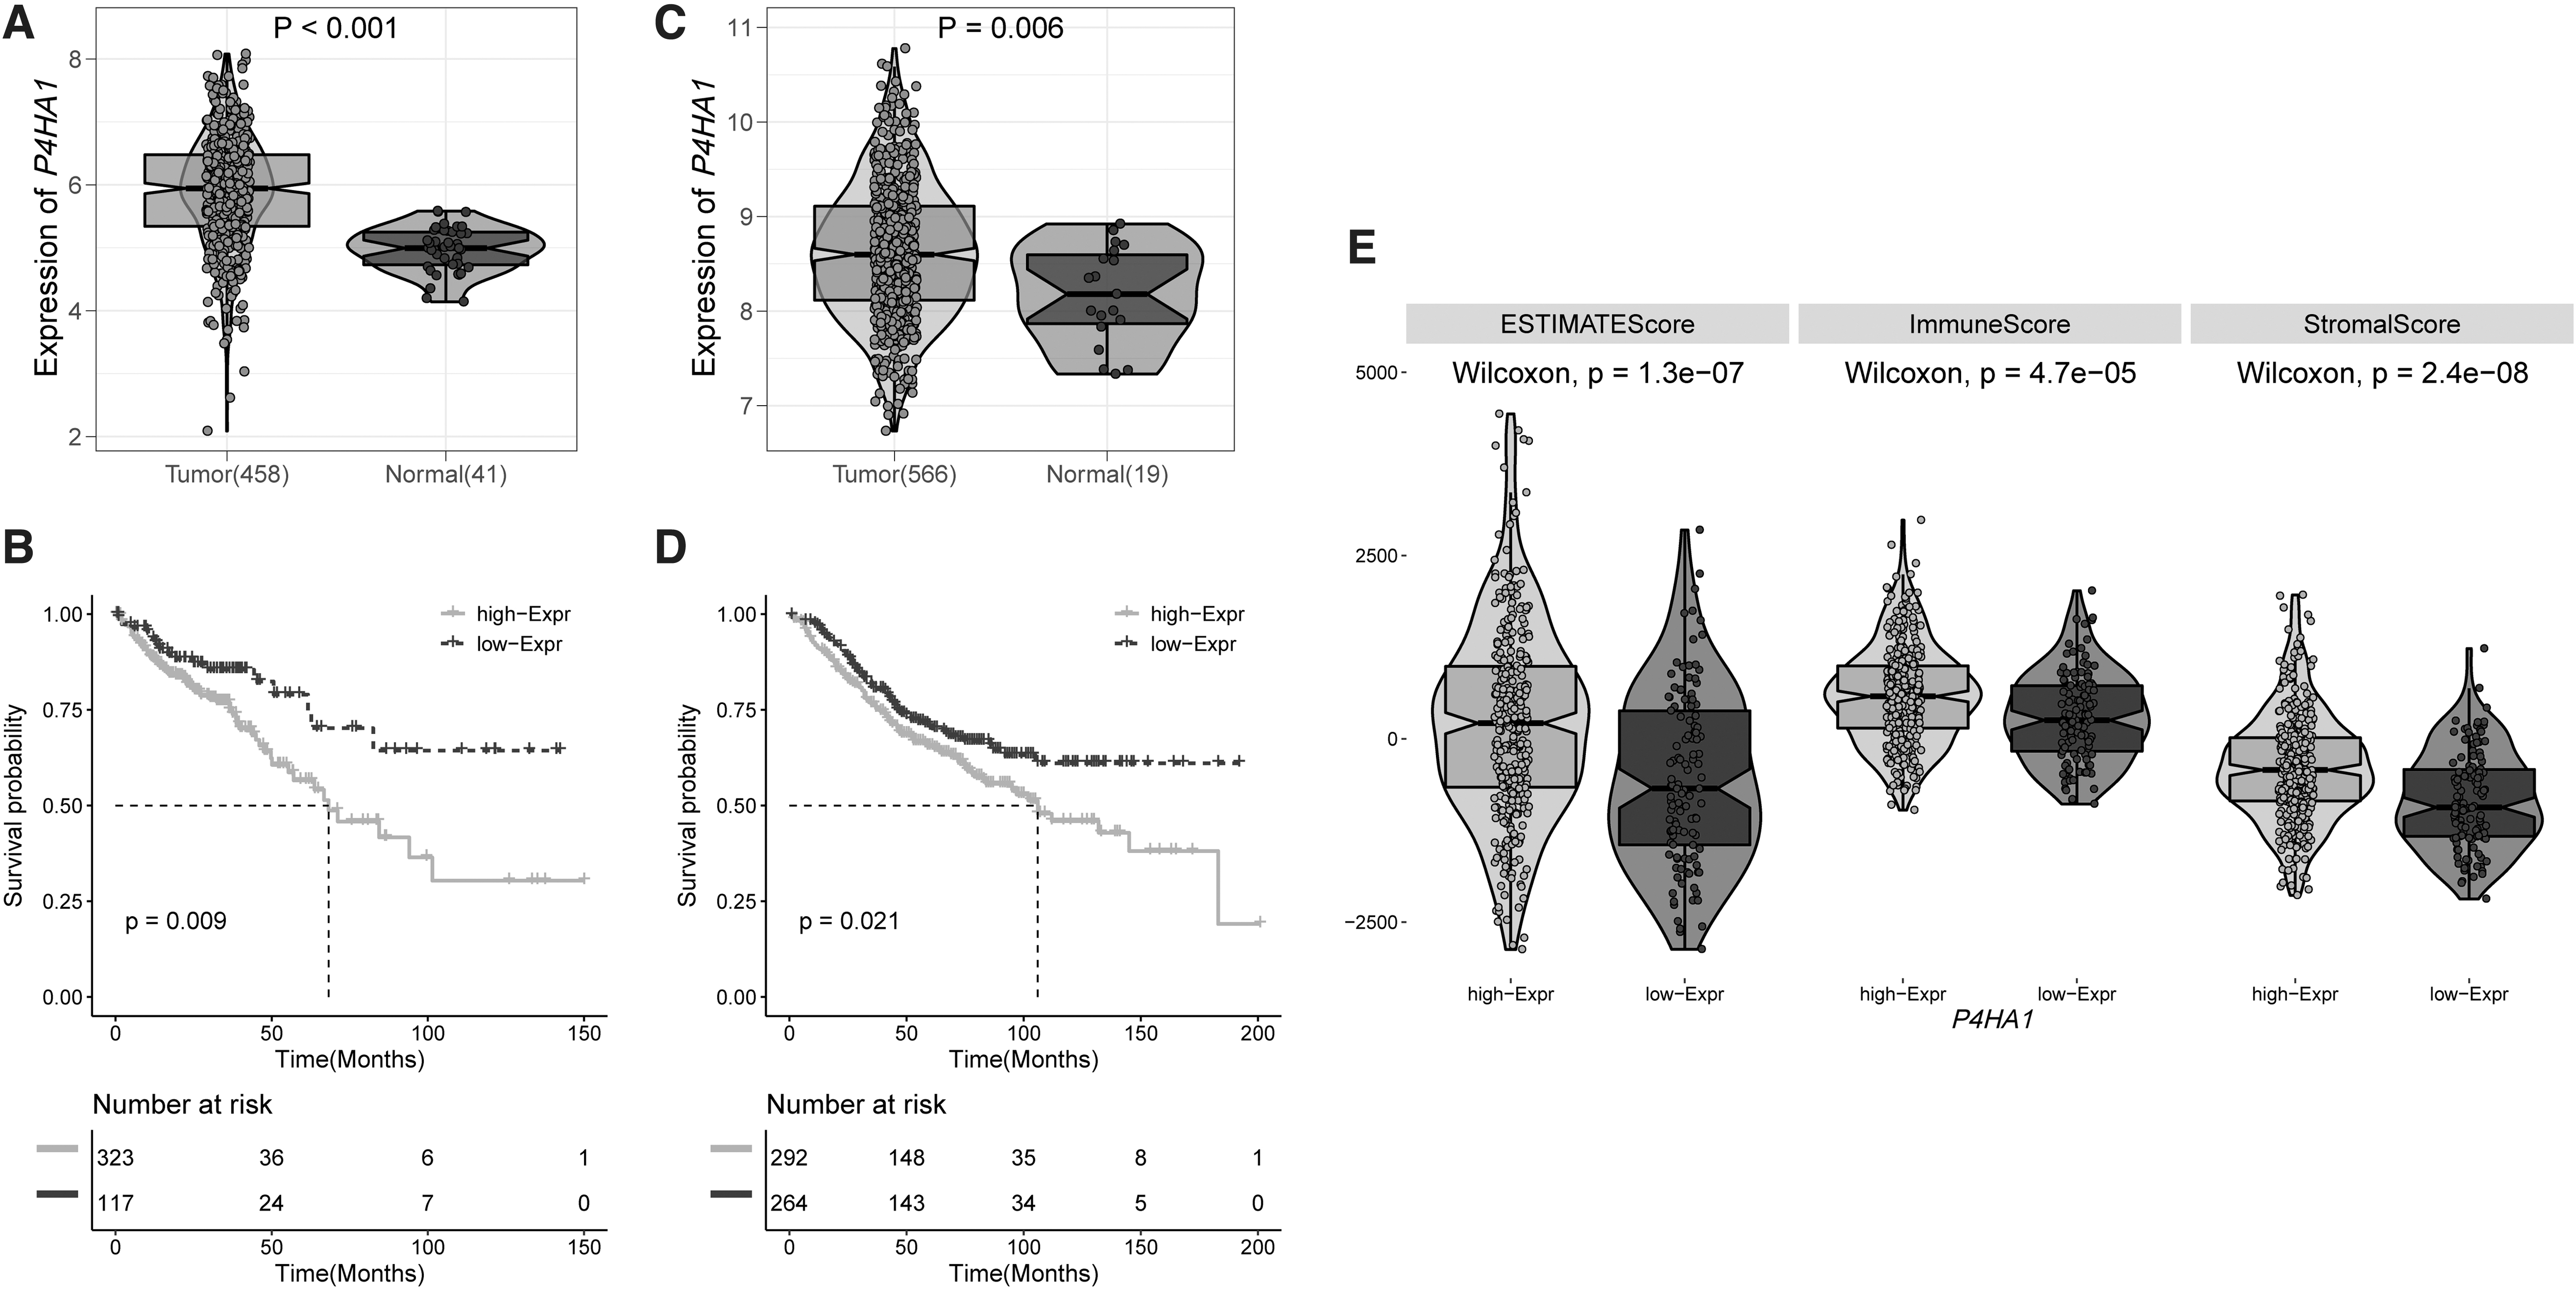
P4HA1 is highly expressed in COAD and associated with poor clinical outcome.
Univariate and Multivariate Analyses of Clinical Features and Overall Survival (OS) in the Cancer Genome Atlas Colon Adenocarcinoma Cohort
CI, confidence interval; HR, hazard ratio.
Infiltrating stroma cells and immune cells are thought to have important functions in tumor growth, invasion, and drug resistance. To infer the tumor cellularity in COAD, we applied ESTIMATE algorithm on transcriptome profiles from the cancer patients of the TCGA cohort. Both the immune score and stroma score were calculated to reveal the presence of the immune cells and stroma cells resident in the tumor tissues, respectively (Fig. 1E). In general, the immune score is higher than the StromaScore across the cohort, suggesting that more immune cells infiltrated into the tumor than the stroma cells in COAD. We then sought to assess whether P4HA1 expression correlates with the presence of infiltrating normal cells. The results showed that patients with high P4HA1 expression have significantly higher immune score and stroma score, compared to patients with low P4HA1 expression. The ESTIMATE score also showed a positive correlation with P4HA1 expression.
Identification of prognostic gene signature and construction of risk score model
To investigate the effect of diverse P4HA1 expression in COAD, we first examined the pathways enriched in high P4HA1 expression cases (Fig. 2A). GSVA analysis revealed multiple pathways significantly enriched in tumor samples with higher expression of P4HA1. The top 20 gene sets are involved in regulation of a variety of cell types in cell migration and extension. Next, we identified the DEGs between high and low P4HA1 expression in TCGA cohort by applying differential expression analysis using the limma package in R. DEGs were considered statistically significant with adjusted p < 0.05 and further selected with fold change >1.5. As a result, a total of 1528 DEGs, with 1422 upregulated and 106 downregulated genes were obtained between the groups of high and low P4HA1 expression (Fig. 2B).
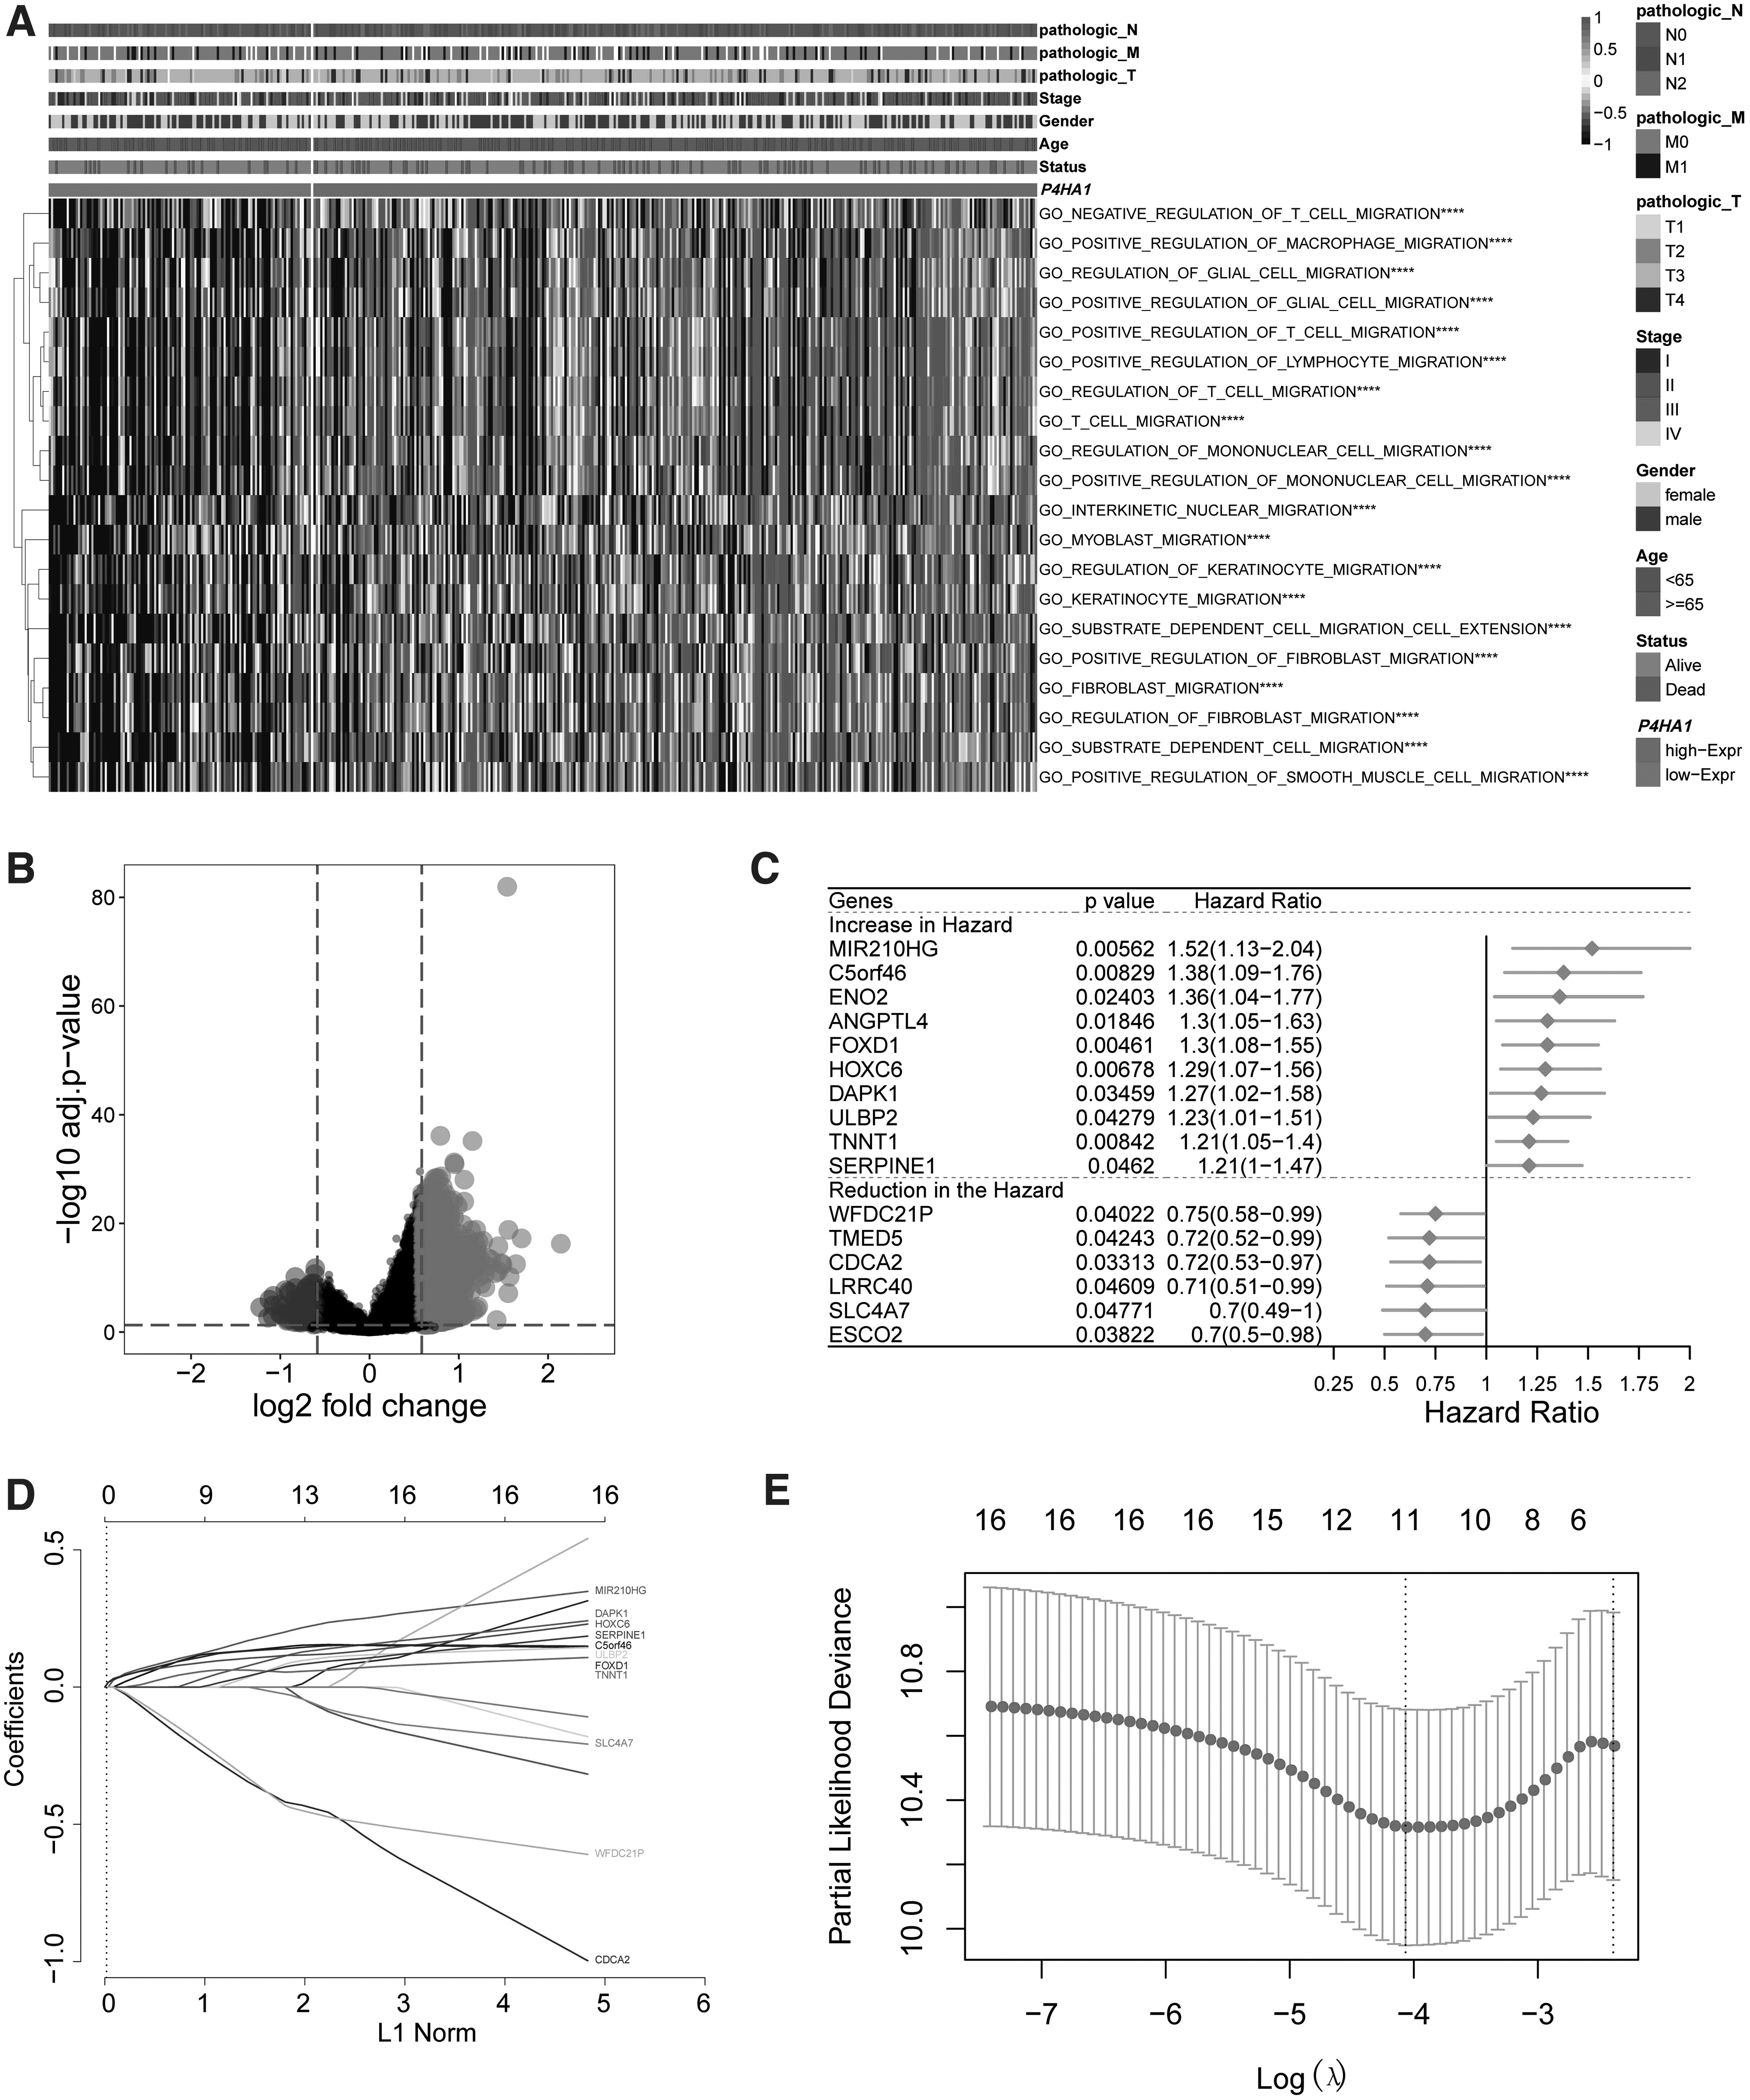
Identification of the potential prognostic gene signature through LASSO Cox regression model.
To explore the prognostic values of the DEGs, we randomly divided the TCGA COAD cohort into two equal groups, designated as training and testing datasets, and then performed the univariate Cox regression analysis on the training data. A total of 16 DEGs were found to be significantly associated with the overall survival of COAD patients (Fig. 2C). Among them, 11 gene features exhibited increased risk of poor prognosis of COAD with the hazard ratio larger than one. These genes include MIR210HG, C5orf46, ENO2, ANGPTL4, FOXD1, HOXC6, DAPK1, ULBP2, TNNT1, and SERPINE1. In contrary, we found that the expression of the rest five DEGs (WFDC21P, TMED5, CDCA2, LRRC40, SLC4A7, and ESCO2) are associated with lower risk of disease prognosis. To prevent overfitting, LASSO regression analysis was conducted to reduce the number of gene variables in our risk score model. It turned out that 11 out of the 16 DEGs had non-zero coefficients, indicating they could potentially be good prognostic predictors (Fig. 2D, E). Thus, the predictive risk score model was defined as the linear combination of the expression levels of 11 gene features weighted by their relative coefficient in the Cox regression. Three of the 11 genes were protective (WFDC21P, CDCA2, and SLC4A7) and the rest were all high-risk indicators with positive coefficients. We then performed survival analysis of COAD patients stratified by expression level of the 11 genes to determine whether each selected feature is correlated with prognosis significance. As expected, significant differences were observed of patient OS between the groups with high and low gene expression (Fig. 3). Specifically, patients with high expression of risk indicators (MIR210HG, C5orf46, FOXD1, HOXC6, DAPK1, ULBP2, TNNT1, and SERPINE1) showed a significant shorter OS, while patients with high expression of favorable predictors (WFDC21P, CDCA2, and SLC4A7) all had better OS.
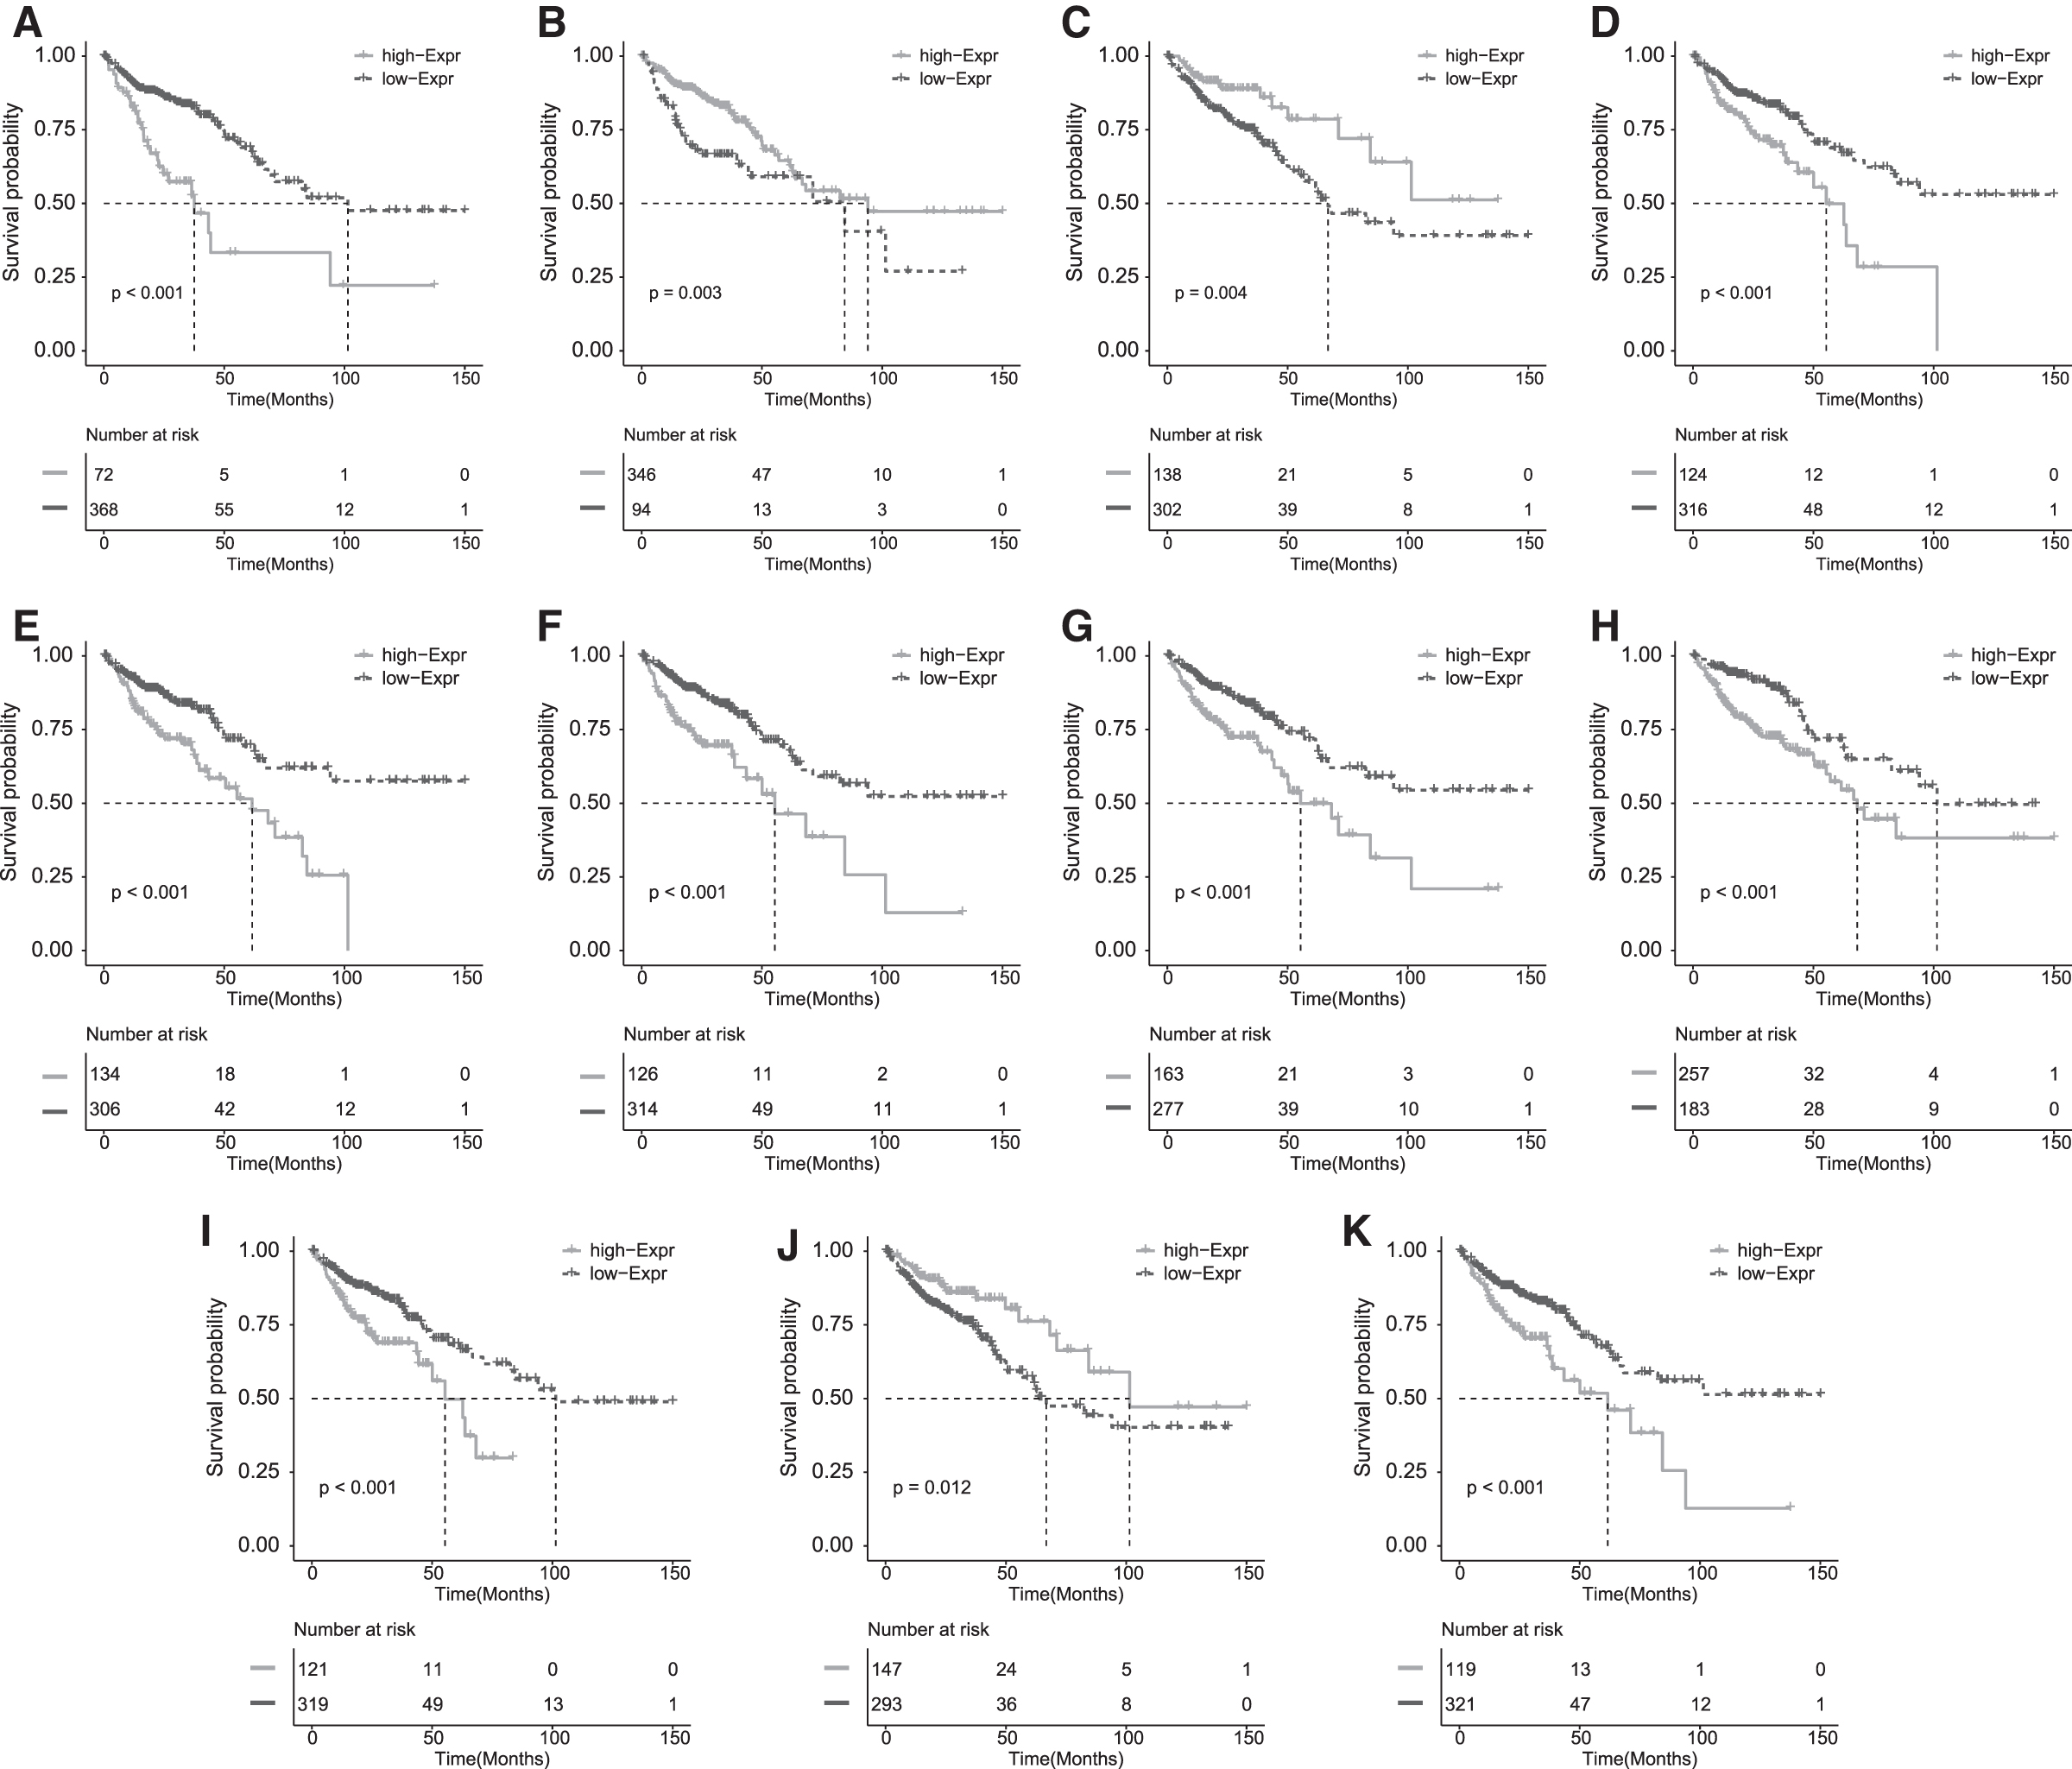
Survival analysis of COAD patients stratified by expression level of the 11 genes.
The risk scores of individual patients from the training set were derived from the above model using the expression of the 11 gene signatures. The patients were then classified into either high- or low-risk groups with the median risk score (cutoff = −0.334) as the threshold value (Fig. 4I). The survival possibility was significantly lower in the patient group with high risk score (Fig. 4A). The mean OS time was 48.5 months in the high-risk group and 101.5 months in the low-risk group. The 11-gene based classifier was powerful to predict the 1, 2, and 3-year survival time, with the AUCs equal to 0.719, 0.715, and 0.744, respectively (Fig. 4E).
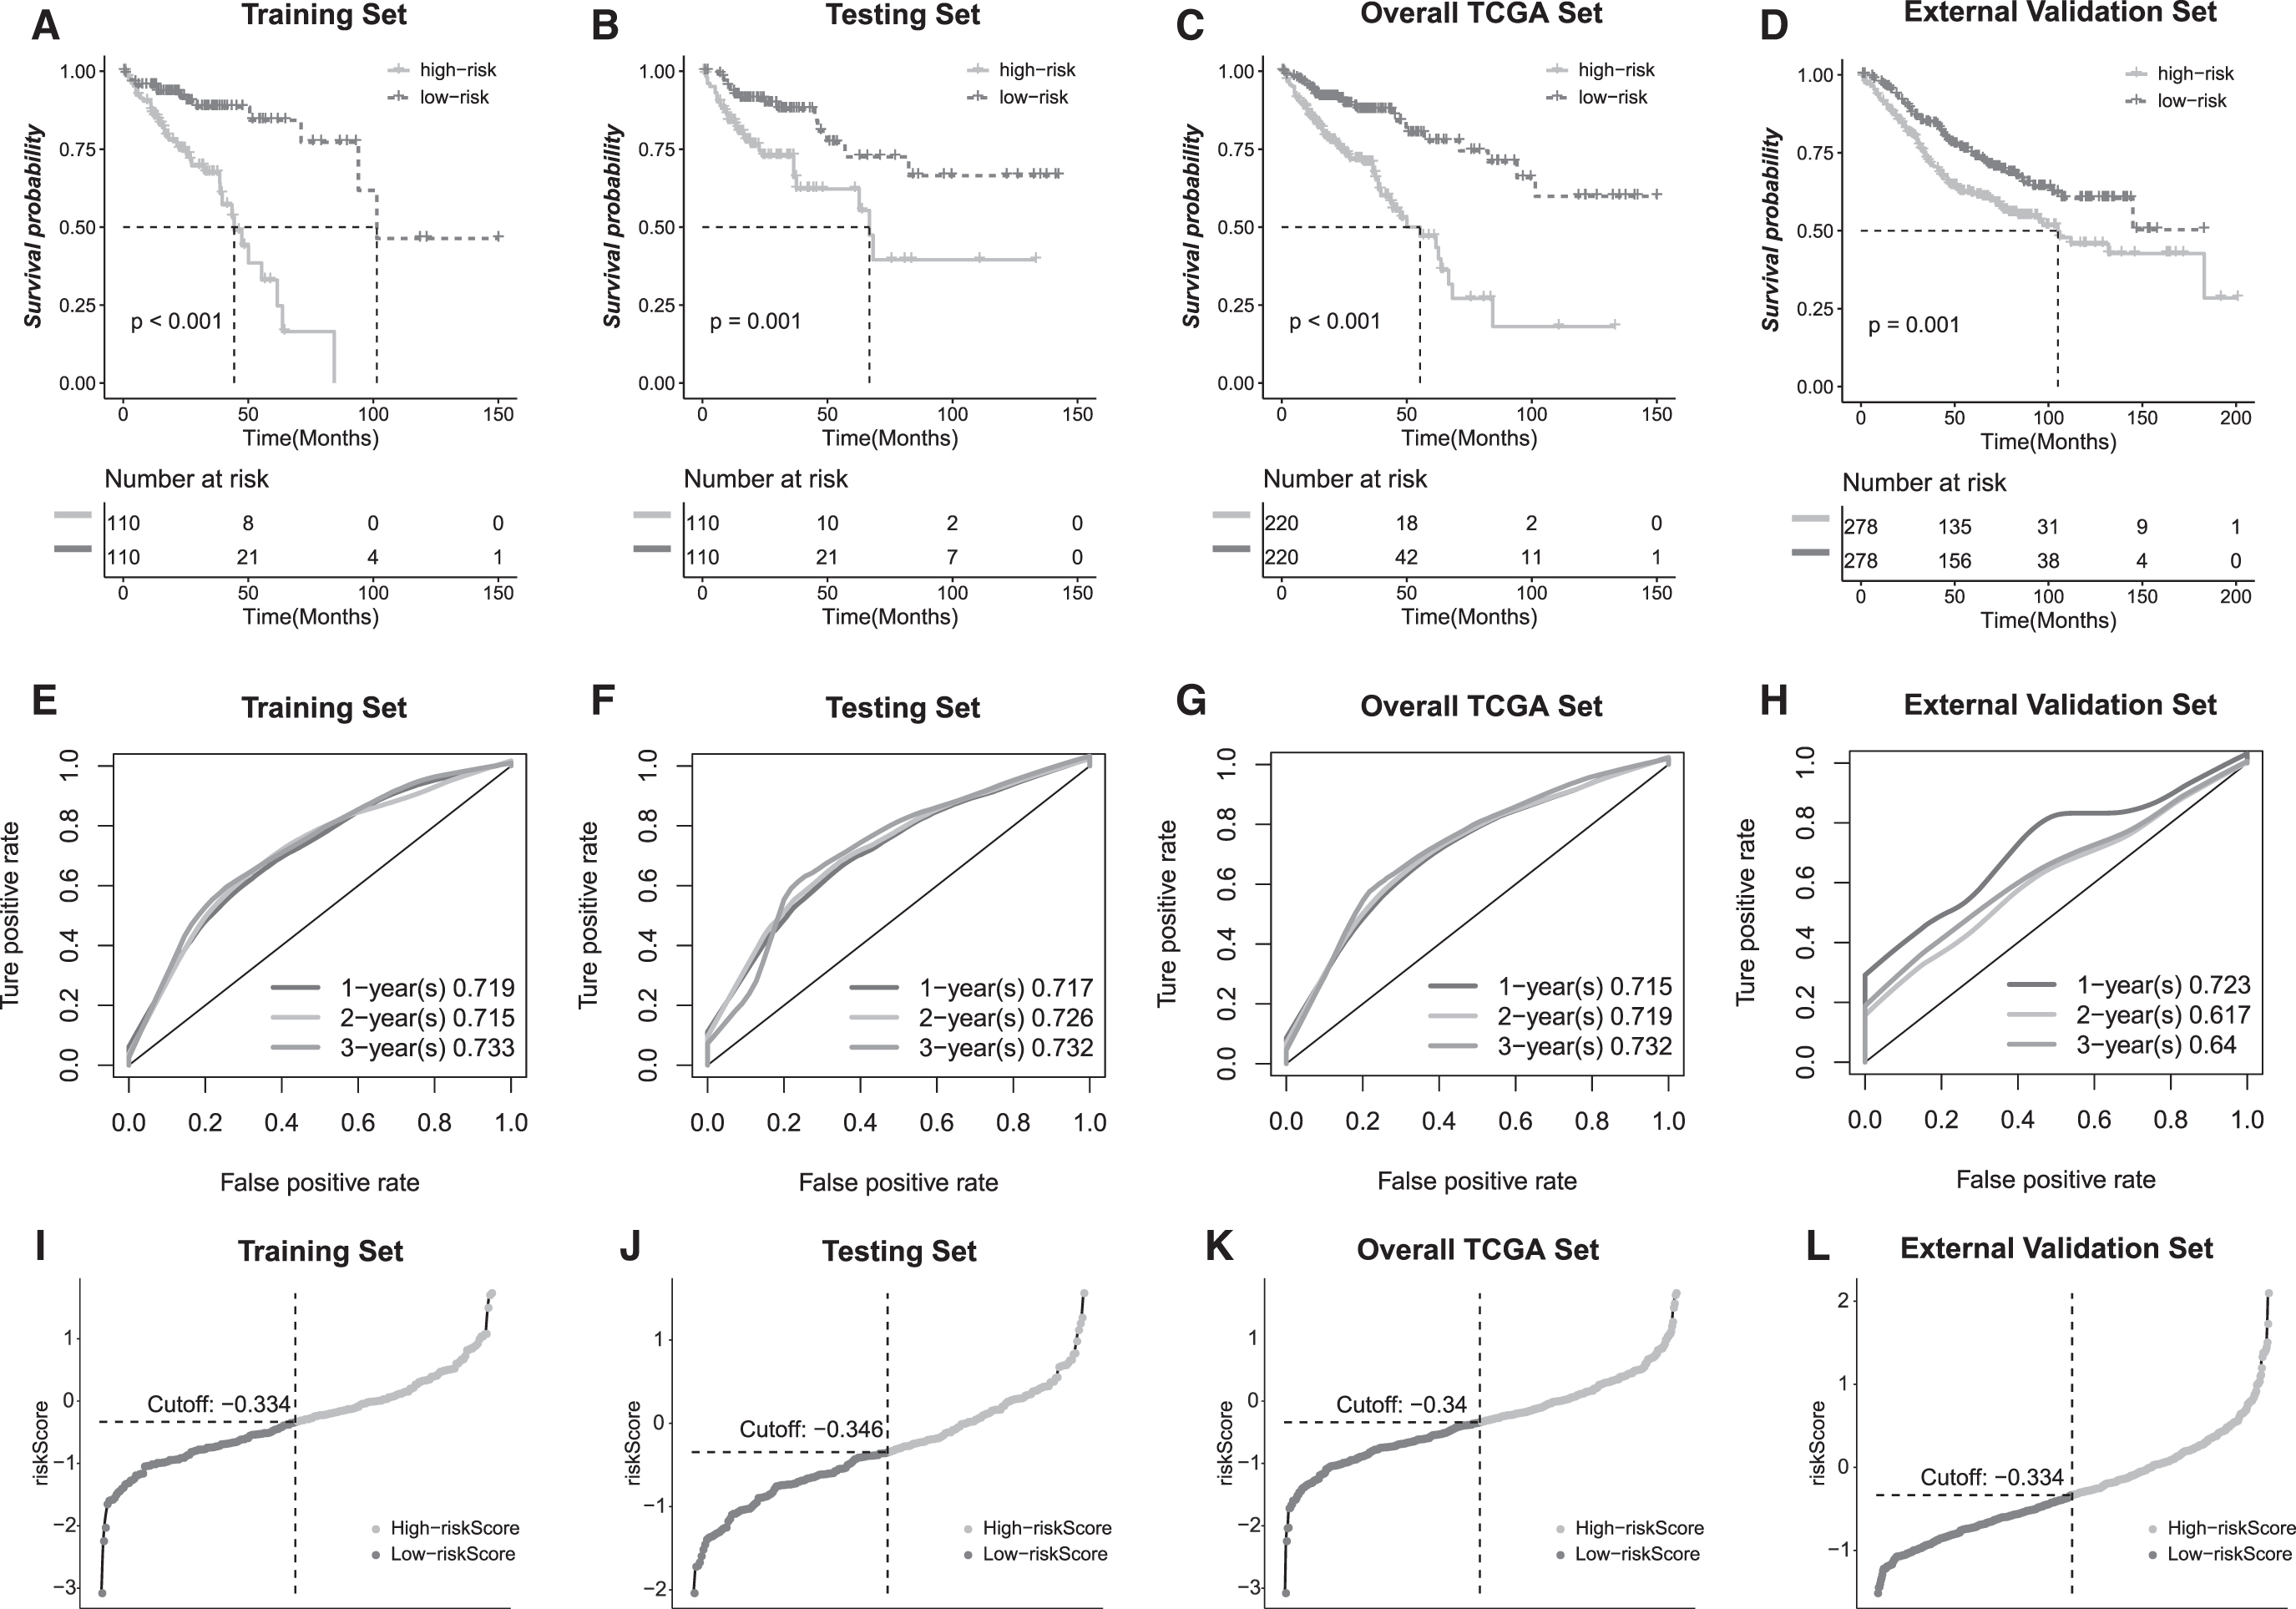
Validation of the risk score model.
Validation of the risk score model
We further evaluated the performance of the risk score model on three different datasets, including the testing and the overall datasets from the TCGA cohort, and an external validation dataset. Similar to the training set, risk score of each patient in both testing and overall datasets was calculated according to the predictive model. Then the patients were stratified into either high- or low-risk groups based on the median risk score. Kaplan–Meier analysis was carried out to determine the OS of the patients. The log rank test revealed that patient from the low-risk group showed a significant better OS compared to the patients from high-risk group (Fig. 4B, C, J, K). It was found that the higher the risk score was, the more unfavorable the patient survival outcome. Furthermore, we analyzed the prediction power of the 11-gene signature in an independent dataset (GSE39582). As shown in Figure 4D and L, consistent with the TCGA cohort, Kaplan–Meier analyses showed that, according to our model, risk score could divide patients into cohorts with significantly different OS rates. The OS time of patients in the high-risk group is significant shorter than that derived from the low-risk group. Actually, patient living month gradually increased with a decreasing risk score. To further establish the hypothesis that the risk score provides great value in COAD prognosis, we depicted the time dependent ROC curves in all the validation sets (Fig. 4F–H). The calculated AUCs were above 0.7 for OS at 1-year of all testing sets, and at 2-year and 3-year of all TCGA cohorts, although the AUCs of OS at 2-year (0.617) and 3-year (0.64) in GSE cohort were slightly lower. Taken together, the results confirmed the reliability of our model in predicting survival of COAD patients.
Correlation between the risk score and clinicopathological factors
We sought to investigate the relation between the computed risk score and other clinical features to further demonstrate the robustness of our prognostic model. Tumor microenvironment plays critical roles in disease progression and the tumor-infiltration immune cells has been proven to be valuable for prognosis assessment of cancer patients. 19 Thus, we first studied whether our model could classify the immune cell invasions into tumor tissues. Patients were grouped into either high or low risk score categories as shown before and the immune scores were derived from ESTIMATE algorithm. We found that patients in high-risk group yield significantly higher immune, stromal and the ESTIMATE scores than those in low-risk group (Fig. 5A), suggesting our 11-gene panel is a good indicator for risk assessment. Additionally, the distributions of risk score stratified by different clinicopathological features were imputed (Fig. 5B–H). It was found that risk score has significant positive correlation with clinical characteristic of TNM staging and status, indicating risk score has a comparable prediction power in estimating the COAD patient survival. Notably, the higher the risk score is, the more advance of the disease as implicated by the pathologic staging in tumor node and metastasis. Similarly, significantly higher morality was associated with the risk score derived from our model, but no correlation was observed between the risk score and the age and genders.
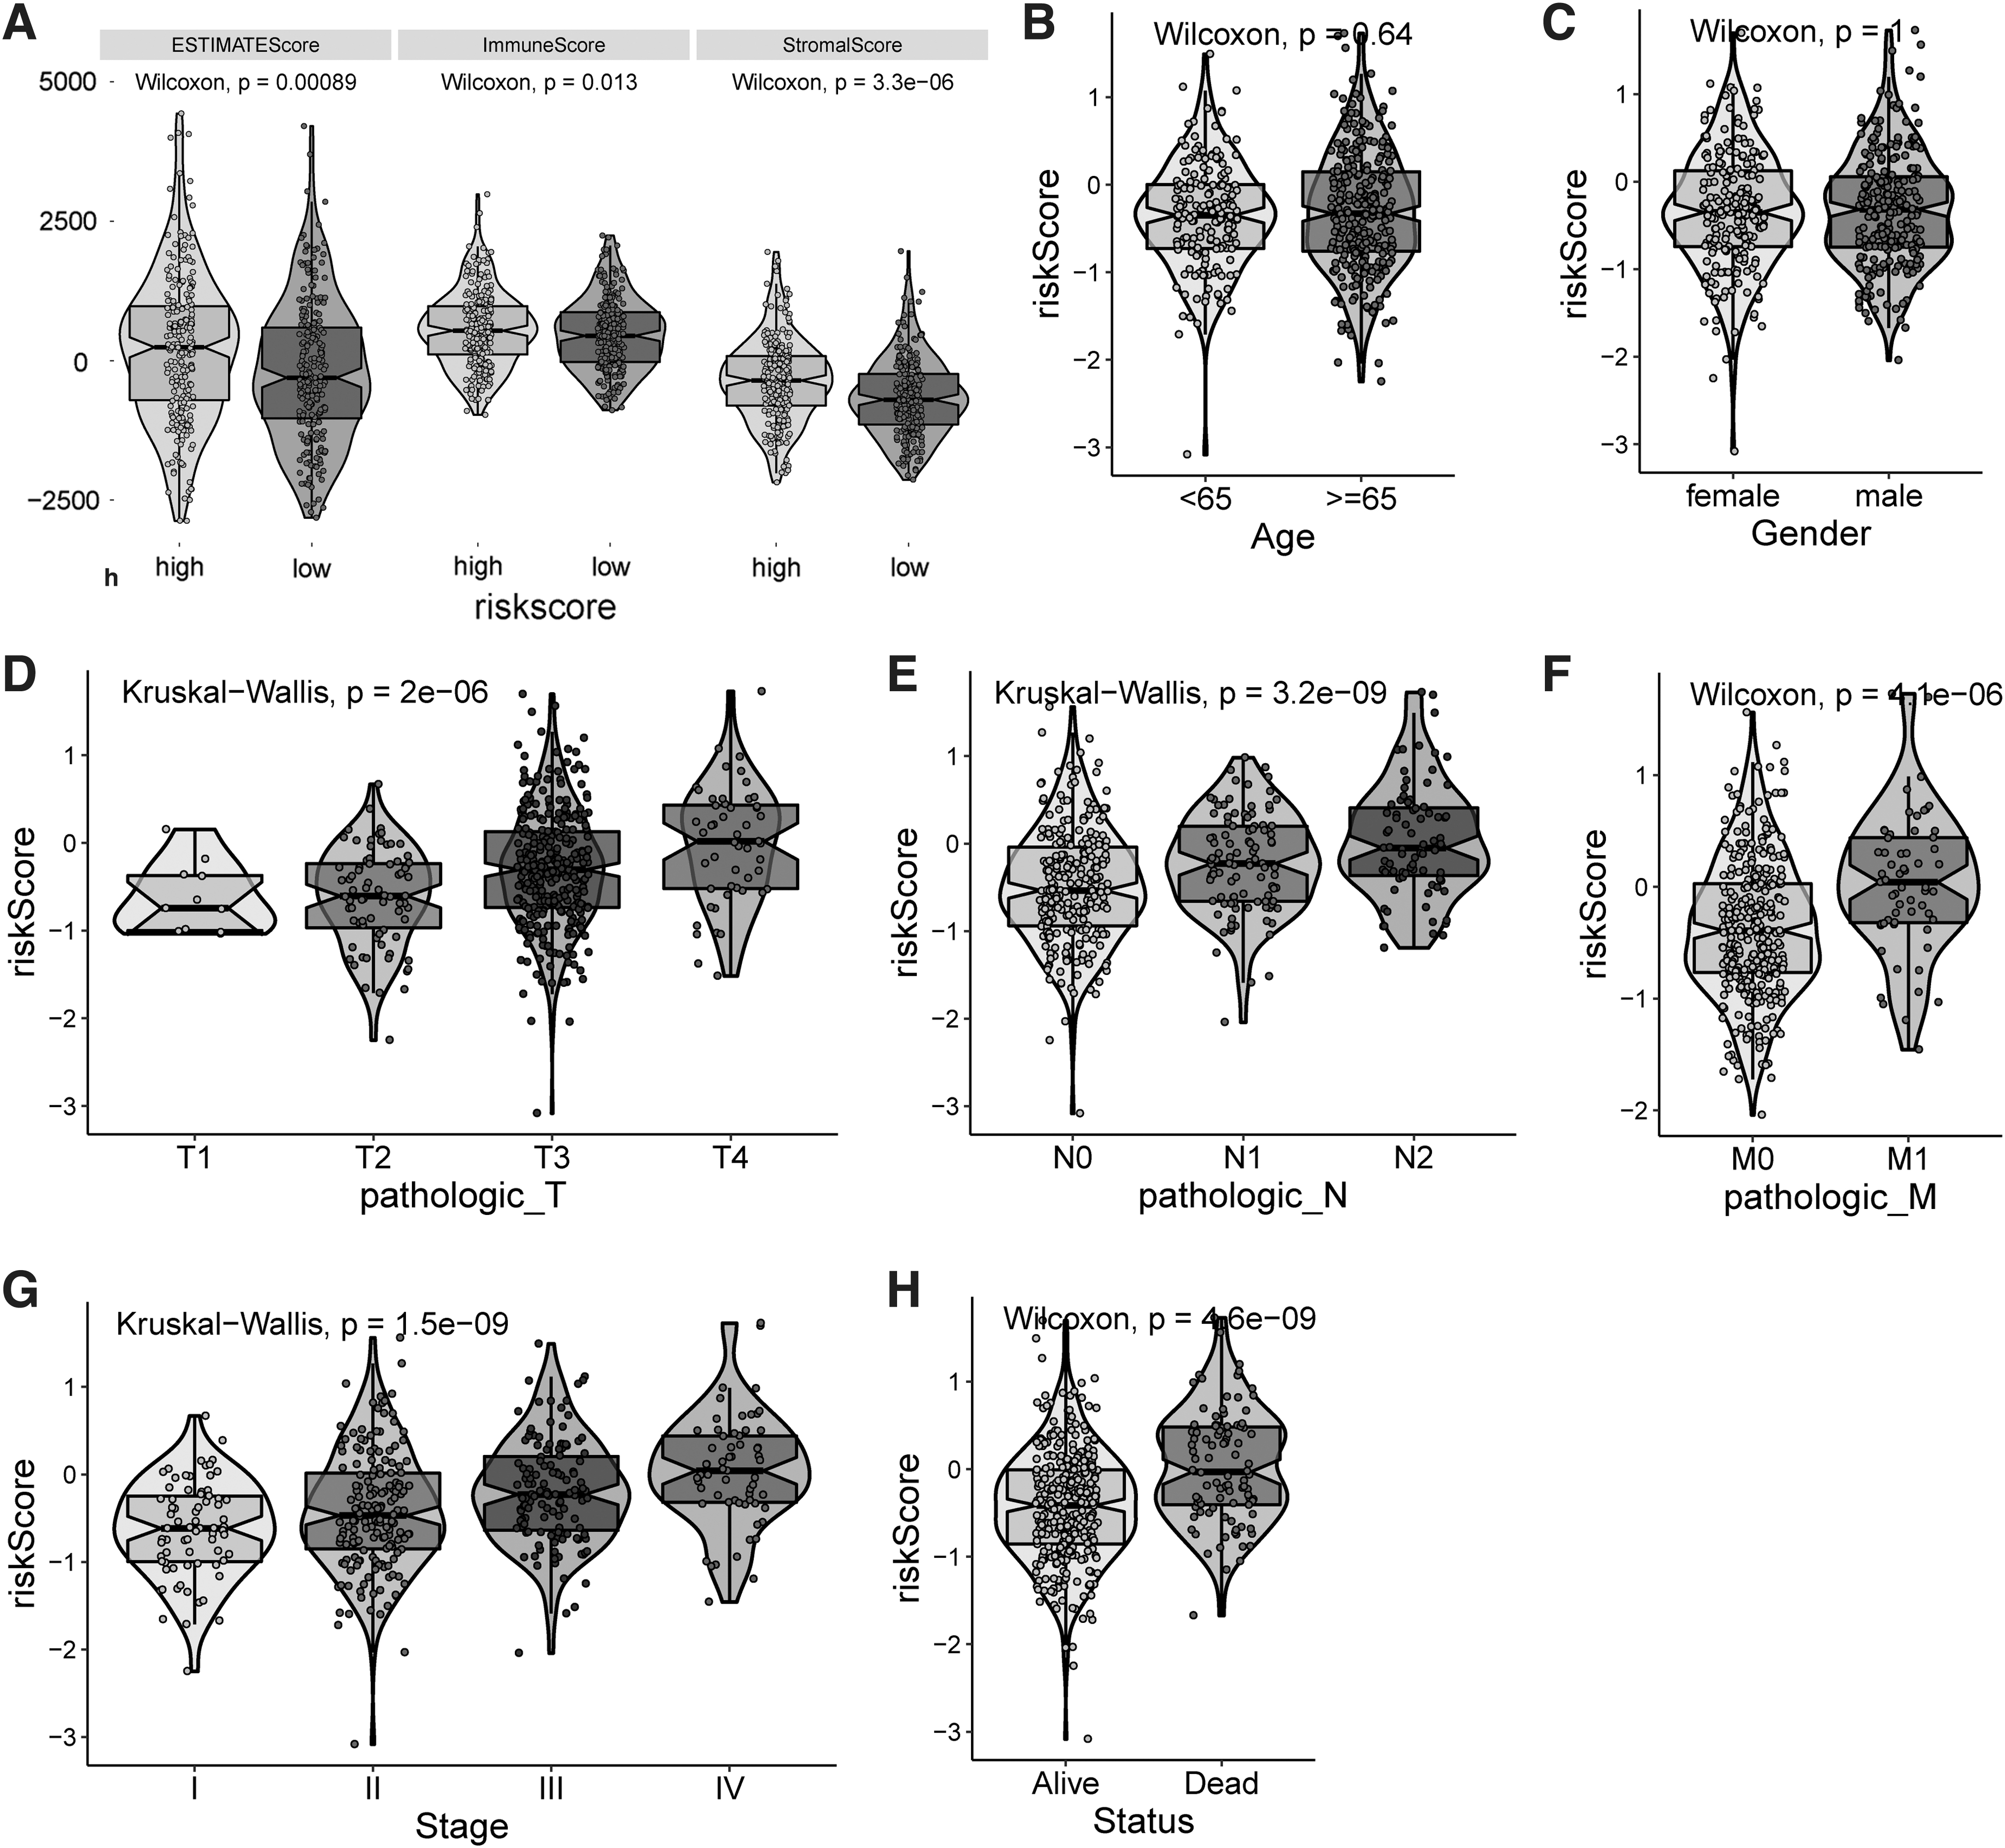
Correlation between the risk score and clinical-pathological factors in COAD patients.
Functional analysis
To understand the potential biological function of the selected gene signature in tumorigenesis, GSEA analysis was performed to probe the candidate pathways associated with the survival rates. Here we used MSigDB as our gene set database. The gene sets were considered significantly enriched if |NES| was more than one, and both the NOM p-value and FDR were <0.05 (Fig. 6). The top hits that were enriched in the high-risk group are ameboidal type cell migration, mesenchyme migration, cell migration involved in sprouting angiogenesis, cell migration by vascular endothelial growth factor (VEGF) signaling pathway, cell migration involved in sprouting angiogenesis, epithelial cell migration, substrate dependent cell migration, and tissue migration. Most of these pathways are cancer related and associated with tumorigenesis and cancer progression.
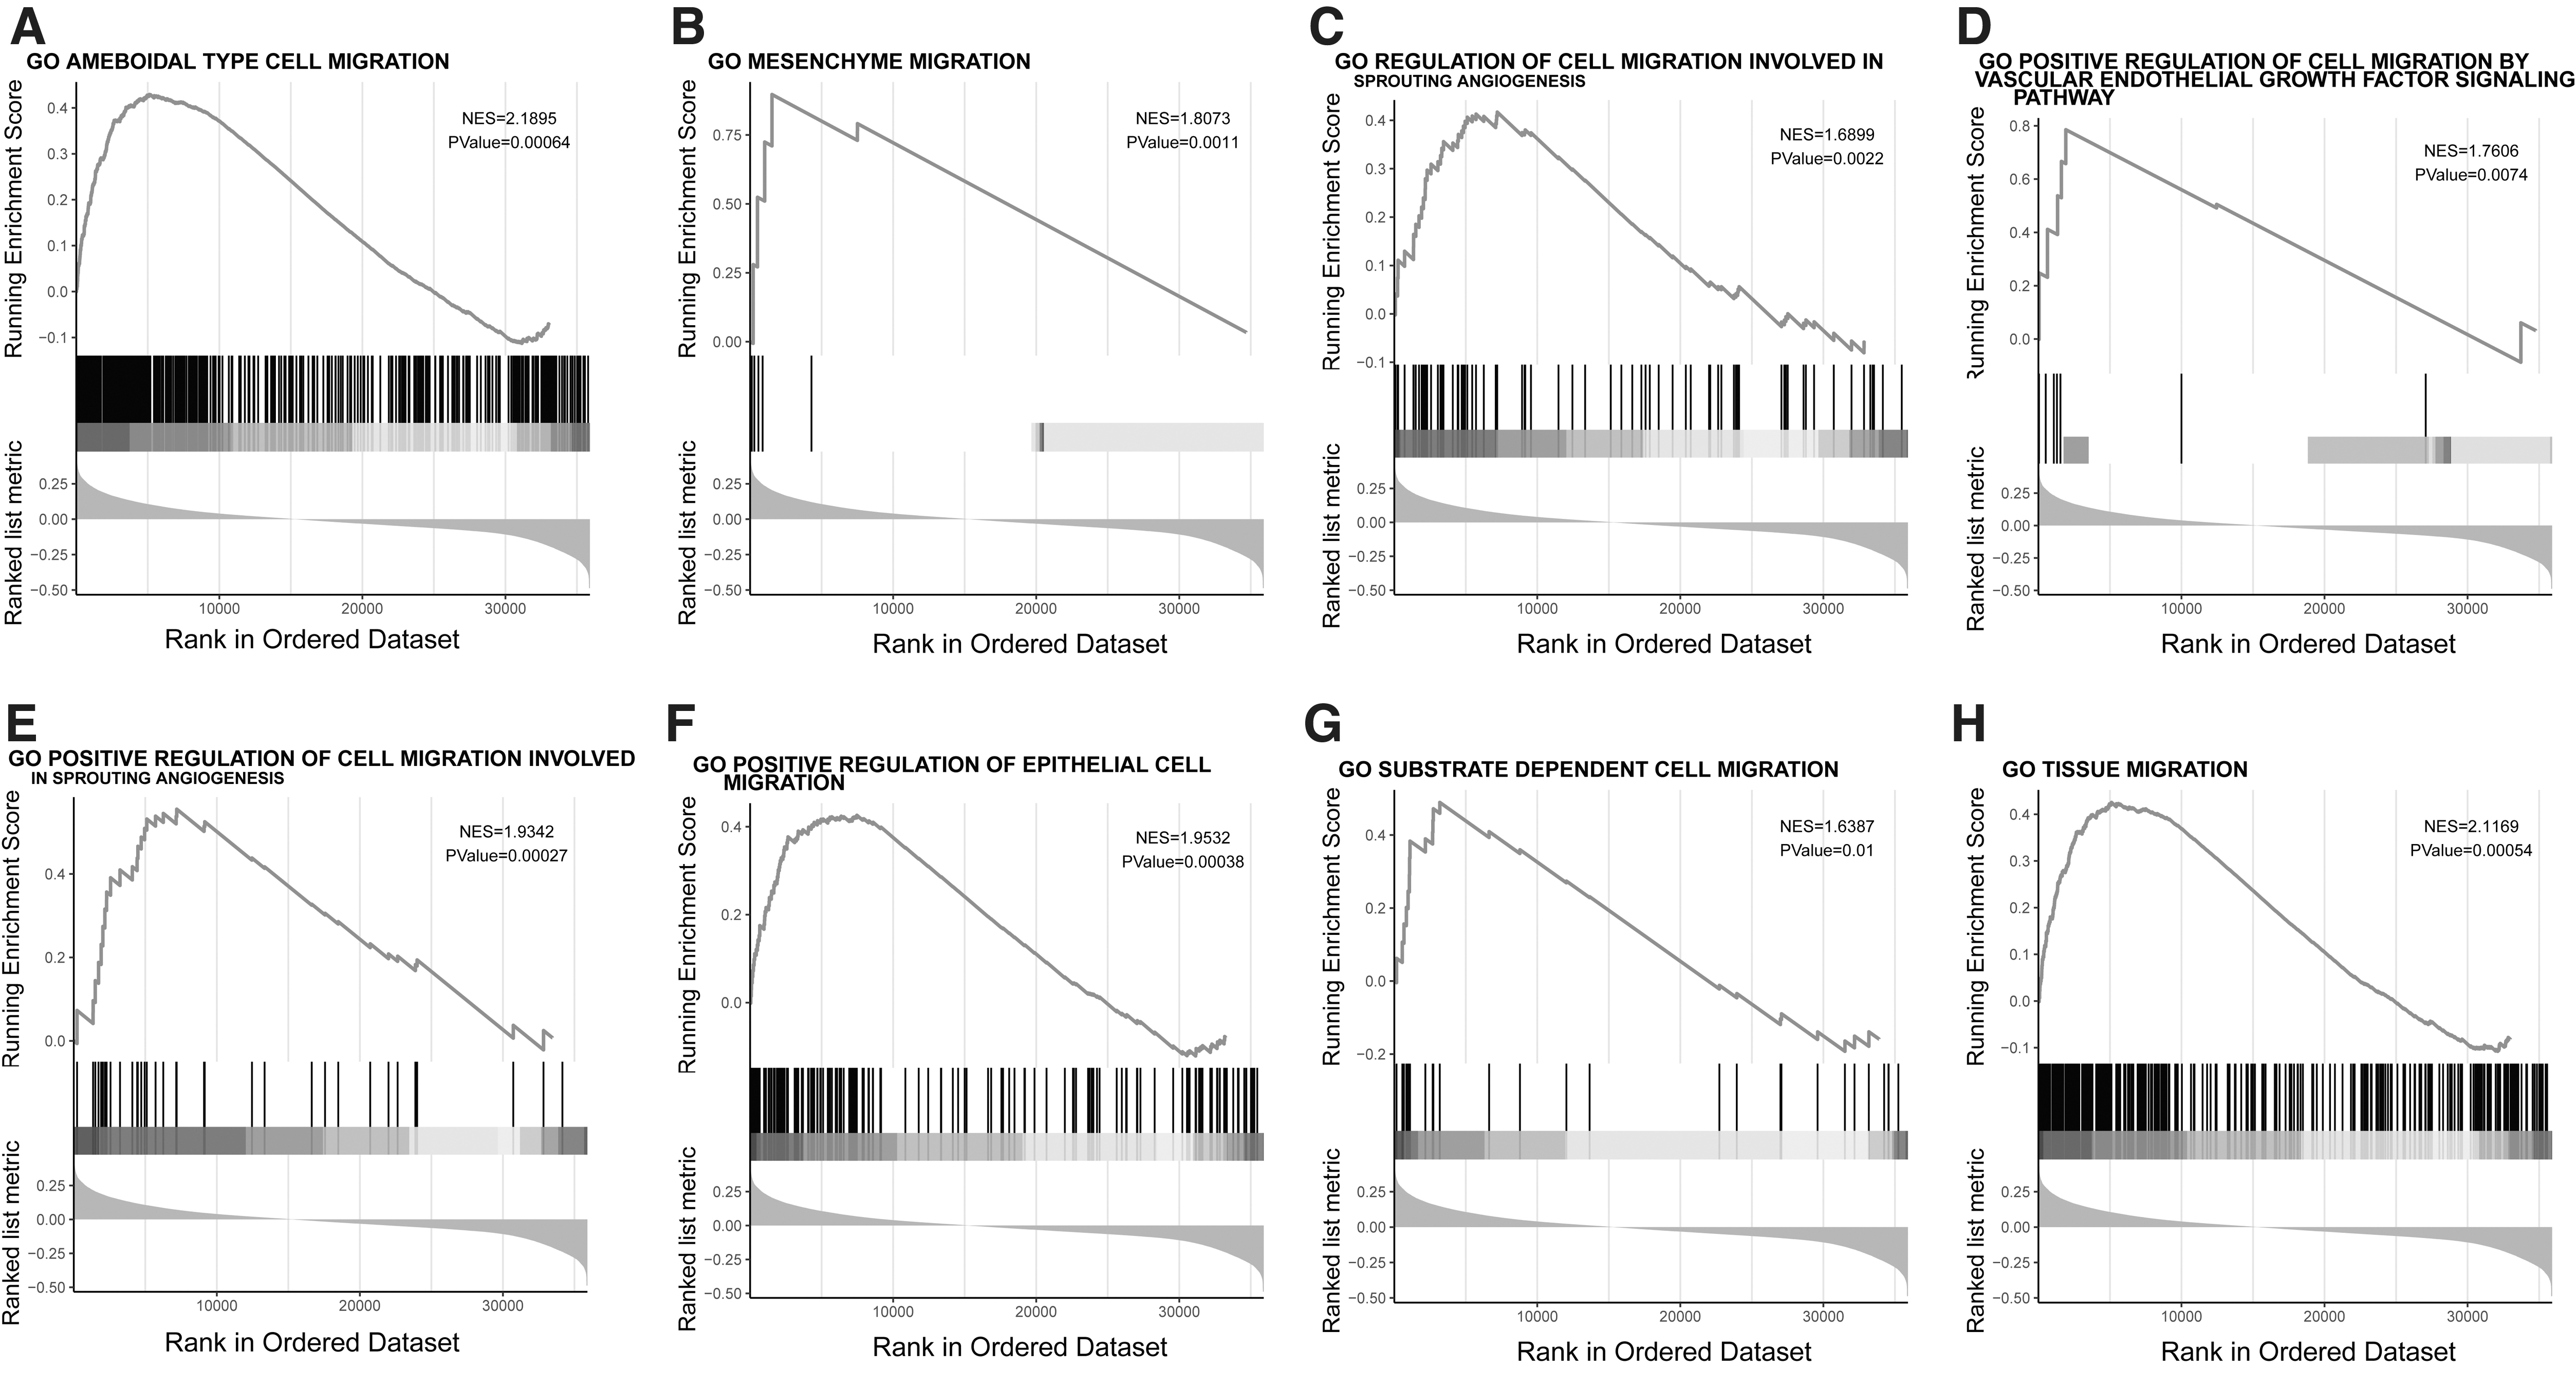
GSEA analysis of pathways enriched in high risk COAD patients classified by the 11-gene signature risks core model.
Discussion
COAD is an aggressive tumor that causes ∼50% of all CRC deaths. And the incidence of COAD is increasing due to a combination of genetic and environmental factors. 20 Therefore, identification of the genetic events in COAD is of great clinical relevance. In the present study, we aim to identify biomarkers for prediction of the survival time of COAD patient. To achieve this goal, computational analysis on high throughput gene expression data was utilized. Recent advance in bioinformatics analysis of gene expression profiles enables the identification of candidate genes and gene networks for disease. The discovery of gene networks and their deregulation in CRC has benefited from genome-wide expression profiling using both microarray and NGS technology. These expression profiles have led researchers to uncover a large number of genes that may be important in the development and progression of CRC. Here, by training a LASSO Cox regression model on DEGs identified from TCGA COAD cohort, we were able to discover a 11-gene signature for the prognosis of COAD patients. The performance was validated by three additional datasets that include the external testing dataset GSE39582.
The DEGs we identified were related to P4HA1, which encodes a component of P4H, a key enzyme in collagen synthesis composed of two identical alpha subunits and two beta subunits. Previously, P4HA1 was reported as an oncogene and expression of P4HA1 has proven to be an independent prognostic factor for poor OS and RFS in lung cancer and head and neck cancer patients.
10,11
However, very limited studies were available describing its role in CRC carcinogenesis, diagnosis, and prognosis. We found that P4HA1 was overexpressed in COAD tissue samples and confirmed its association with unfavorable clinical outcome. The risk signature derived from P4HA1 related DEGs is comprised of 11 genes, including MIR210HG, SLC4A7
The model was evaluated in both TCGA and GSE39582 cohorts, showing that patients in low-risk group had significant longer survival time and better clinical outcome, compared with the patients in high-risk group. By using the ROC analysis, we proved the superior performance of our model in predicting OS. Meanwhile, we also demonstrated that TNM staging system (pathological-T, N, and M), the overall tumor stage, and the tumor status have relative significant impact on COAD prognosis. A positive correlation exists between our gene signature model and these factors in OS prediction.
To gain more insights into the molecular roles of the 11 genes in our prognosis model, GSEA analysis was performed and showed that pathways associated with cell migration were significantly correlated with poor prognosis in high-risk group of COAD patients. The top hits include ameboidal type cell migration, mesenchyme migration, cell migration involved in sprouting angiogenesis, cell migration by VEGF signaling pathway, and others, all of which are reported to play critical roles in cancer biology. Tumor cells exhibit at least two distinct modes of migration when invading the three-dimensional (3D) environment, either mesenchymal or amoeboid patterns or both. 24,25 At the molecular level, mesenchymal migration required Rho-family small GTPases Rac and Cdc42 mediating actin polymerization through the regulation of WASP/WAVE proteins. 26,27 Depletion of intracellular VEGF and VEGFR1 in multiple CRC cell lines led to strong inhibition of migration and invasion of CRC cells. 28
In conclusion, we have identified a 11-gene signature risk score model as a powerful tool for prognosis in COAD patients. The risk model is independent of clinicopathological factors in predicting OS, which complements the current TNM staging system. The accuracy and stability of our model provide opportunity for future clinical application.
Conclusion
In this study, we identified the DEGs related to P4HA1 and then established a prognostic model upon the expression of these DEGs to effectively predict survival in CRC. It is an original work that would provide opportunity for future clinical application.
Footnotes
Authors' Contributions
X.Z. put forward the concept of the study, designed the study, prepared the article, and contributed to the statistical analysis. Z.C. contributed to the data acquisition. Z.C. and M.C. contributed to the data analysis and the quality control of data. X.Z. and Z.X. analyzed the data and edited the article. All authors read and approved the final article.
Data Availability
All data used to support the findings of this study are downloaded from the TCGA and GEO databases (accession nos. GSE39582). Please contact corresponding author for data requests.
Disclosure Statement
There are no existing financial conflicts.
Funding Information
This work was supported by the Xiamen Key Laboratory of Biliary Tract Disease and the Xiamen Health Science & Technology Program (3502Z20194050).