
Abstract
Background:
Knowledge about the prognostic role of long noncoding RNA (lncRNA) in colorectal cancer (CRC) is limited. Therefore, we constructed a lncRNA-related prognostic model based on data from the Gene Expression Omnibus (GEO) and The Cancer Genome Atlas (TCGA).
Materials and Methods:
CRC transcriptome and clinical data were downloaded from the GSE20916 dataset and the TCGA database, respectively. R software was used for data processing and analysis. The differential lncRNA expression within the two datasets was first screened, and then intersections were measured. Cox regression and the Kaplan–Meier method were used to evaluate the effects of various factors on prognosis. The area under the curve (AUC) of the receiver operating characteristic curve and a nomogram based on multivariate Cox analysis were used to estimate the prognostic value of the lncRNA-related model. Gene Ontology (GO) and Kyoto Encyclopedia of Genes and Genomes (KEGG) enrichment analyses were applied to elucidate the significantly involved biological functions and pathways.
Results:
A total of 11 lncRNAs were crossed. The univariate Cox analysis screened out two lncRNAs, which were analyzed in the multivariate Cox analysis. A nomogram based on the two lncRNAs and other clinicopathological risk factors was constructed. The AUC of the nomogram was 0.56 at 3 years and 0.71 at 5 years. The 3-year nomogram model was compared with the ideal model, which showed that some indices of the 3-year model were consistent with the ideal model, suggesting that our model was highly accurate. The GO and KEGG enrichment analyses showed that positive regulation of secretion by cells, positive regulation of secretion, positive regulation of exocytosis, endocytosis, and the calcium signaling pathway were differentially enriched in the two-lncRNA-associated phenotype.
Conclusions:
A two-lncRNA prognostic model of CRC was constructed by bioinformatics analysis. The model had moderate prediction accuracy. LncRNA BBOX1-AS1 and lncRNA FOXP4-AS1 were identified as prognostic biomarkers.
Introduction
In the United States, the incidence and mortality of colorectal cancer (CRC) both currently rank third among all cancers in both men and women. 1 In 2020 in the United Sates, 147,950 new cases of CRC will likely be diagnosed, and an estimated 53,200 CRC-related deaths are expected to occur. 1 In addition, the prevalence of CRC in young and middle-aged people (<50 years) is increasing. 2 Despite advances in treatment methods, many patients still face poor prognoses because of early metastasis, the absence of a typical clinical presentation, and the lack of sensitive screening methods for early-stage CRC.
In recent years, researchers have demonstrated the involvement of genome stability and aberrant gene expression in CRC prognosis. 3 –6 Still, the mechanism of CRC survival remains unclear, which hampers efforts to improve CRC prognosis. Individualized systemic treatment may prolong survival and enhance quality of life. Therefore, an effective prediction model is critical for the accurate assessment of CRC prognosis.
Long noncoding RNAs (lncRNAs), whose transcripts are longer than 200 nucleotides, do not code for proteins. 7 They have recently been recognized as important regulators in tumor development and progression. 8,9 Research has shown that through interactions with RNAs, proteins, and lipids, lncRNAs play a pivotal role in mediating the signal transduction pathways of cancer, 10 suggesting their clinical potential as prognostic biomarkers and therapeutic targets. 11 Some studies have also revealed the roles of lncRNAs in cancer prognosis and progression. 12 –16
The Cancer Genome Atlas (TCGA) is a landmark cancer genomics program. It contains >20,000 primary cancer samples with gene information for 33 cancer types, including a valuable collection of multi-omics data regarding transcriptomes, DNA methylation, copy number variation, and other variables. In this study, we performed a global analysis of prognostic lncRNAs from the TCGA database and constructed a two-lncRNA prognostic model. Functional analyses of the two lncRNAs were performed. Furthermore, we developed and validated a predictive nomogram that integrated our newly discovered two-lncRNA signature with the traditional clinicopathological risk factors of CRC patients in the TCGA cohort. This two-lncRNA prognostic model and nomogram might help to more accurately predict CRC prognosis, and they may also help to guide postoperative treatment and follow-up.
Materials and Methods
Data acquisition
We used the search term “colorectal cancer” as the keyword in the Gene Expression Omnibus (GEO) database (
A dataset from the TCGA database, namely the COAD and READ projects, along with clinicopathological data, including information about 41 normal samples and 471 tumor samples, were downloaded from the Xena Functional Genomics Explorer of the University of California Santa Cruz. Since the information was retrieved from the TCGA database (a public database), ethical approval was not needed for this research. Data collection and processing were consistent with TCGA data policies for protecting human subjects (
Data processing and identification of differentially expressed lncRNAs
We re-annotated the GEO data into the lncRNA dataset using the SeqMap tool, removing the lncRNAs that could not locate chromosome position and a probe that corresponded to multiple lncRNAs. We noted the average expression of multiple probes corresponding to specific genes, and we changed the probe names to standard gene symbols. Finally, an expression matrix of 500 lncRNAs was obtained from the GEO database.
We then examined the clinical information of 471 tumor samples from the TCGA dataset and excluded the samples with missing clinical information, such as age, sex, survival time, survival status, pM, pT, and pN. Finally, 448 tumor samples were used for subsequent analysis. The RNA sequencing data in the fragments per kilobase per million (FPKM) format were converted to the transcripts per million (TPM) format for further analysis. The lncRNAs included 3prime_overlapping_ncRNA, antisense_RNA, bidirectional_promoter_lncRNA, lincRNA, macro_lncRNA, non_coding, processed_transcript, sense_intronic, and sense_overlapping. We downloaded the hg38 genome annotation file (
We used the limma package to analyze the differentially expressed lncRNAs (DELs) of the GEO and TCGA data. For the DEL threshold values, we used a |logFC| of >1 and an adjusted p-value of <0.05.
Definition and evaluation of the lncRNA-related prognostic model
We divided the TCGA dataset according to a 1:1 sample and obtained a training group (224 samples) and a validation group (224 samples). Then, we performed univariate Cox analysis to determine the association between lncRNA expression and overall survival (OS). The lncRNAs with p-values <0.05 were analyzed by multivariate Cox analysis.
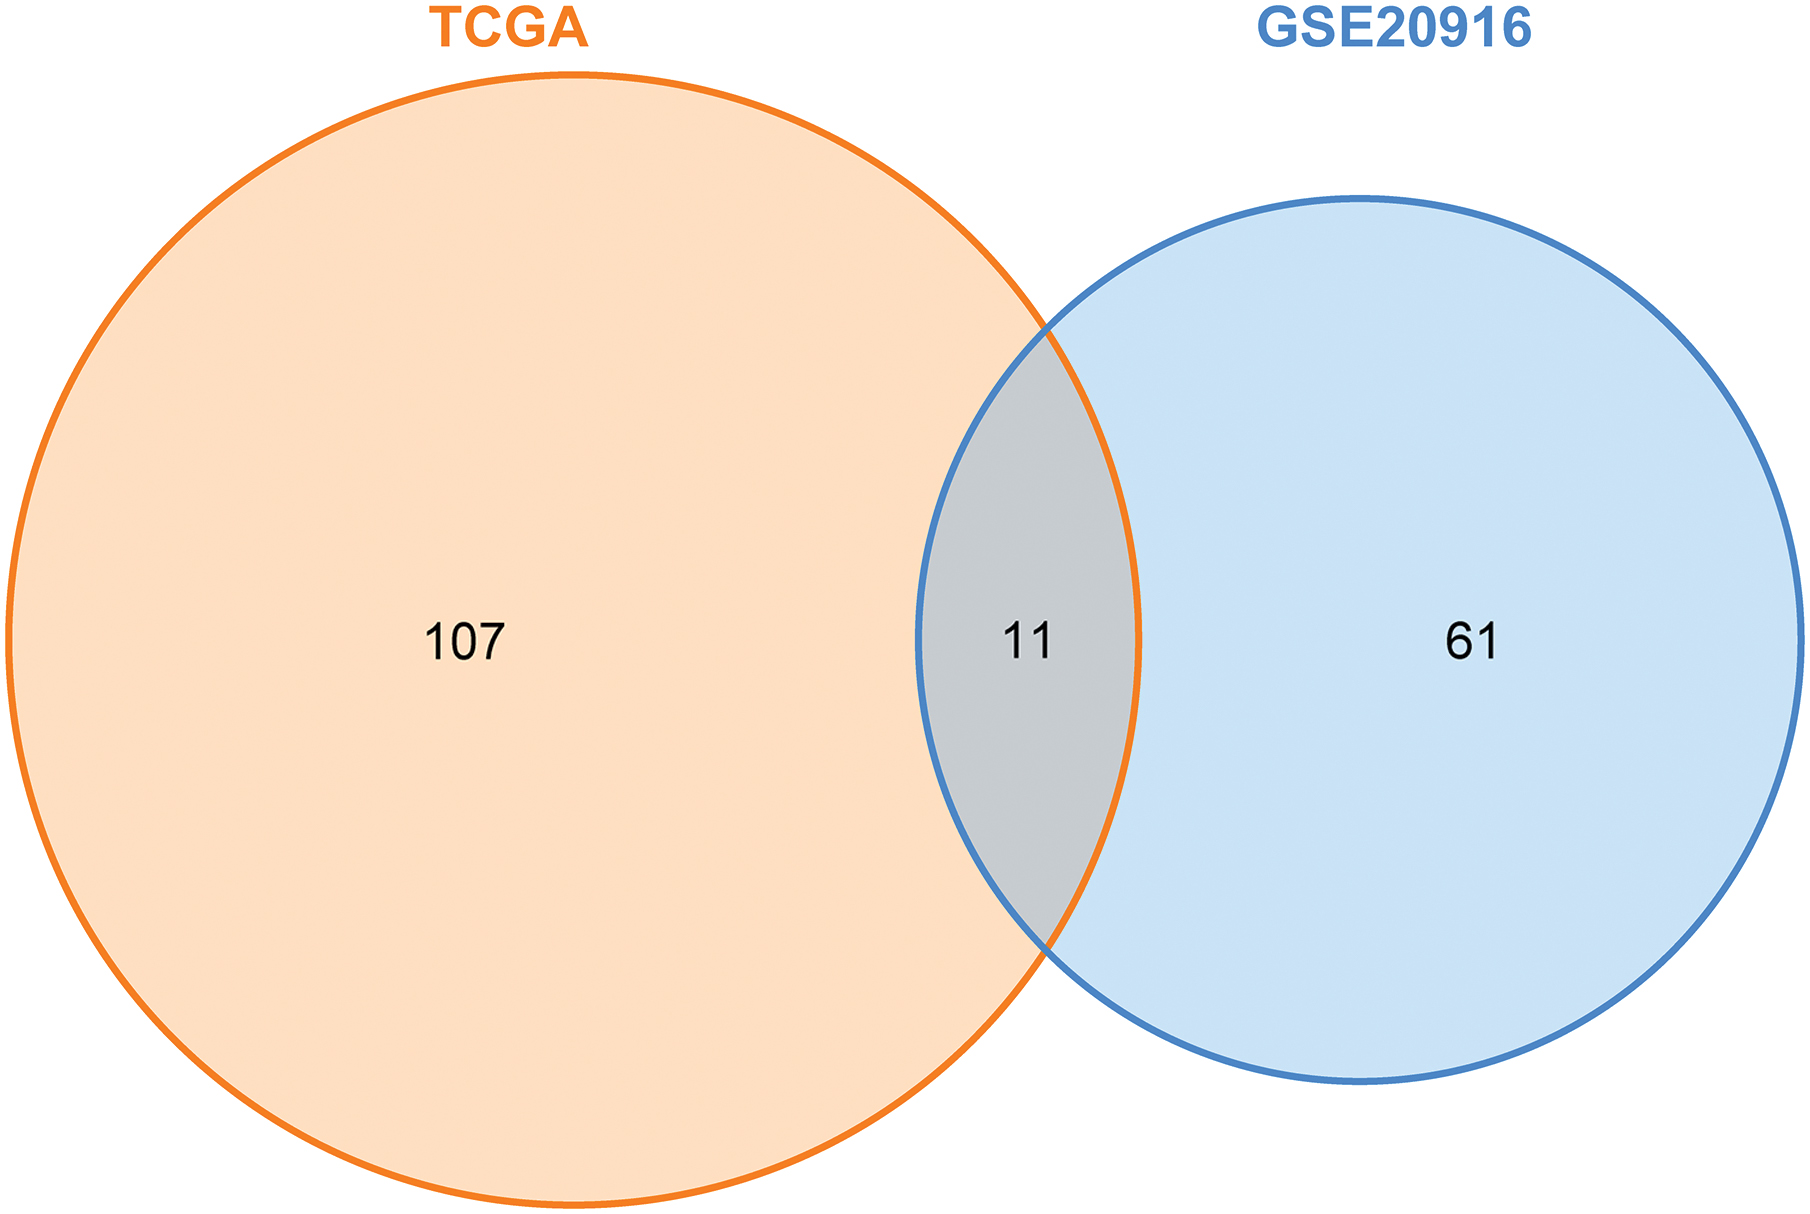
The model was constructed in the training set using the following formula:
where N is the number of lncRNAs, exp is the lncRNA expression value, and coef is the messenger RNA (mRNA) coefficient in the multivariate Cox regression analysis. The testing set and whole set were used to validate the prediction accuracy of the model. The time-dependent receiver operating characteristic (ROC) curve was used to estimate the prediction accuracy of the model in terms of survival by calculating the area under the curve (AUC). We used the surv_cutpoint function in the survminer package to determine the best cutoff value according to the risk score and divided the patients into high- and low-risk groups. The Kaplan–Meier method was used to evaluate the survival difference between the high- and low-risk groups.
Univariate and multivariate Cox proportional hazard regression analyses were performed to assess whether the prognostic model was independent of other clinicopathological features (including age, sex, race, and risk score).
Construction and evaluation of the nomogram
To identify the predicted 3- and 5-year survival probabilities, a nomogram was constructed based on multivariate Cox analysis. Nomograms can predict the prognosis of a patient with cancer by simplifying the complicated prediction model into a profiled chart. A point scale was created to determine the points for the variables, and the sum of the points assigned to each variable was rescaled to a range from 0 to 100. Worse prognoses were represented by higher point totals. The calibration curves were graphically estimated by mapping the predicted probabilities of the nomogram against the actual observed rates. A concordance index (C-index) was used to assess the discrimination of the nomogram. The prediction accuracy was compared between the nomogram and separate prognostic factors using the C-index and ROC analyses.
Co-expression regulatory network and functional analysis
We used gene coexpression to predict the lncRNA-associated target genes in the TCGA training set. The filter threshold was |COR| >0.3 and p < 0.05. The lncRNA-mRNA co-expression network was visualized by using Metascape. The clusterProfiler R package was used to perform Gene Ontology (GO) and Kyoto Encyclopedia of Genes and Genomes (KEGG) enrichment analyses of the lncRNA-related mRNAs. All analyses were performed with default parameters. We also analyzed the correlations of the three most significant mRNAs of each lncRNA.
Results
Identification of differentially expressed lncRNAs
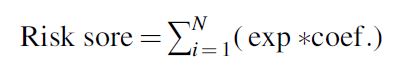
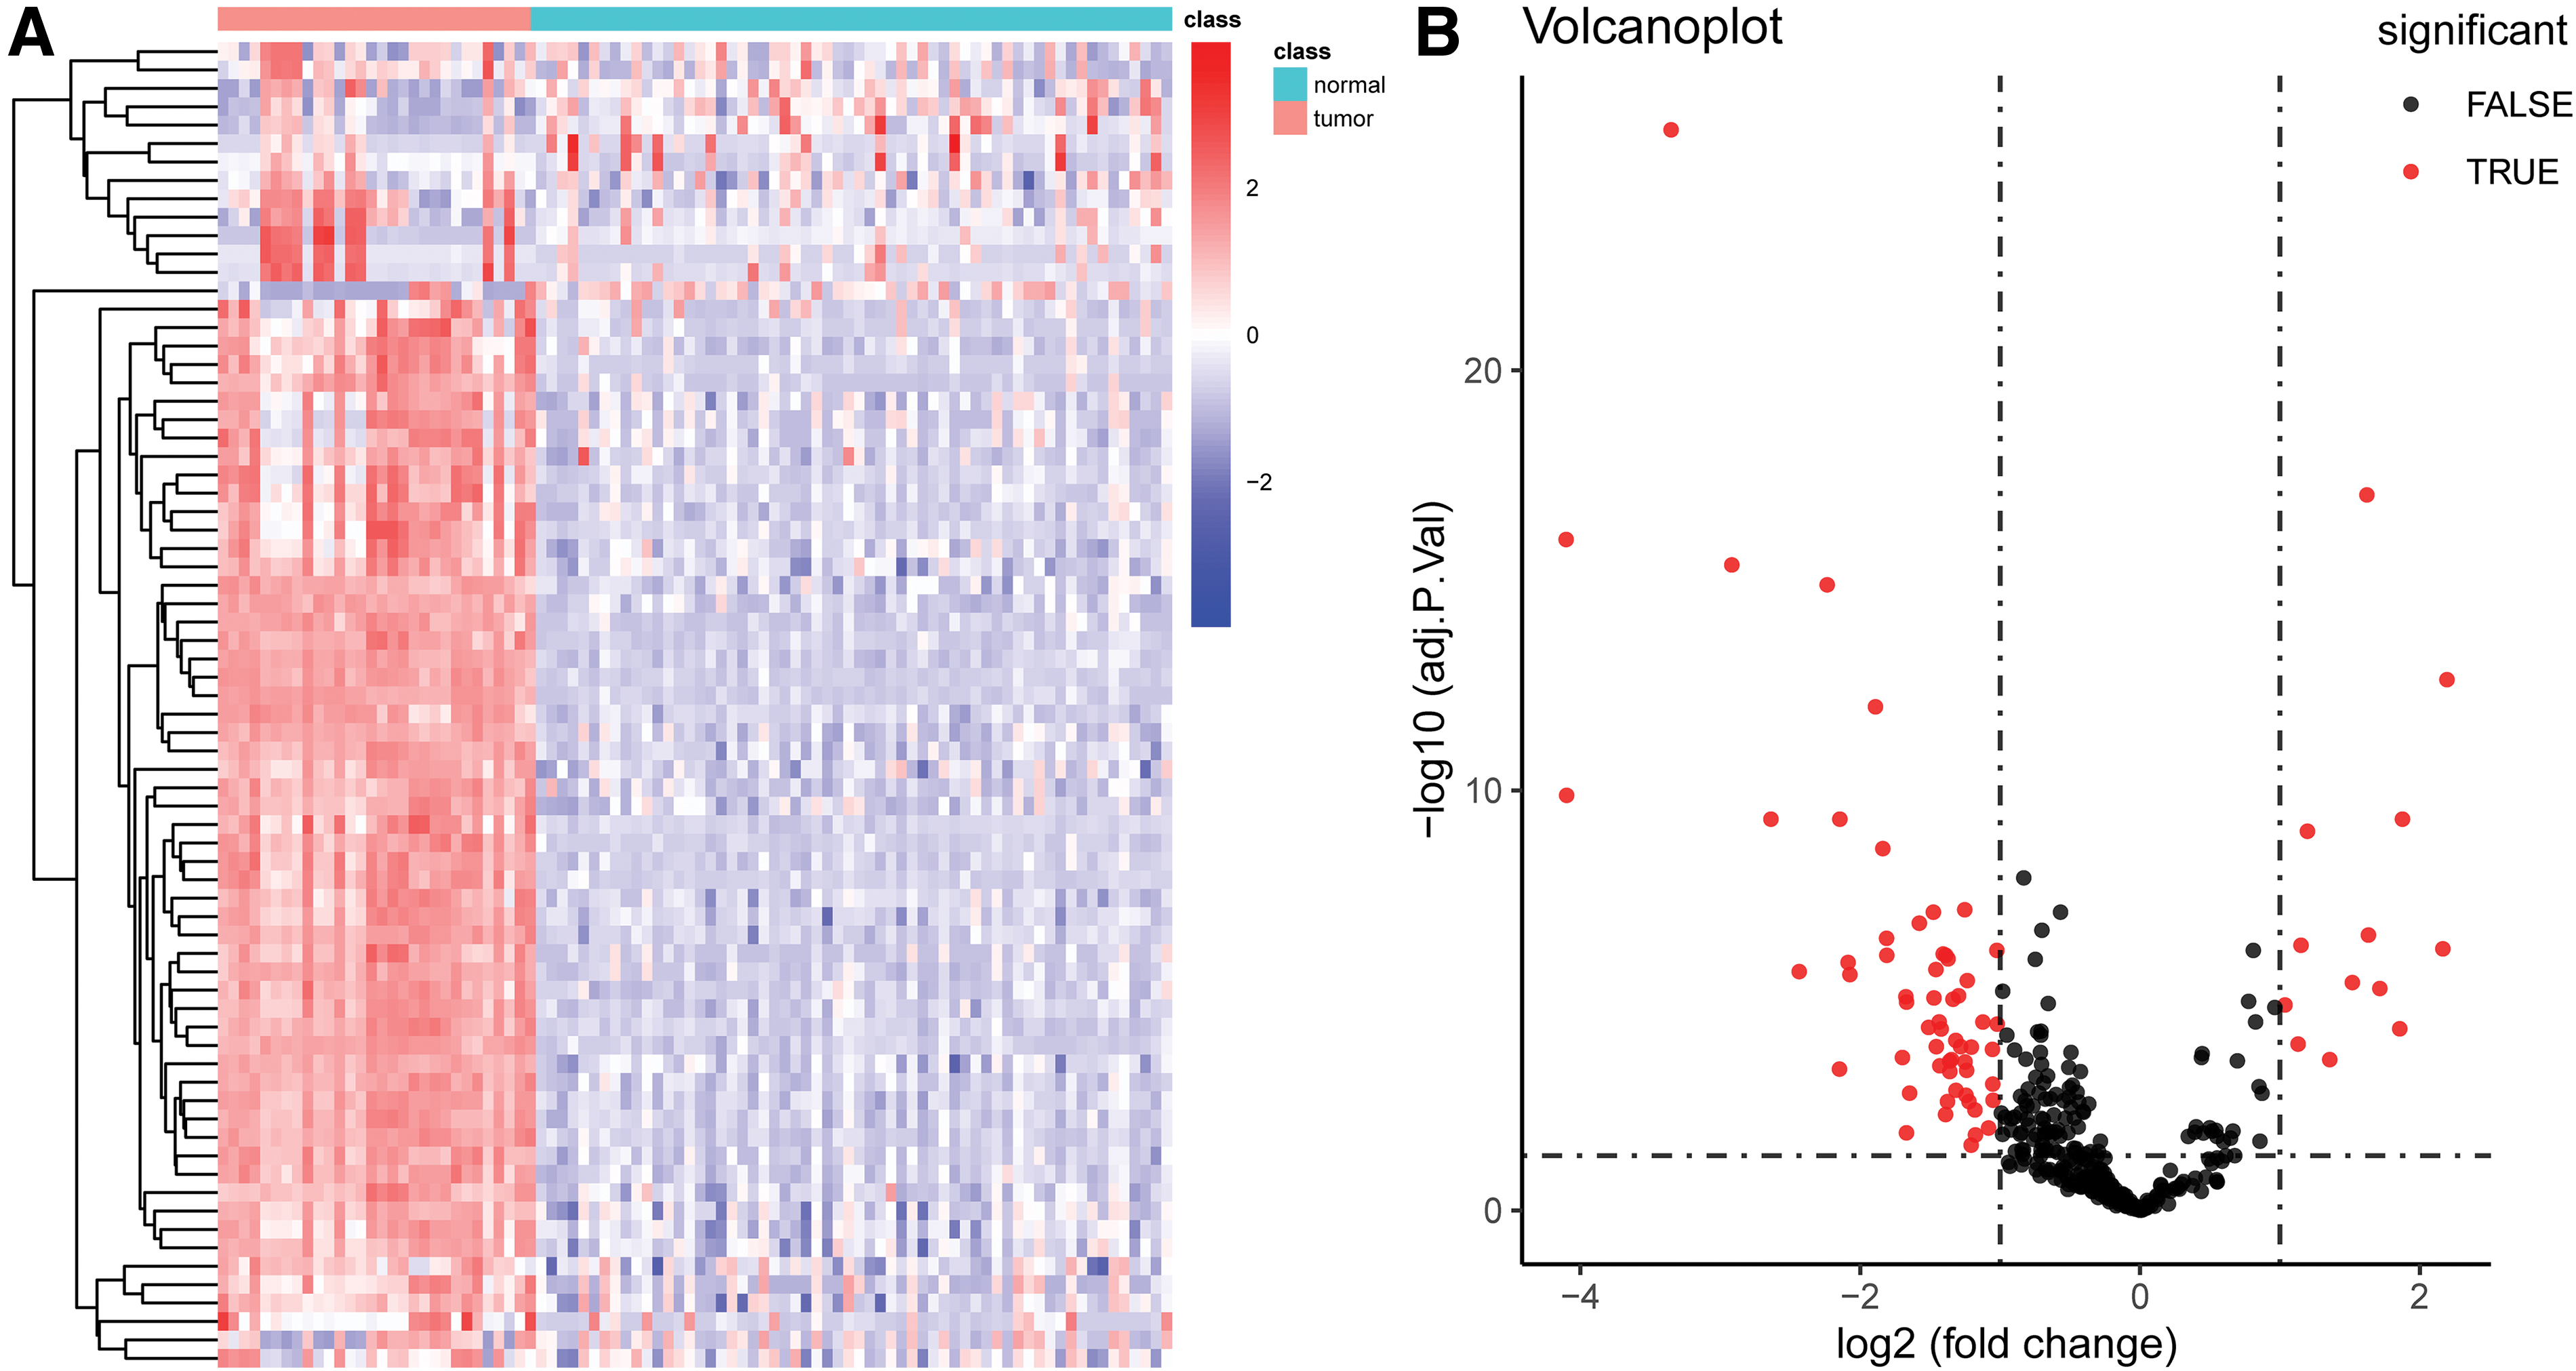
We used the limma package to analyze differences within the GSE20916 dataset. We used a |logFC| of >1 and an adjusted p-value of <0.05 as the differential analysis condition. The volcano diagram and heatmap are given in Figure 1A, B. We screened out 72 DELs, including 13 upregulated and 59 downregulated lncRNAs (Accessory 1). We analyzed the differential lncRNA expression in the CRC patients from the TCGA dataset and set the same threshold as that used with the GSE20916 dataset. The volcano diagram and heatmap are given in Figure 2A, B. We obtained 118 DELs (Accessory 2). A total of 11 lncRNAs were crossed (Fig. 3).
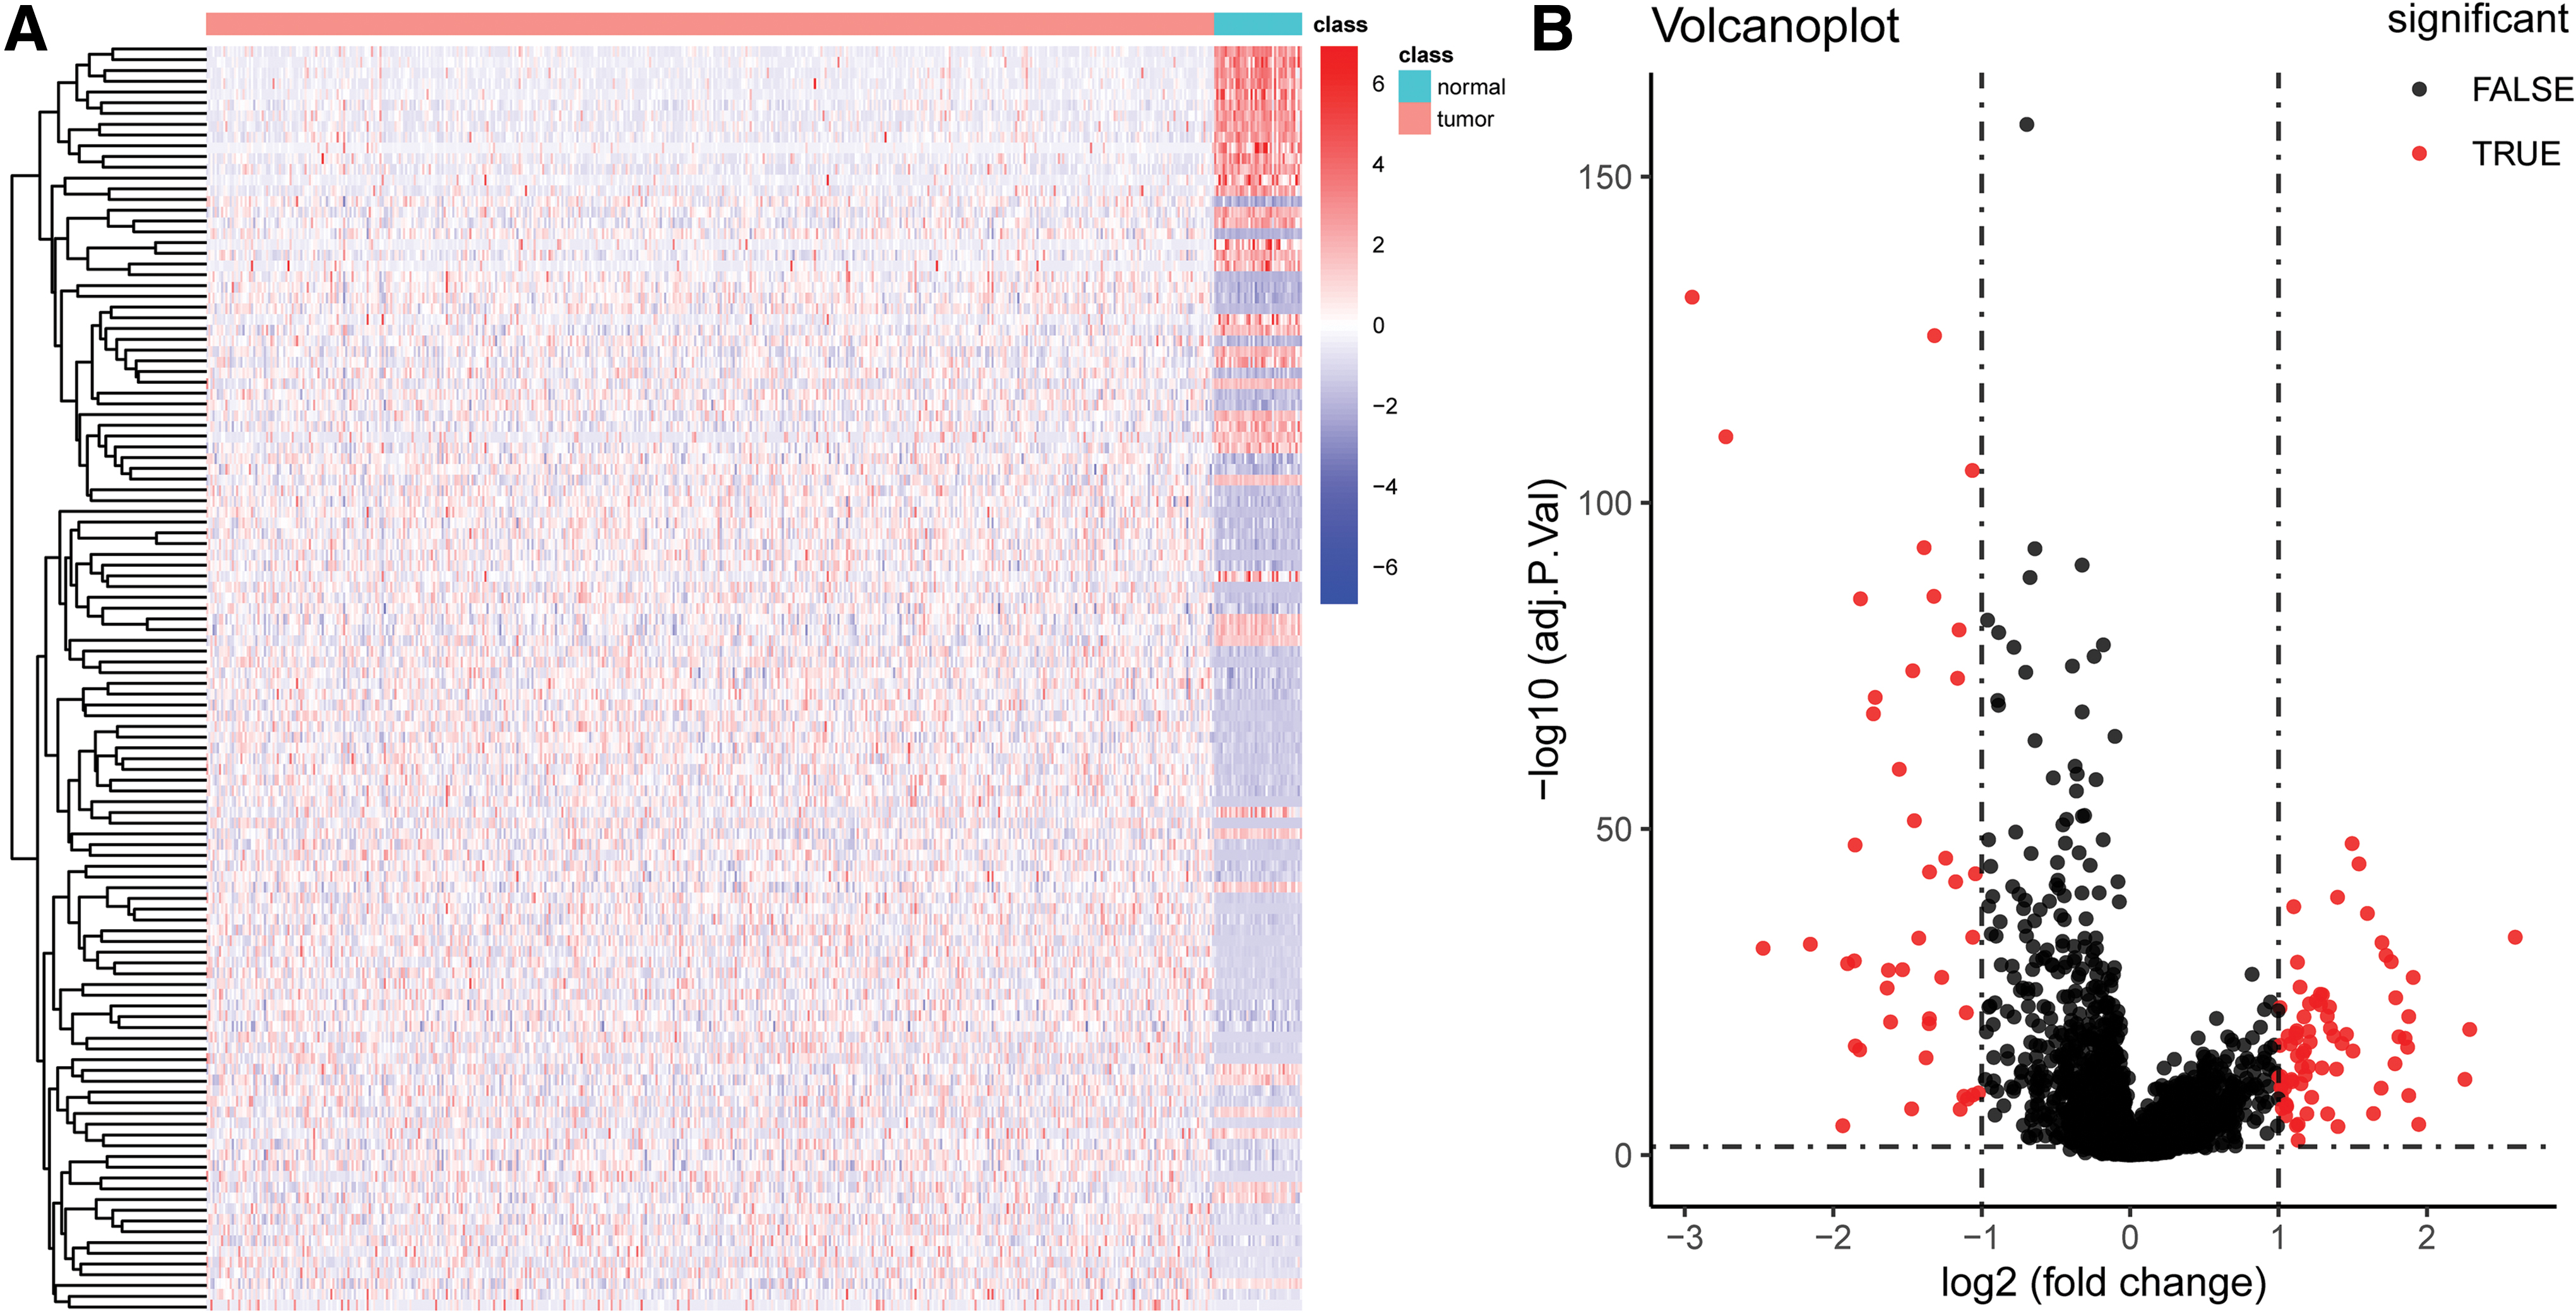
Venn diagram of the GSE20916 and TCGA datasets. Color images are available online.
Derivation of the lncRNA prognostic model
The clinicopathological features of the CRC patients from the TCGA database (age, sex, tumor–node–metastasis [TNM] stage, race, and OS) are given in Table 1.
The Cancer Genome Atlas Clinical Information Training and Validation Datasets
OS, overall survival.
First, we performed univariate Cox analysis to study the correlations between the crossed DELs and OS of the CRC patients in the training set. With p < 0.05 as an identification standard, two lncRNAs were screened out (Table 2).
Univariate Cox Analysis in 11 Long Noncoding RNAs
p < 0.05.
CI, confidence interval.
We then conducted multivariate Cox analysis of the two lncRNAs in the training dataset. The coefficients for each lncRNA were the coefficients in the multivariate Cox analysis. The following model was derived:
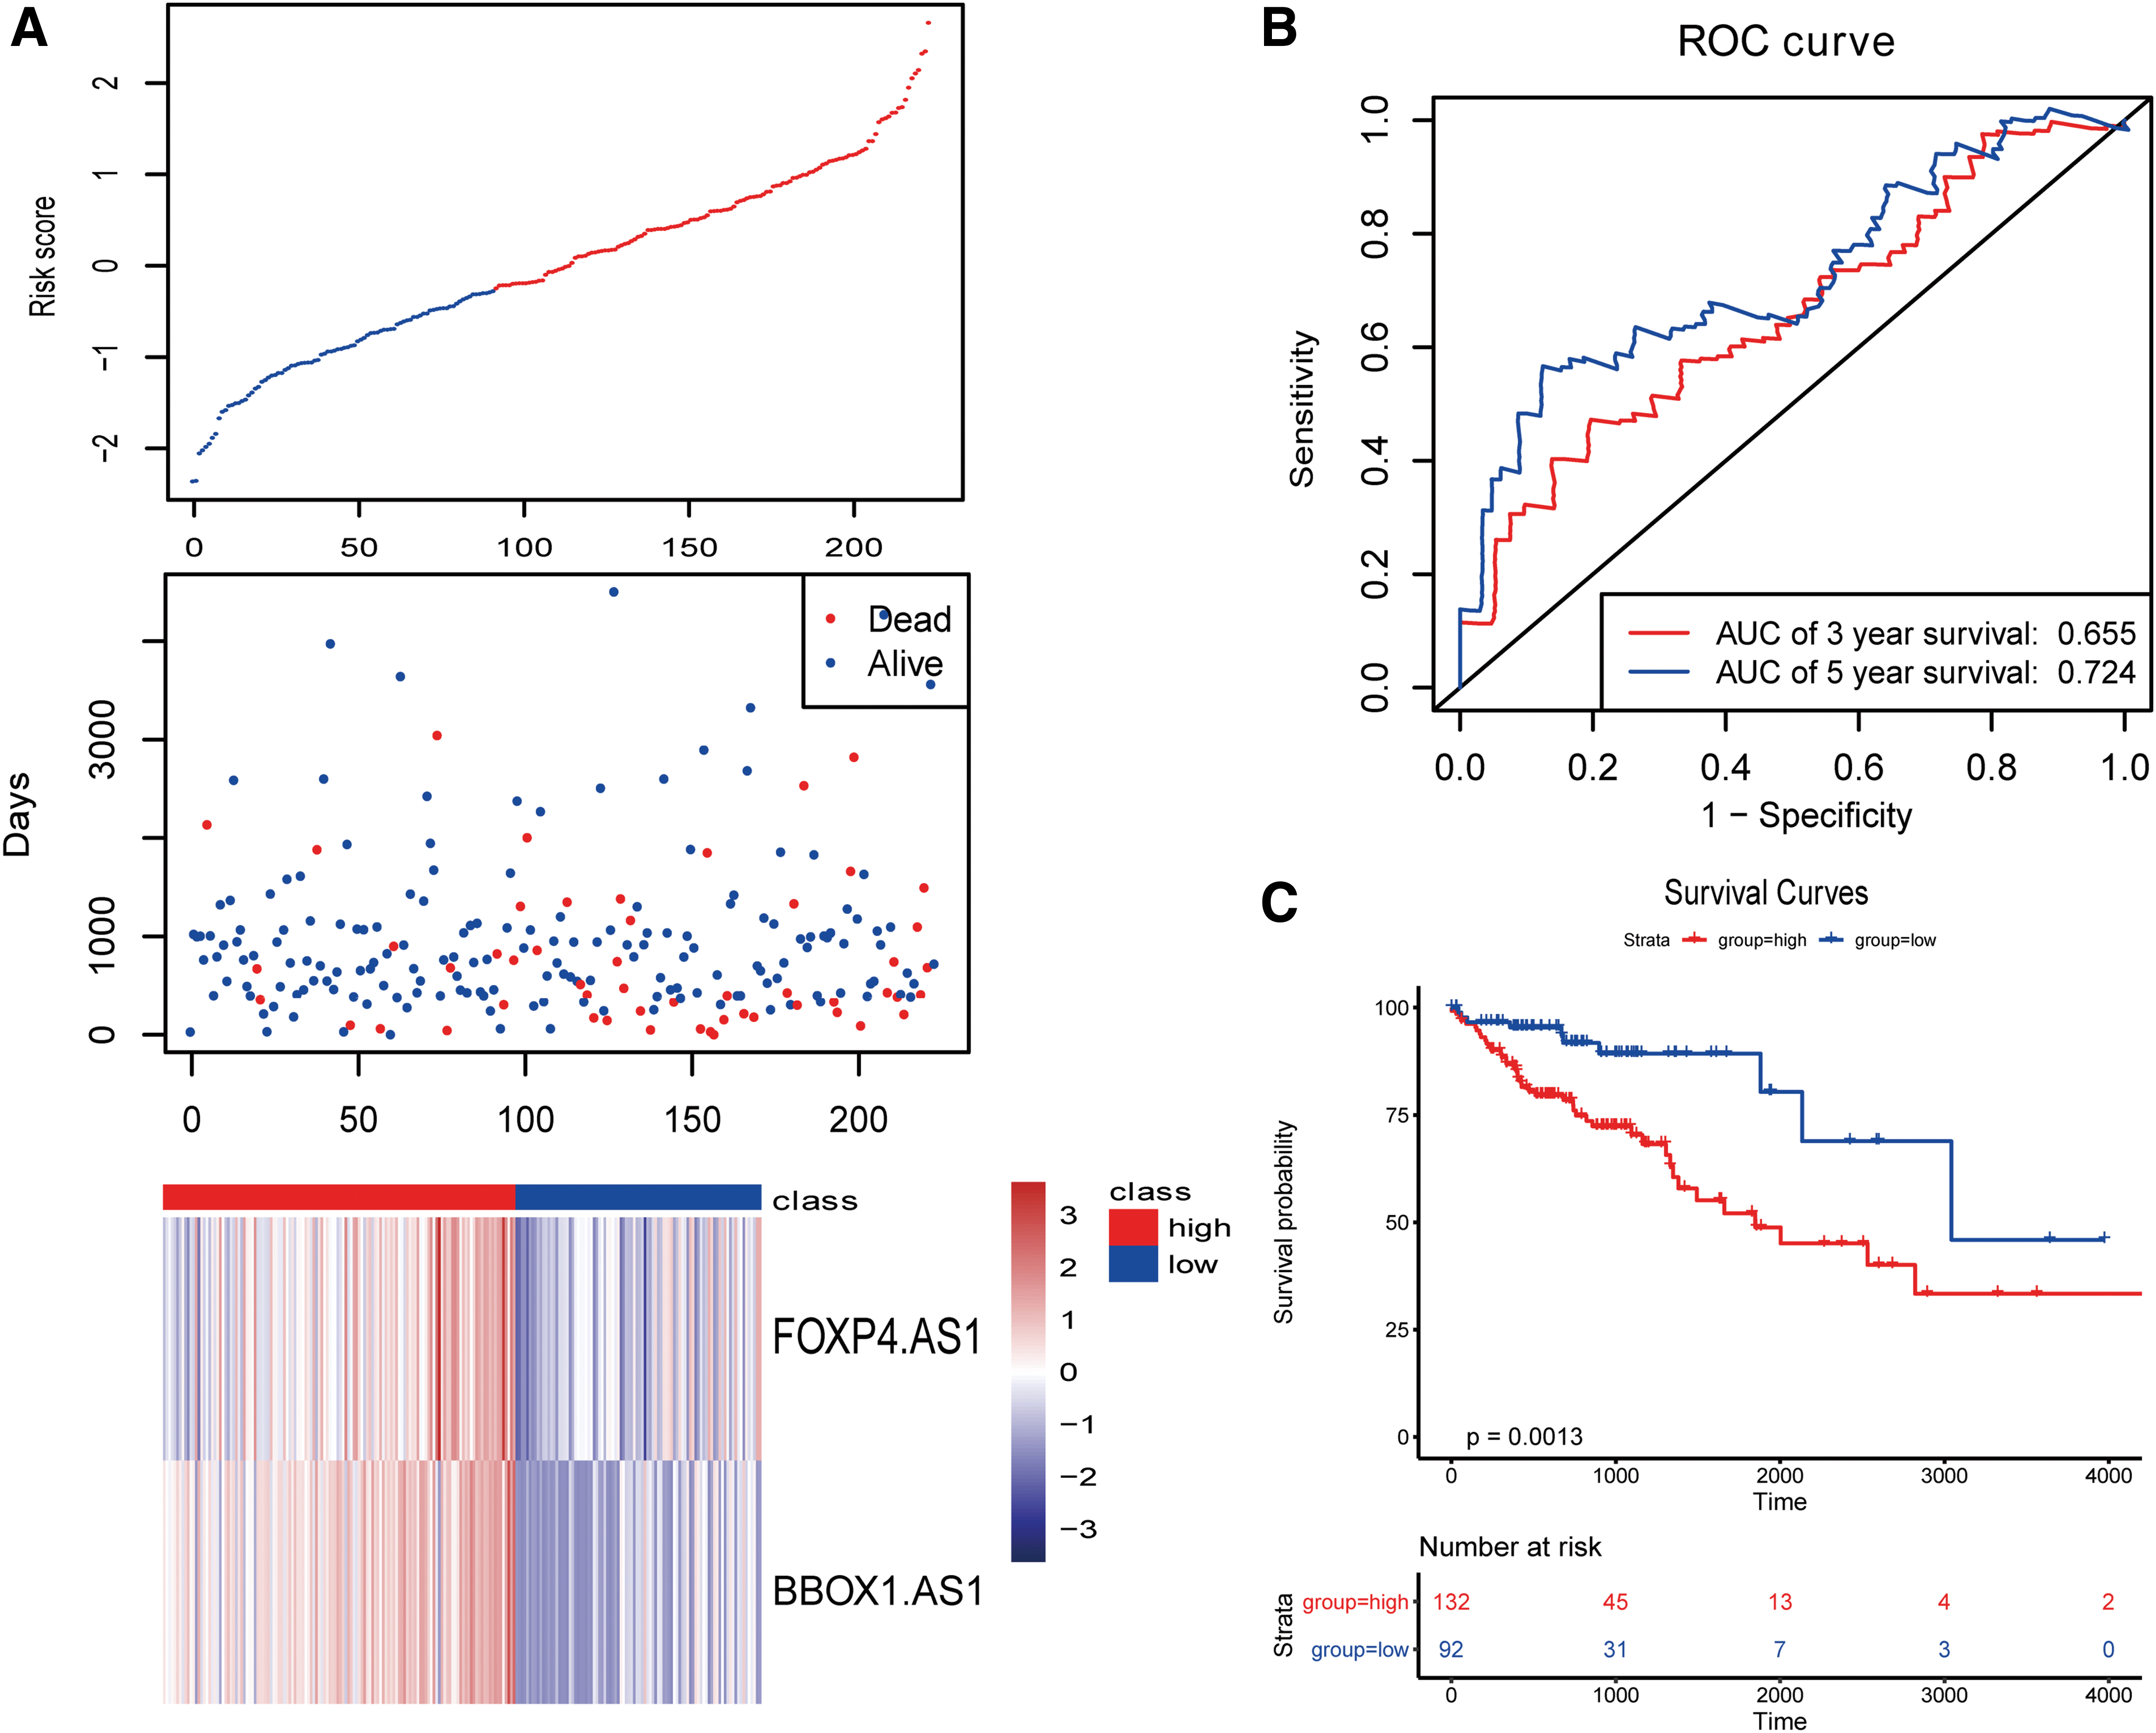
We used the survminer package to determine the best cutoff value based on the risk score and divided the patients into high- and low-risk groups. Then, we performed survival analysis based on the risk score and found that patients at high and low risk could be significantly separated. At the same time, we calculated the ROC curve and found that the AUC was 0.724, which proved that the predictive ability of the model was strong. The survival and ROC curves are given in Figure 4.
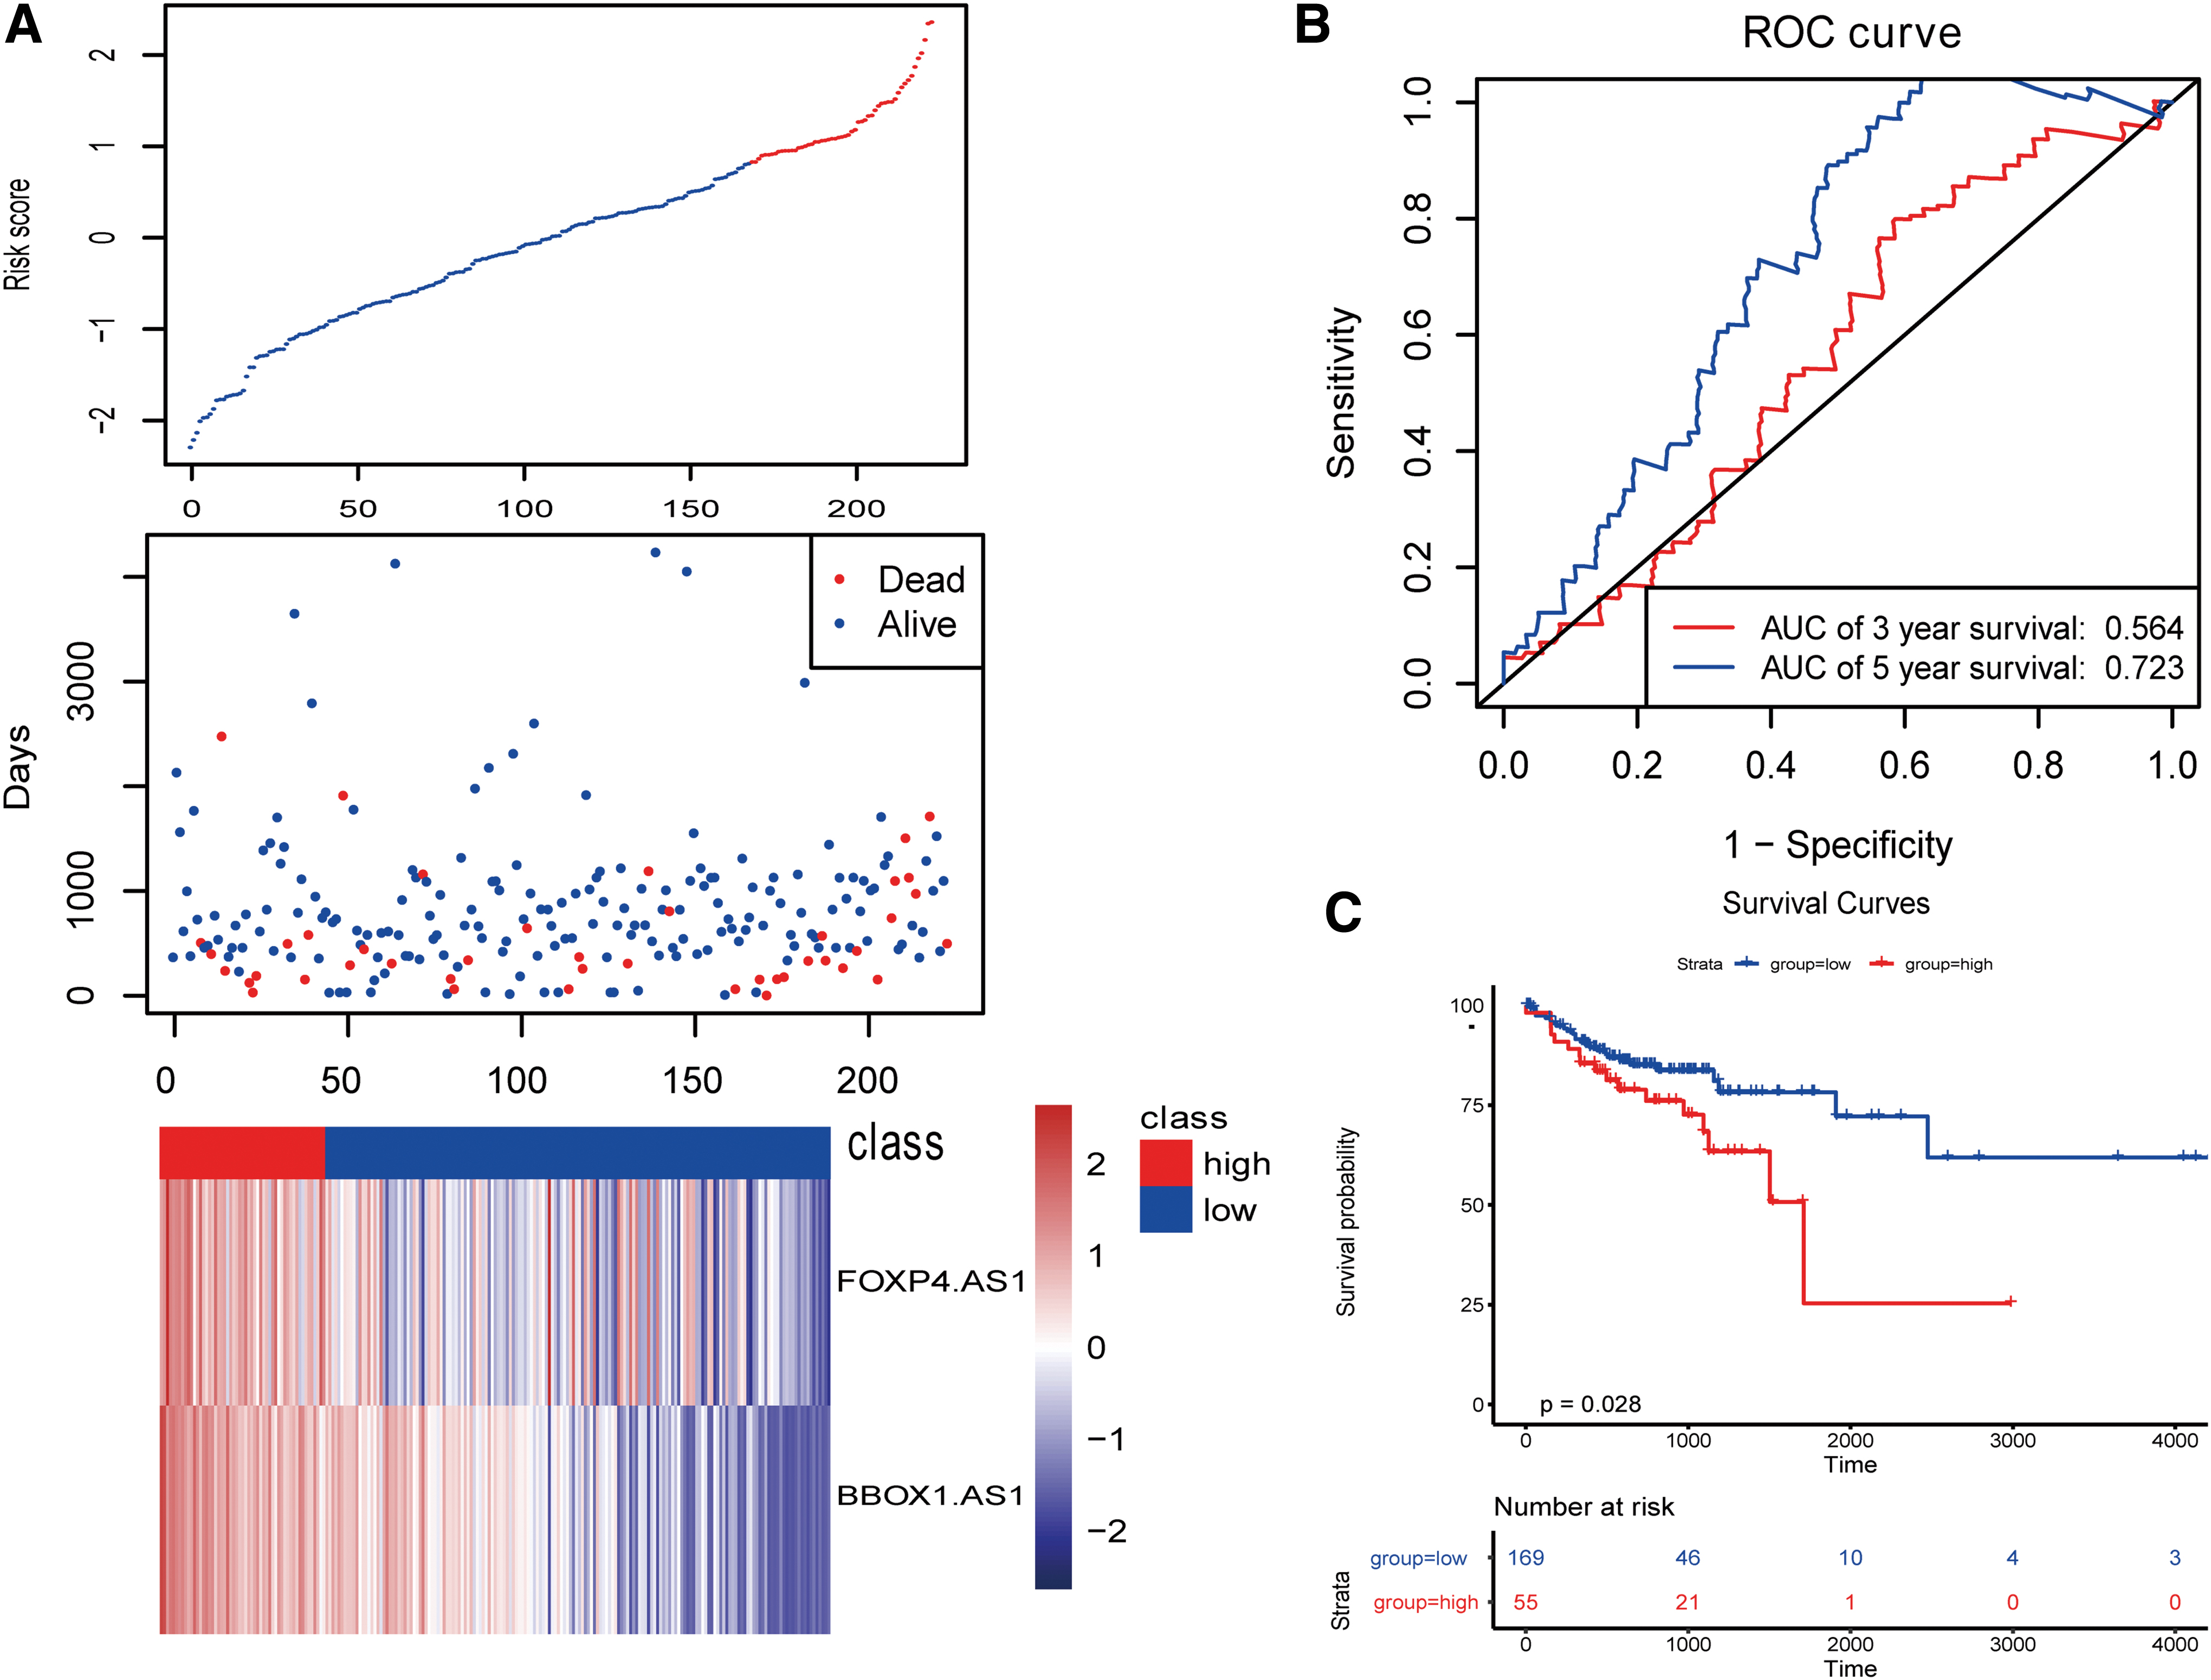
We then validated the two lncRNAs in the validation set (Fig. 5).
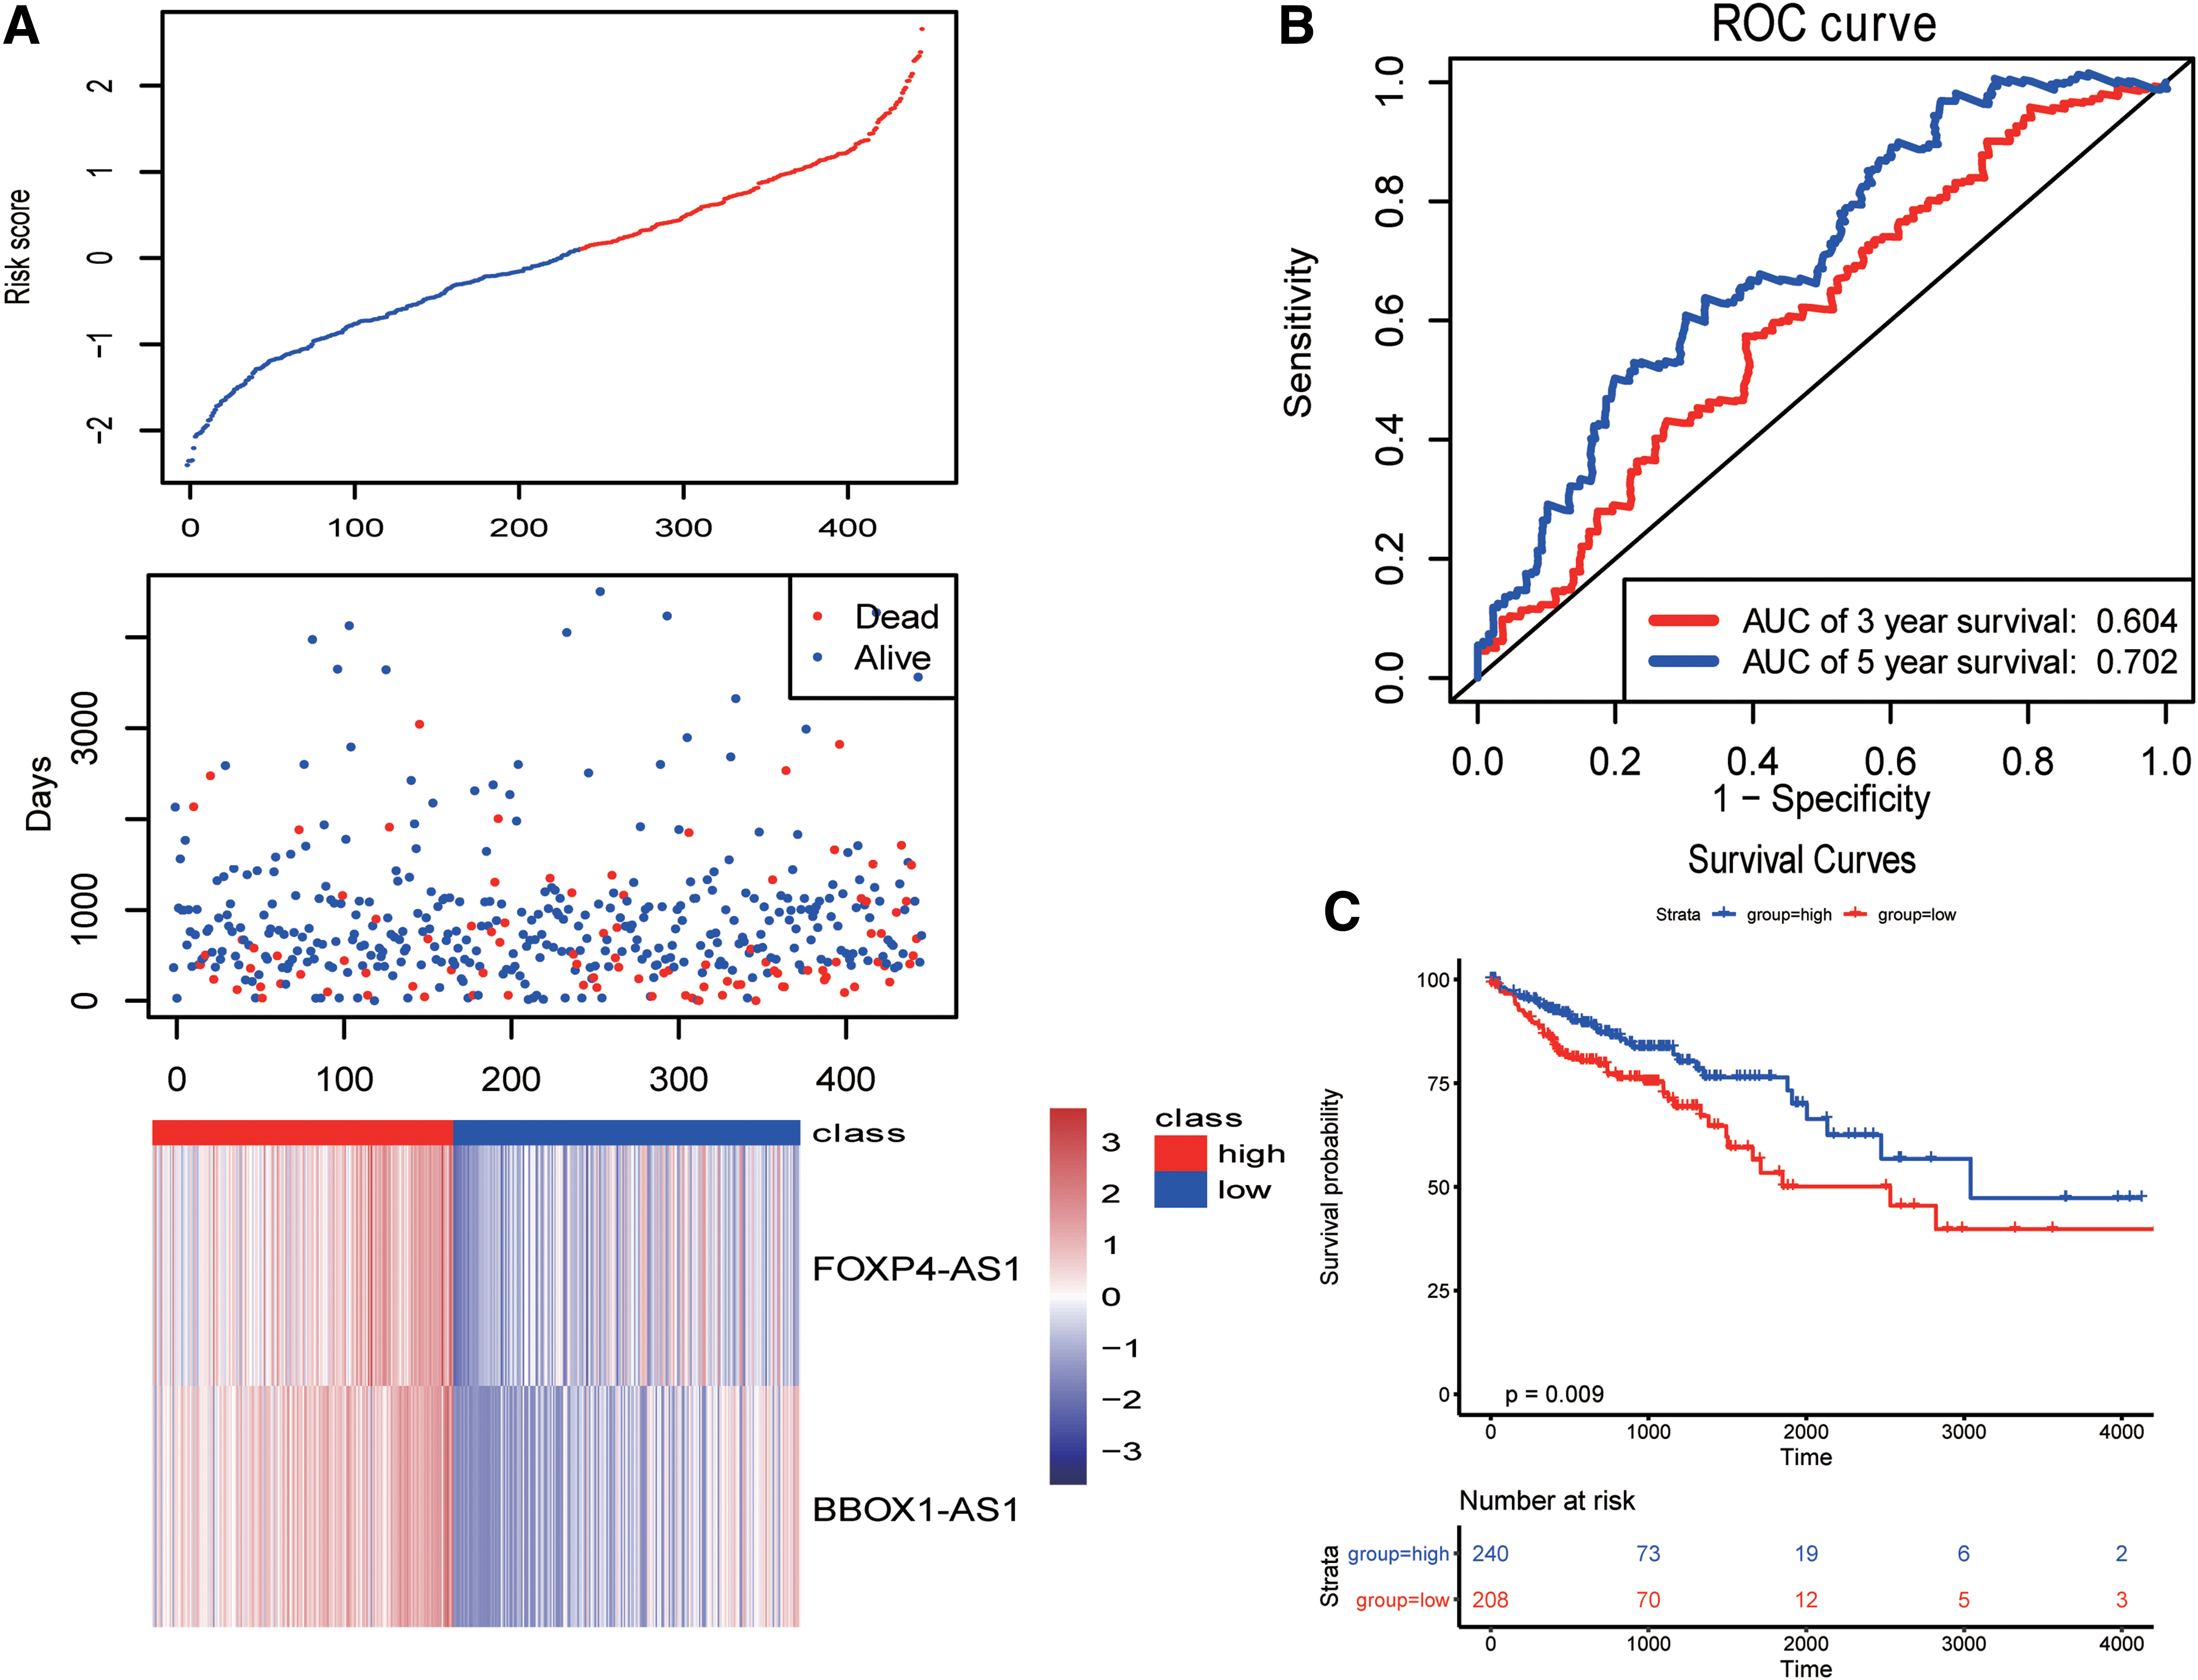
Finally, we validated the model using all the TCGA samples (Fig. 6). As given in Figures 4–6, the 5-year AUCs were all >0.7, suggesting that the model had good predictive ability.
Risk model and clinical characteristics analysis
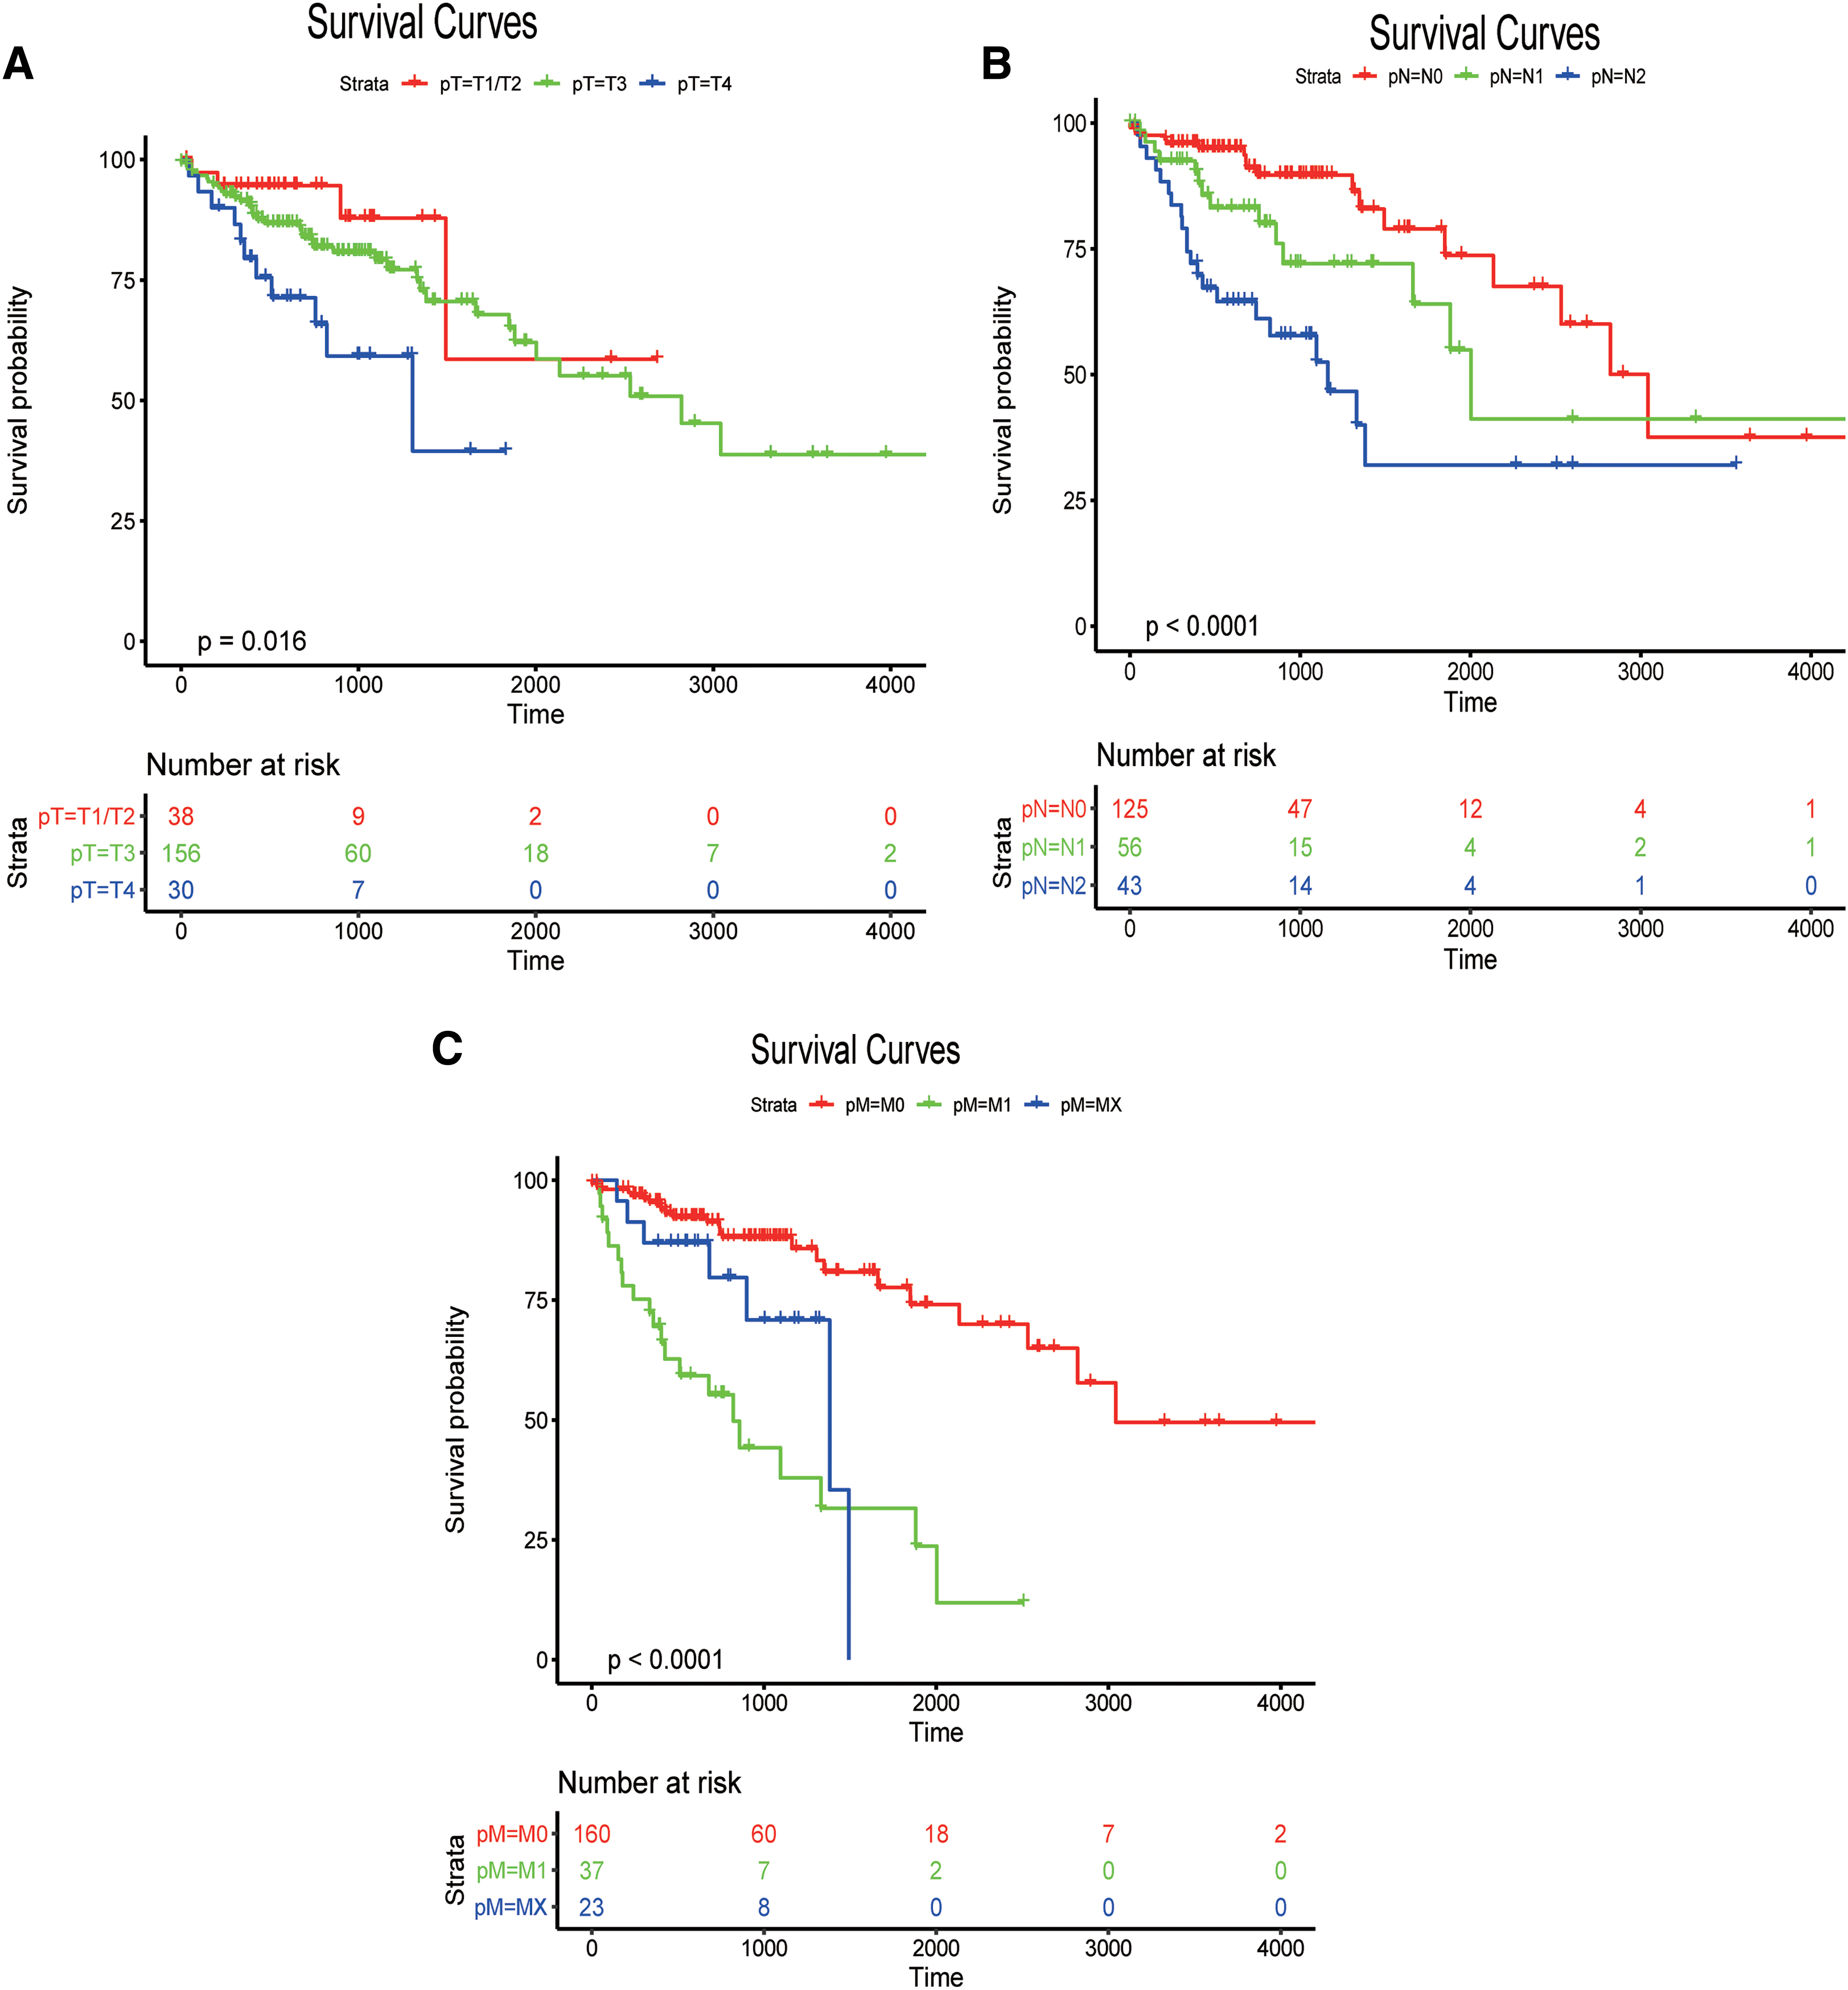
To explore the relationships between the prediction accuracy of the risk model and clinical characteristics, we analyzed the predictive relationships between the clinical features and risk score by using univariate and multivariate Cox analyses. The p-value of the predictive significance of the risk score was minimal (Tables 3 and 4). The survival curves for the meaningful variables in the univariate Cox analysis are given in Figure 7.
Univariate Cox Analysis
Multivariate Cox Analysis
Line diagram and decline curve analysis of the model
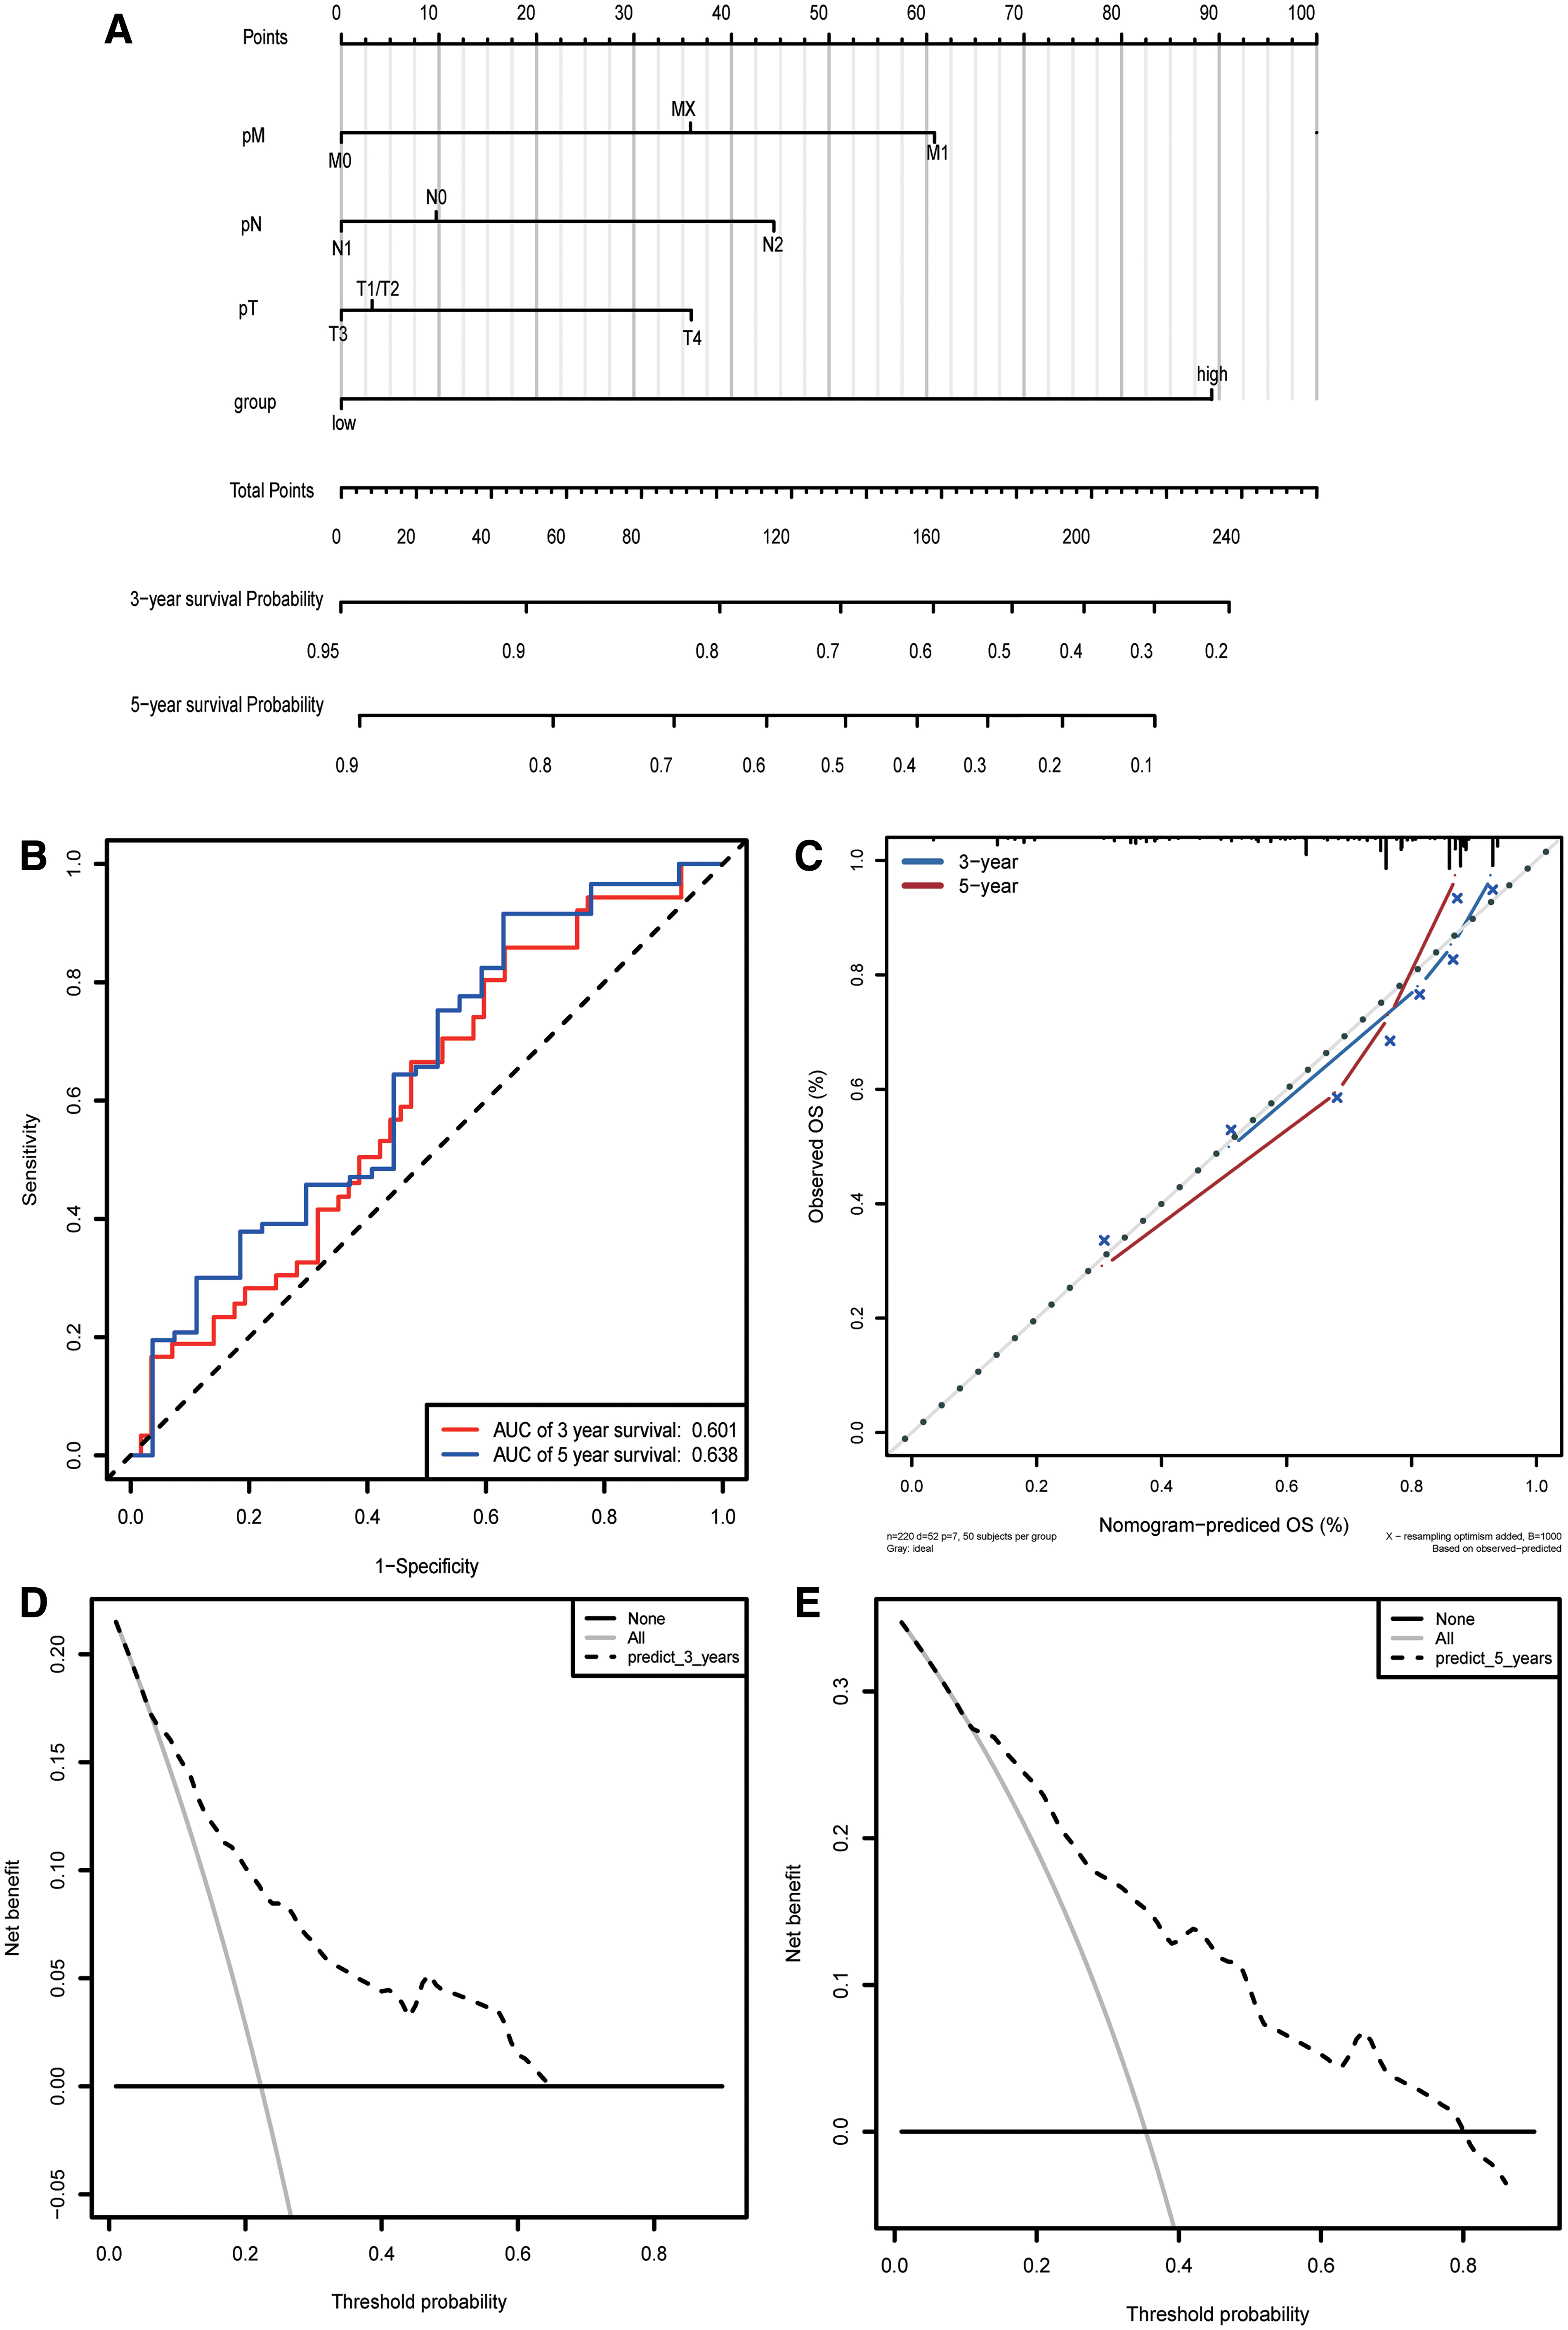
We use TNM stages together with the risk score to construct the column line graph model (Fig. 8A). We calculated the prediction accuracy of the nomogram by using ROC analysis, which showed that the 3- and 5-year AUCs were 0.601 and 0.638, respectively (Fig. 8B). Figure 8C shows the 3-year nomogram model compared with the ideal model. Some indices of the 3-year model were basically consistent with those of the ideal model, suggesting that we constructed a model with high accuracy. Decline curve analysis showed that our model had a good net benefit in 3 and 5 years, indicating the substantial practical clinical value of the model.
LncRNA coexpression network and functional assessment of lncRNA-related mRNAs
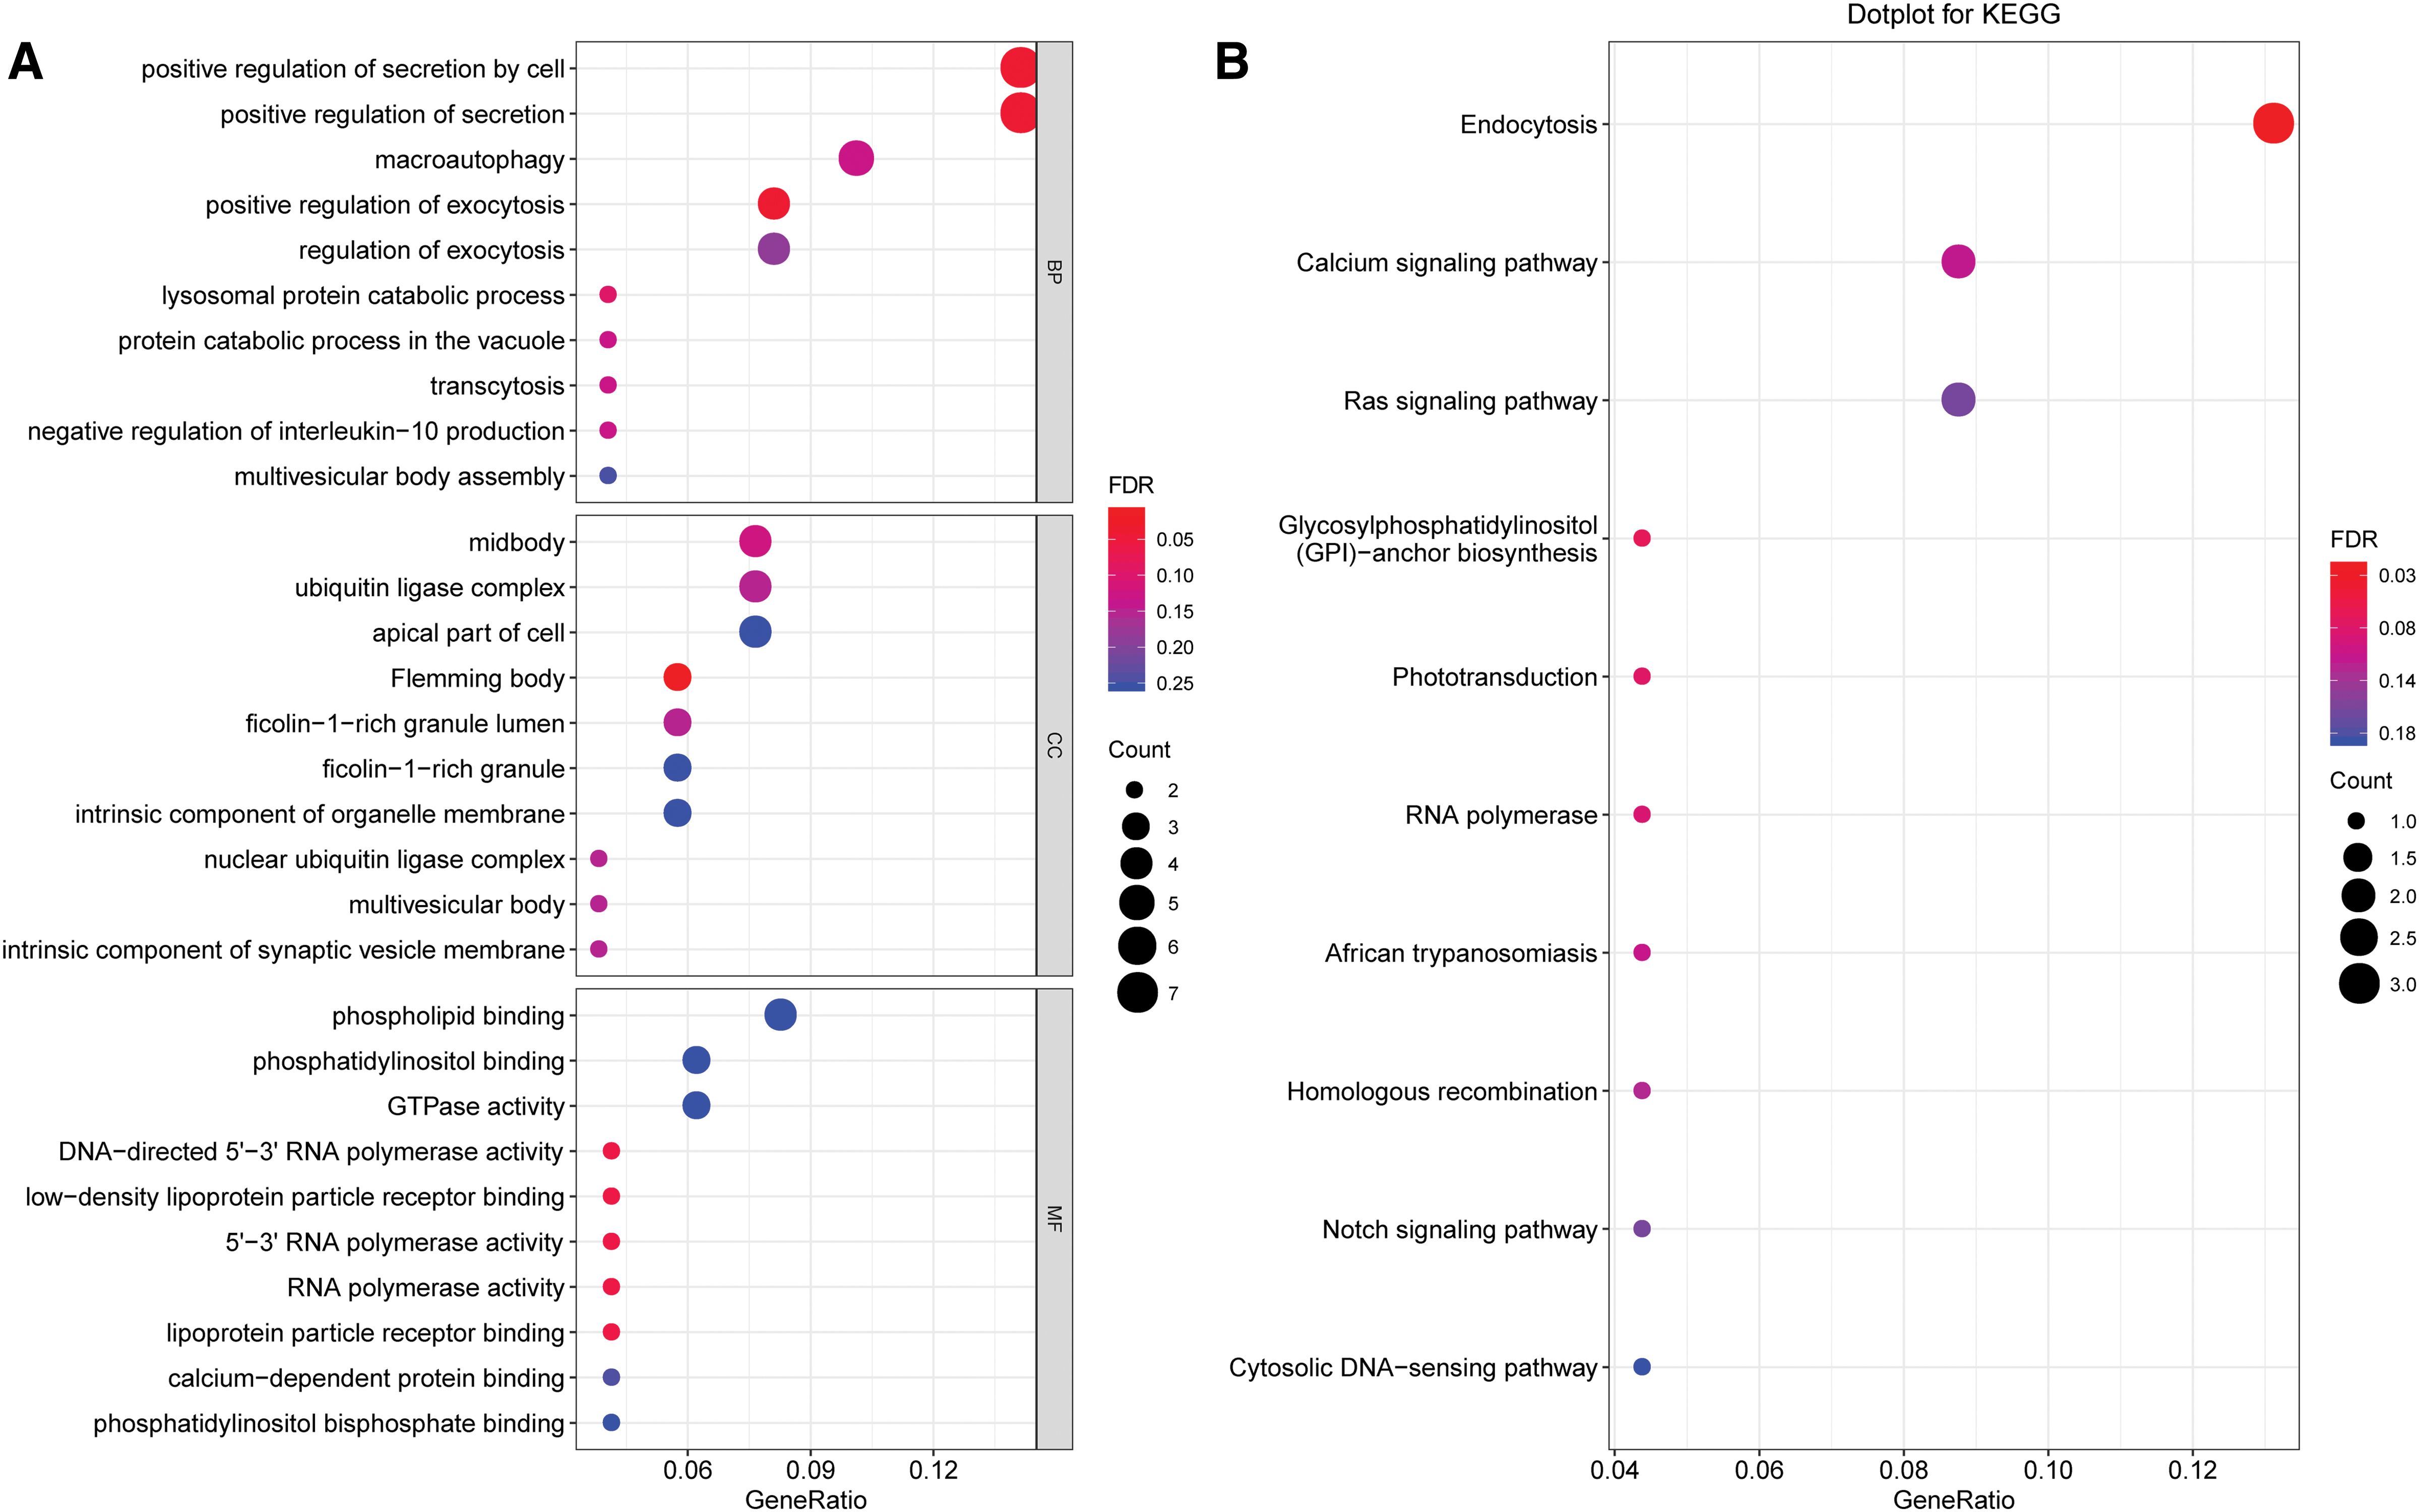
A total of 1977 target genes (the absolute value of the screening threshold was >0.3, p < 0.05) were included in the analysis (Fig. 9, Accessory 3). Then, we conducted enrichment analysis of the selected target genes, for which the enrichment pathway selection threshold was p < 0.05. The significantly enriched pathways are given in Figure 10.
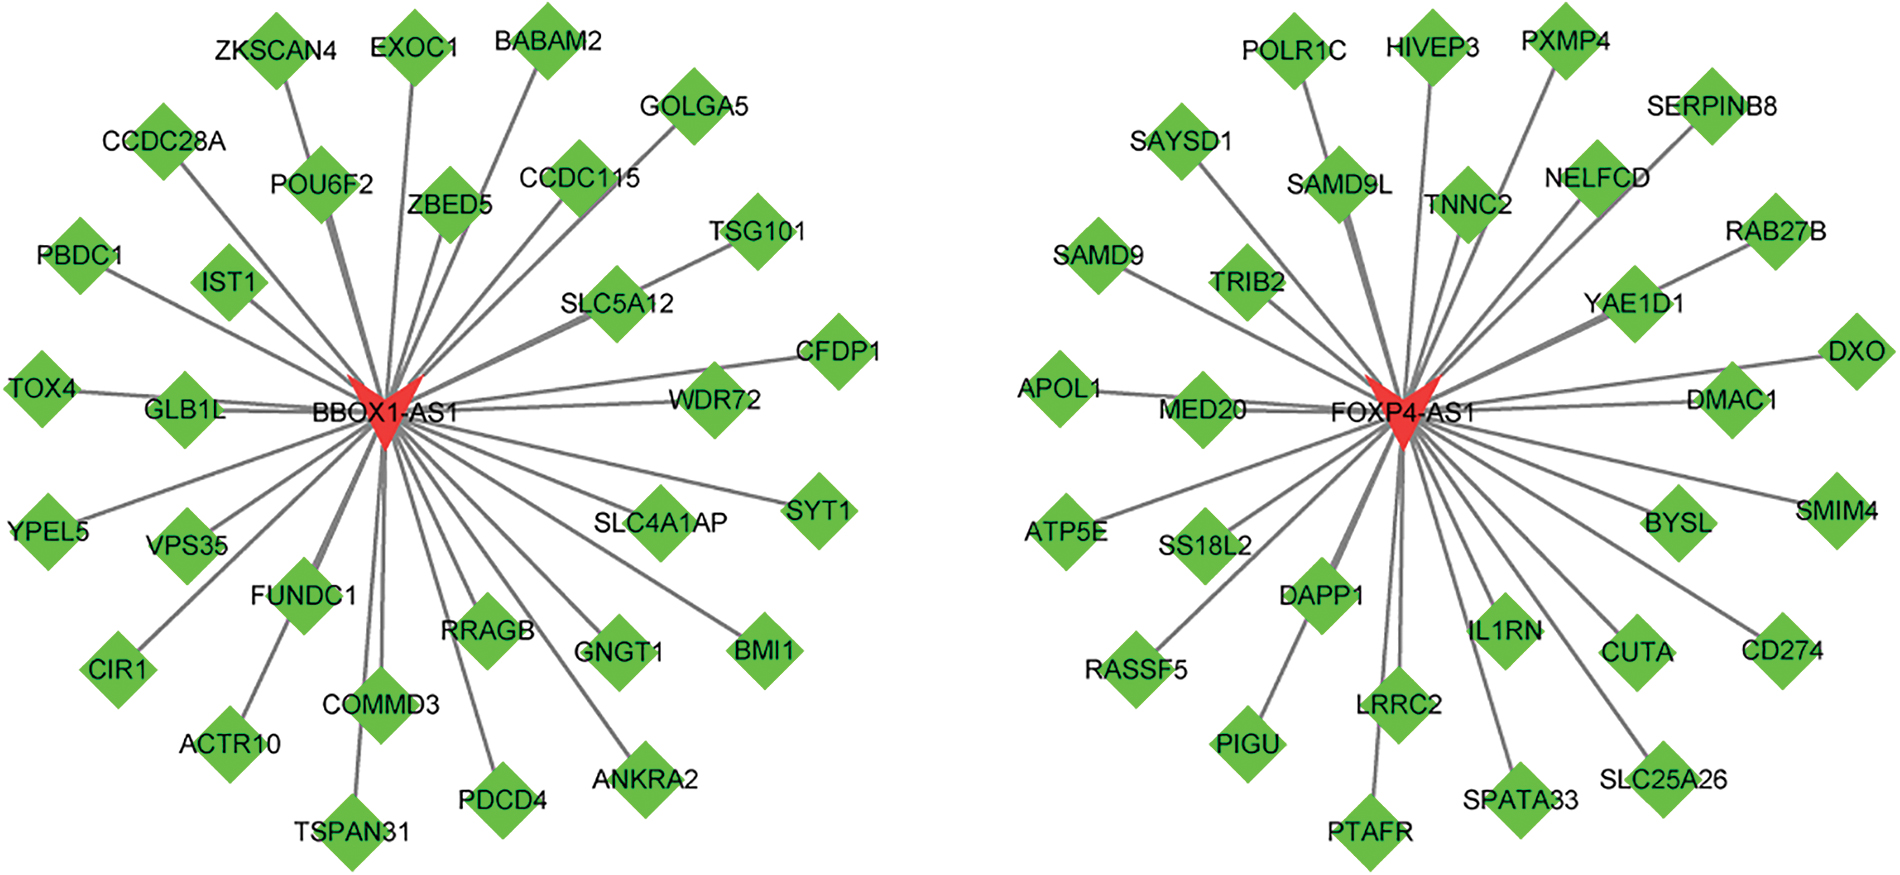
LncRNA coexpressed regulatory network with mRNA Green represents target genes, and red represents lncRNA. mRNA, messenger RNA. Color images are available online.
Functional analysis of coexpressed mRNA
For biological processes, associated differentially expressed genes were mainly enriched in positive regulation of secretion by cells, positive regulation of secretion, and positive regulation of exocytosis. The molecular functions of these genes were enriched in DNA-directed 5′-3′ RNA polymerase activity, low-density lipoprotein particle receptor binding, 5′-3′ RNA polymerase activity, RNA polymerase activity, and lipoprotein particle receptor binding. The cellular components for these genes were mainly involved in the Flemming body. The KEGG enrichment analysis showed that the differentially expressed genes were mainly enriched in endocytosis and the calcium signaling pathway.
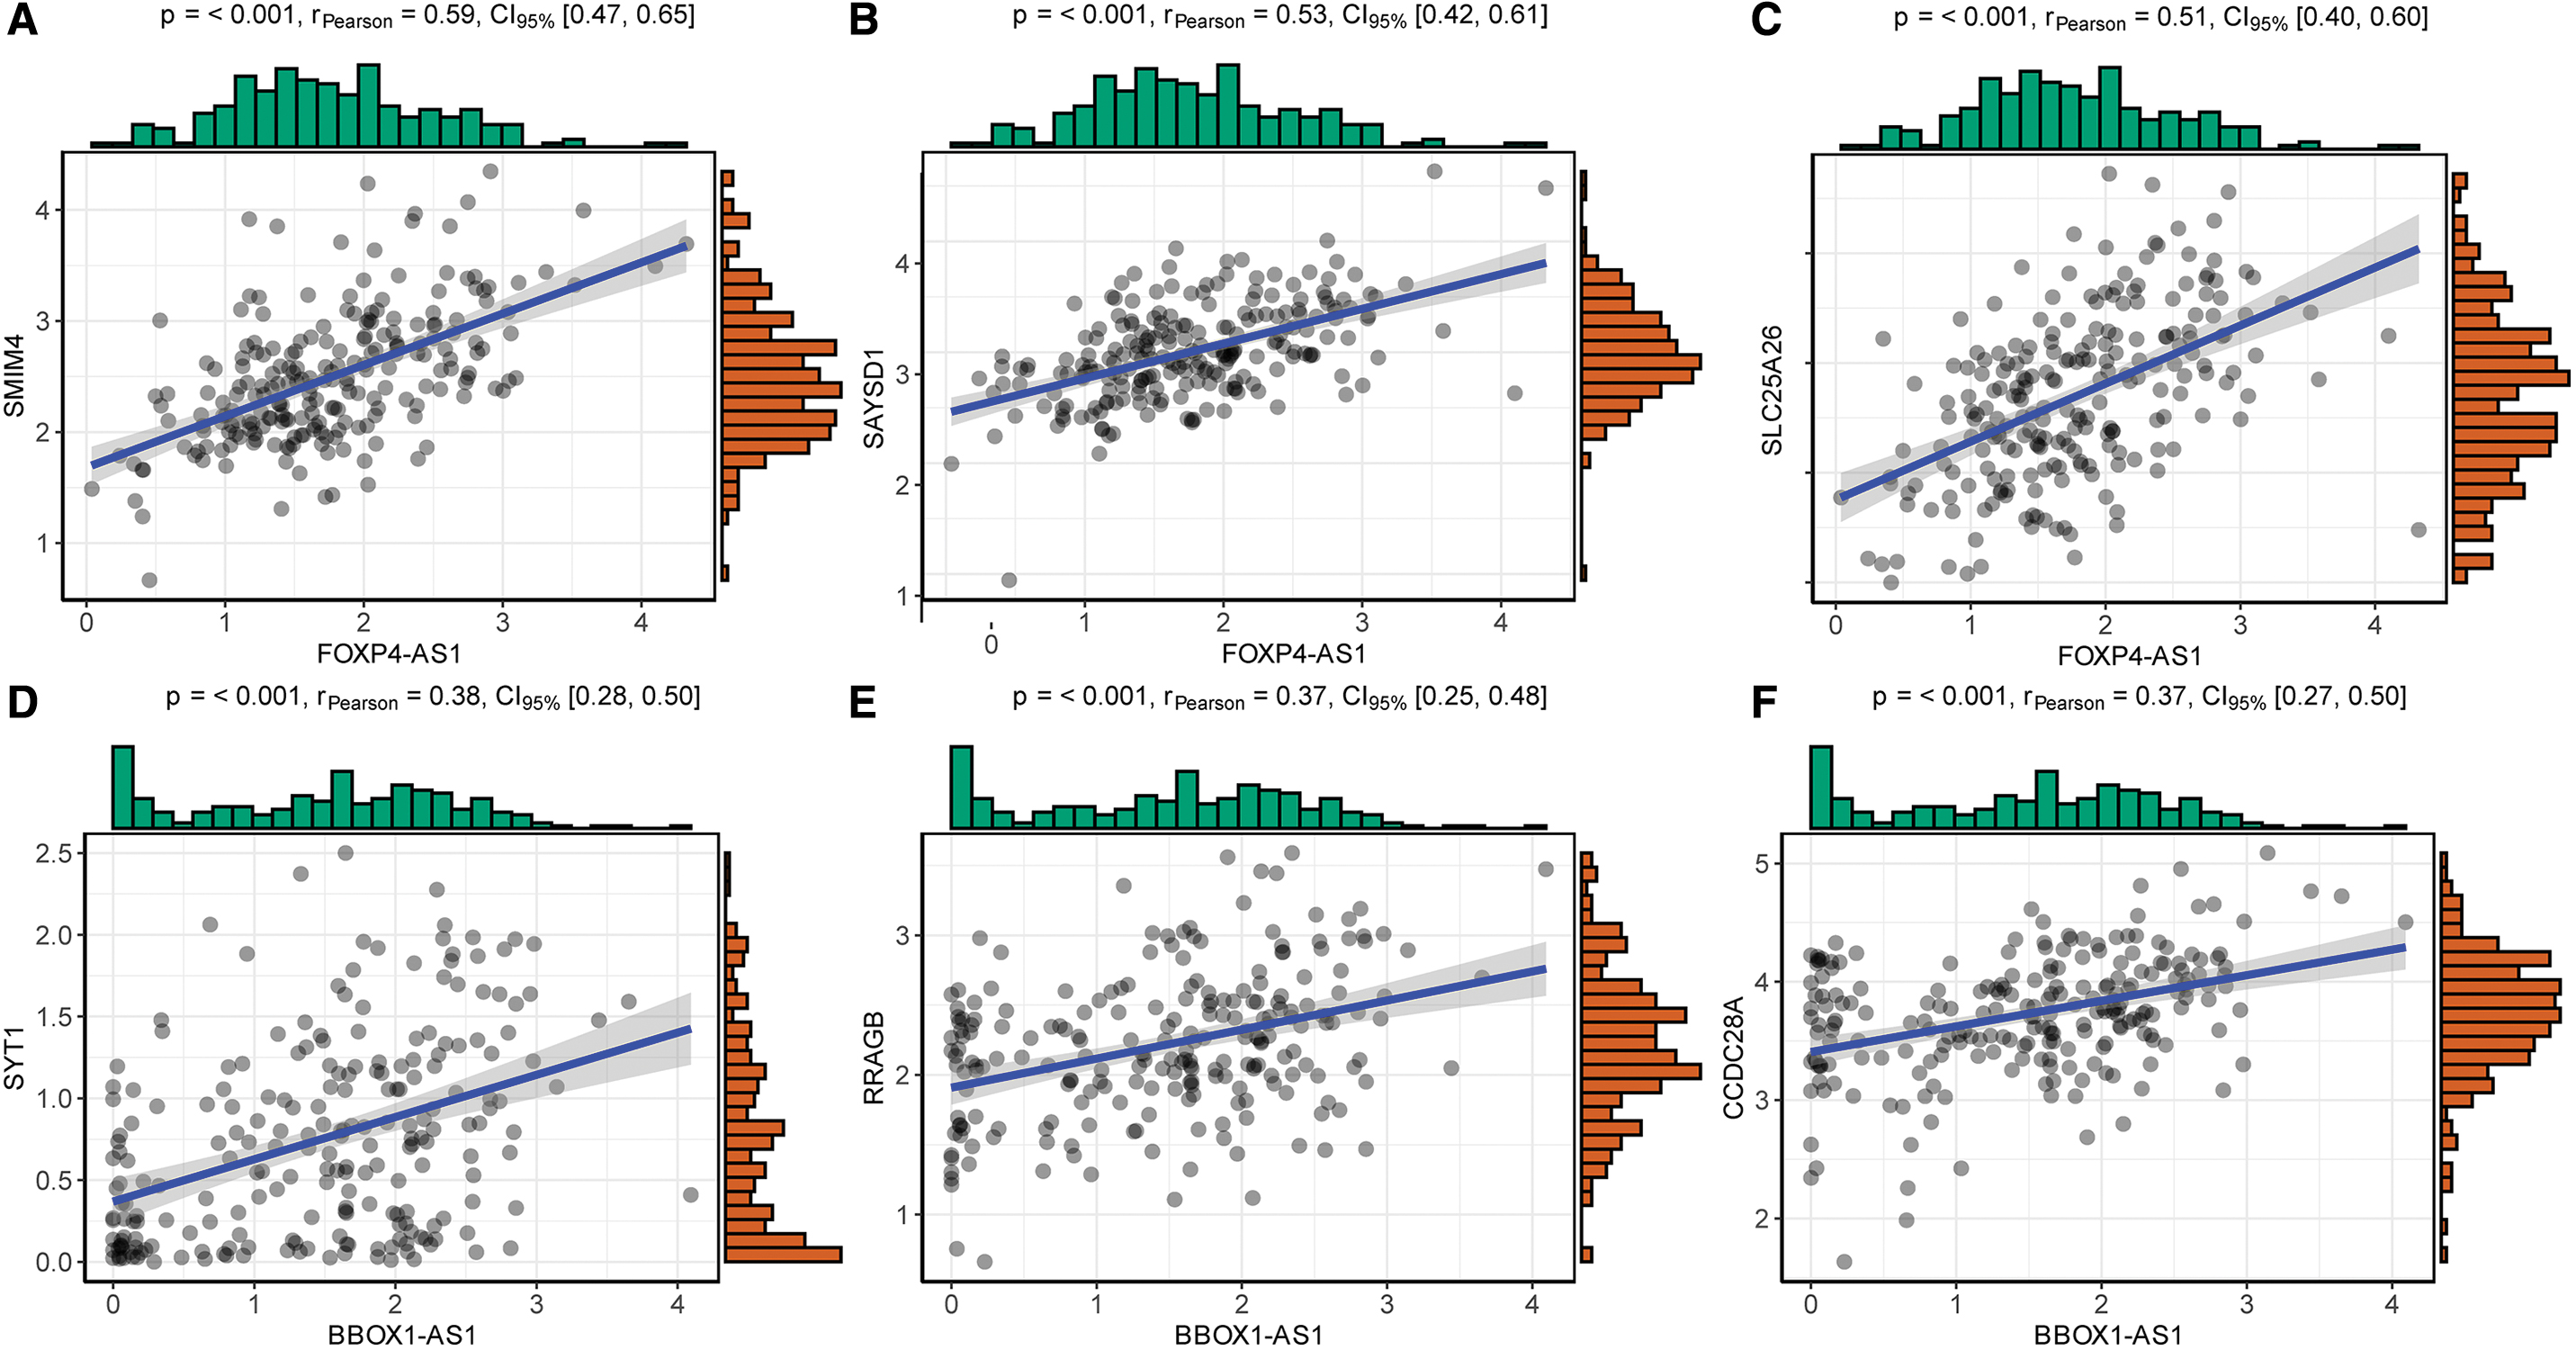
We also analyzed the correlations of the three most positively significant mRNAs of each lncRNA (Fig. 11).
Discussion
LncRNAs are noncoding RNAs with transcript lengths >200 nucleotides, and they have no significant protein-coding potential. 17 The proportion of coding RNA in the human transcriptome is estimated to be <2%, whereas the proportion of noncoding RNA is ∼98%, of which lncRNA, which regulates at least 70% of all gene expression, accounts for >80%. 17,18 LncRNA is widely involved in many important biological functions, such as cell proliferation, cell survival, and apoptosis, mainly by regulating gene expression through epigenetic, transcriptional, and posttranscriptional control. 19 The functions of lncRNAs are mainly to: (1) act as molecular signals to respond to intracellular or extracellular signals and as regulators of specific signaling pathways; (2) act as molecular decoys by binding some RNAs or proteins so that they leave their specific regions and lose their normal functions; (3) act as molecular guides to guide some proteins to specific mRNA or chromosomal sites, thereby affecting gene transcription, mRNA stability, or translation; and (4) act as molecular scaffolds to bind multiple molecules, allowing them to perform their specific functions. Subcellular localization of lncRNA is also closely related to its function. LncRNA in the nucleus may be involved in chromatin regulation, gene transcription, and alternative splicing of transcripts, among other activities, whereas lncRNA in the cytoplasm may be closely related to competitive endogenous RNA (ceRNA) and mRNA stability or mRNA translation. 20 –22 Research has shown that lncRNAs are involved in cancer phenotypes of proliferation, growth suppression, motility, immortality, angiogenesis, and viability. 23 LncRNAs can be used to identify cancers, provide prognostic value for cancers, and inform therapeutic options for cancer patients. 23 –33 Some abnormally expressed lncRNAs in CRC are closely related to cancer progression. LncRNA FTX promotes CRC progression by regulating the miR-192-5p/EIF5A2 axis. 34 LncRNA NBR2 inhibits CRC invasion and migration by downregulating miRNA-21, 35 whereas lncRNA ST8SIA6-AS1 promotes CRC cell proliferation, migration, and invasion. 36 Some lncRNAs, such as lncRNA HOTAIR, lncRNA PVT1, circulating lncRNA DANCER, and others, can act as prognostic factors in CRC. 25,37,38 Although there have been many studies on the associations between lncRNAs and CRC, the roles and mechanisms of lncRNAs in CRC and their clinical applications still need extensive exploration.
Recently, studies have reported different genetic models for predicting human cancer. 39 –43 A weighted prognosis signature of six lncRNAs, including LINC01583, LINC00276, LUNAR1, DKFZp434J0226, SFTA1P, and OGFOD3, was constructed for predicting CRC prognosis. However, the samples were only acquired from GSE datasets, and the number of samples was <100, which may not provide enough accuracy. In our research, we screened out 11 crossed DELs from the GSE20916 and TCGA datasets. To explore the relationships between the expression of individual DELs and clinical prognosis, we first included one factor in the regression model to fit the univariate Cox analysis, and two key lncRNAs related to CRC prognosis were further identified to incorporate into the multivariate Cox analysis. Through the multivariate Cox analysis of the two lncRNAs in the training dataset, we constructed a risk score model that could help to separate patients into high- and low-risk groups. We found that the AUC of the ROC curve was 0.724 in the training set, which was higher than that in a previous study (AUC = 0.683). 43 In the test validation set and total TCGA dataset, the AUCs of the ROC curves were 0.723 and 0.702, respectively. They were all >0.70, demonstrating that our model had better predictive power than that of the previous study.
Moreover, we analyzed the predictive relationships between the clinical features and risk score and found that the p-value of the predictive significance of the risk score was minimal, further demonstrating the high predictive power of the prognostic model. The TNM staging system is used to predict CRC prognosis. Nomograms have been found to be more accurate than the TNM staging system. 44 In 2000, Massacesi et al. 45 reported the first nomogram for advanced CRC. Since that study, various models have been constructed to predict prognoses in cancer patients. 46 –48 Nevertheless, there have been few prediction models combining lncRNA information with CRC clinical features. In our study, we identified a prognostic model with two CRC lncRNAs, and we constructed a nomogram and risk classification system. The 3-year nomogram model was comparable with the ideal model, suggesting that we constructed a model with high accuracy. Survival analysis indicated that the risk score model could significantly discriminate prognostic differences between high- and low-risk score groups. Our nomogram could be a clinically valuable prognostic model for CRC patients.
Among the two lncRNAs in the model, lncRNA BBOX1-AS1 promotes the progression of gastric, colorectal, and cervical cancer through the ceRNA pathway. 49 –51 Synaptotagmin-1 (SYT1), which is significantly associated with BBOX1-AS1, can promote colon cancer cell proliferation, migration, and invasion. 52 LncRNA FOXP4-AS1 plays an important role in the progression of some cancers, such as osteosarcoma, prostate cancer, and gastric cancer. 53 –57 Similarly, lncRNA FOXP4-AS1 can be predictive of poor prognoses in CRC patients. 58 One of the three most positively significant mRNAs associated with FOXP4-AS1, that is, SLC25A26, which is downregulated owing to gene promoter hypermethylation, can promote cancer cell survival and proliferation. 59 However, the potential mechanisms of these two lncRNAs in CRC require further exploration. An advantage of our study is the use of many methods and tools along with systematic bioinformatics methods to process a large amount of data. Nevertheless, there were some shortcomings. First, there were differences in the sample sizes of the GEO and TCGA datasets. In addition, the prognostic model only incorporated lncRNA expression and did not consider the prognostic impact of other gene changes, such as micro RNA (miRNA) and mRNA expression. In the future, we expect to collect new samples and follow-up data. Moreover, we expect to further explore the mechanism at the molecular biological level while considering more factors that may affect prognosis to construct a more robust and reliable prognostic prediction model, which should be compared with traditional classical prognostic models for clinical application.
In conclusion, we constructed a two-lncRNA model, including lncRNA FOXP4-AS1 and lncRNA BBOX1-AS1, for predicting CRC prognosis. The two-lncRNA model could accurately predict CRC prognosis. In addition, these two lncRNAs could be involved in several pathways associated with CRC progression.
Data Availability Statement
The datasets analyzed during this study are available from the corresponding author upon reasonable request.
Footnotes
Disclosure Statement
No competing financial interests exist.
Funding Information
This work was supported by grants from the Suzhou Science and Technology Development Plan (SYS2019007, SYSD2019023) and Changshu City Science and Technology Development Plan (CS201910).