
Abstract
Introduction:
The availability of recreational cannabis in the United States has increased dramatically. Neighborhood cannabis dispensary availability may increase problematic use. State and local studies suggest that cannabis dispensary availability may be correlated with neighborhood sociodemographic characteristics. We provide a national-level examination of census tract (CT) sociodemographic characteristic correlates with the availability of cannabis dispensaries in 18 U.S. states that have legalized adult recreational cannabis use.
Methods:
We downloaded the locations of cannabis dispensaries (N = 3,167) from Weedmaps in November 2021. We downloaded ethnic, racial, and socioeconomic estimates from the U.S. Census and categorized CTs into quintiles (Q), where Q1 represents the CTs with the lowest percentage of a variable and Q5 represents CTs with the highest. We fit unadjusted generalized linear mixed models to examine associations between quintiles of each sociodemographic characteristic and the presence of at least one dispensary (vs. none).
Results:
CTs with a greater percentage of Black residents had a higher odds of having at least one cannabis dispensary (vs. none) across all quintiles. For example, compared to CTs with the lowest percentage of Black residents (Q1), CTs with the greatest percentage of Black residents (Q5) had 2.07 (95% CI: 1.70–2.52) times the odds of having at least one dispensary versus none. We observed a similar pattern of a greater likelihood of a CT having a dispensary (vs. none) as the percentage of Hispanic/Latine residents and percentage of individuals living below the federal poverty line increased across all quintiles. In contrast, as the percentage of homeowner-occupied housing increased across all quintiles, there were lower odds of having at least one dispensary (vs. none). For example, CTs with the highest percentage of homeowner-occupied housing (vs. lowest) had 0.21 (95% CI: 0.17–0.26) times the odds of having at least one dispensary vs. none.
Discussion/Conclusions:
Differences in cannabis dispensary availability exist by neighborhood sociodemographic composition. The growing acceptance of cannabis, concern about public health and safety, and the proliferation of adult recreational use laws offer local and state policymakers an opportunity to engage local communities in shared decision-making about the location of dispensaries.
Introduction
The availability of cannabis for nonmedical purposes in the United States (U.S.) has increased dramatically in the last 10 years, raising concerns about the public health implications of this expansion. Since Washington state and Colorado first legalized recreational cannabis in 2012, 22 other states have promulgated policies that allow adult use without a medical prescription. 1 In the U.S., the increased availability of cannabis that followed legalization resulted in an increase in adult cannabis use, 2 so much so that by 2022 the number of individuals reporting daily cannabis use surpassed daily alcohol use for the first time. 3 U.S. states that legalized adult recreational use saw a greater increase in rates of cannabis use and cannabinoid use disorder (CUD) in adults as well as increases in the cases of adolescent CUD than states that prohibit adult recreational use. 4 Evidence from a systematic review of 65 studies suggests that passage of adult recreational use laws results in more frequent adult use, increased cannabis-related health care visits, and increased incidence of impaired driving. 5 A recent study in Northern California found that the passage of recreational cannabis policies resulted in significantly greater acceptance and use of cannabis 6 and anecdotal evidence suggests that many of the public health consequences of cannabis are underreported and often unrecognized by health care professionals. 7
There are also sociodemographic differences in cannabis use behaviors. A higher frequency of cannabis use is associated with having less than a high school diploma, being 18–34 years of age and identifying as Black, while less frequent use is associated with being married, and identifying as Asian or Hispanic. 8 A review of findings from nationwide studies in the United States suggests that cannabis use and CUD have increased overall, with significantly greater increases among men, young adults, individuals who identify as Black or African American, individuals facing economic hardship, those who have never been married, and urban residents. 2 The dramatic rate of changes in cannabis dispensary availability and concomitant impacts on the well-being of communities suggest a need for increased understanding of potential inequities observed in the cannabis landscape to inform policy formulation. 9 One indicator of the changes occurring in the cannabis landscape is increasing use and CUD associated with greater dispensary availability.
Dispensary availability may pose risks for certain populations. In California, individuals living in zip codes with higher dispensary availability per square mile were more likely to experience overnight hospitalization for CUD. 10 Following legalization of recreational use, shorter driving distance to the nearest dispensary and increased cannabis retailer availability within 15 min of home were associated with higher odds of use among a sample of pregnant women in California. 11 And, in Washington state, increased recreational cannabis retail access was associated with increased cannabis use. 12 Additionally, the frequency of child abuse was positively associated with the availability of brick-and-mortar cannabis dispensaries and cannabis delivery. 13 A systematic review of 32 studies found positive associations between dispensary location and increased frequent adolescent use, increased cannabis-related hospitalization, and increased adverse neonatal care outcomes. 14
Given the relationship between dispensary availability and cannabis use and CUD, there is a need for policy approaches to address neighborhood sociodemographic differences in the location of dispensaries in communities. Neighborhoods with higher proportions of Hispanic, Latine, and Black community members were more likely to have cannabis dispensaries than other neighborhoods in California. 15 A study comparing licensed and unlicensed dispensaries in Los Angeles County, California, found that licensed cannabis dispensaries were found more consistently in neighborhoods with a greater proportion of Black communities and Hispanic and Latine residents, while unlicensed cannabis dispensaries were found predominantly in lower-income neighborhoods and those with a higher proportion of Hispanic and Latine residents. 16 A statewide study in Colorado found that recreational dispensaries were more likely to be located in Hispanic/Latine and Black communities as well. 17 Contradictory evidence was found in Denver, Colorado, where no association was found between the socioeconomic and racial/ethnic composition of the community and the location of cannabis dispensaries. 18
There are also differences in availability by neighborhood socioeconomic status. In California, dispensaries tended to be located in census block groups with higher rates of poverty, 15 and in Colorado, similar patterns were observed among census tracts (CTs) across the state. 17 In Portland, Oregon, cannabis dispensaries were more likely to be situated in neighborhoods experiencing deprivation, defined using indicators of poverty, education, housing ownership, family composition (i.e., households with a female head), and English proficiency. 16 And, in Washington state where, areas of increased poverty, heightened housing insecurity, elevated rates of unemployment, and reduced rates of formal education had a greater likelihood of having cannabis dispensaries, processors, and producers than other areas. 17 Longitudinal studies in Los Angeles, California, 19 and Washington state 20 suggest that these inequities may persist or even worsen over time.
Many of the existing examinations of neighborhood cannabis dispensary availability focus on a single, smaller geographic context such as a municipality or a single state. Given the potential public health consequences that accompany cannabis retail as well as the need to better understand the spatial availability of dispensaries in states that have legalized adult recreational use, we aim to characterize the relationships between CT racial, ethnic, and socioeconomic composition and the availability of cannabis retailers in all U.S. states that have legalized adult recreational cannabis sales as of 2021.
Materials and Methods
Neighborhood characteristics
We conceptualize neighborhoods as CTs and prioritize assessing sociodemographic variables assessed in existing regional and state-level studies.15–17,20 We downloaded self-reported census-tract-level data on race and ethnicity (i.e., the percentage of the population that identifies as non-Hispanic Black [Black] and the percentage of the population that identifies as Hispanic or Latino [Hispanic/Latine]) from the U.S. Census 2020 Profile of General Population and Housing Characteristics. To capture neighborhood socioeconomic status, we downloaded data on the percentage of owner-occupied housing from U.S. Census 2020 Housing Characteristics and data on the percentage of people living below the federal poverty line (FPL) from the 2016–2020 American Community Survey. We then created quintiles (Q) of each sociodemographic variable, where Q1 represents the CTs with the lowest percentage of a variable and Q5 represents CTs with the highest percentage.
Recreational cannabis dispensary availability
Weedmaps is a national, public-facing website and mobile application platform that provides customers with information on dispensaries, including their location, products, and hours of operation. 21 Online databases like Weedmaps serve as an important proxy for dispensary availability, particularly for states that do not publicly publish dispensary locations. 22 Where some states might maintain statewide databases of cannabis dispensaries, these datasets are not updated as often as Weedmaps, 23 and methods for collecting and maintaining these datasets vary by geography.
We used Python to scrape dispensary names and addresses from Weedmaps in November 2021. Our analytic sample included 3,167 dispensaries, medical, recreational, and hybrid, in the 18 states that have legalized adult recreational use as of November 1, 2021, including Alaska, Arizona, California, Colorado, Connecticut, Illinois, Maine, Massachusetts, Michigan, Montana, Nevada, New Jersey, New York, Oregon, Rhode Island, Vermont, Virginia, and Washington. All 18 states also allow for medical use, typically differentiated from recreational use by an issued prescription that may allow for reduced prices for cannabis products, the ability to possess larger quantities of cannabis, and the ability to cultivate live plants. 9
We used Esri’s ArcGIS Pro 2.9 to geolocate each of the dispensary addresses and spatially joined their location to 2020 TIGER/Line CT shapefiles. We removed CTs with zero population, resulting in an analytic sample of 35,420 CTs across the 18 states. Initial examination of the distribution of the total census-tract-level count of dispensaries indicated that approximately 94% of tracts did not have a dispensary; therefore, we dichotomized the outcome variable of cannabis dispensary availability to be 1 = CT has 1 or more dispensaries versus 0 = CT does not have a dispensary (Fig. 1).
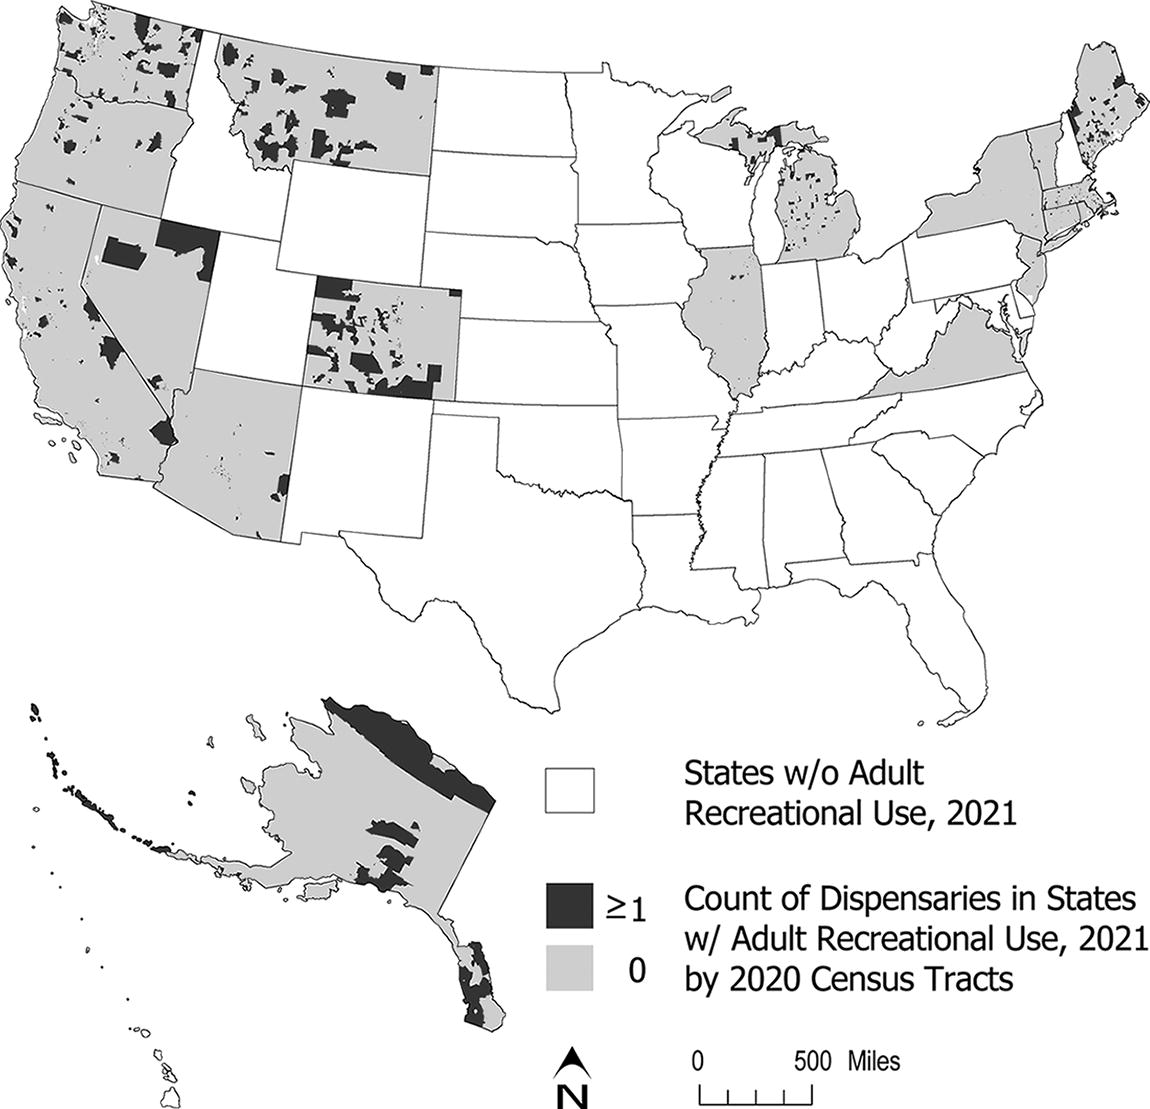
Census tract cannabis dispensary availability in the 18 states that legalized adult recreational use, United States, November 2021. Dispensary location data from Weedmaps.
To account for the nesting of CTs within counties and counties within states, we used SAS 9.4 to fit generalized linear mixed models examining the relationships between each quintile of each sociodemographic variable (as compared to Q1) and the presence of at least one recreational cannabis dispensary (vs. none). Because we have a near census of CTs within states that allow for adult recreational use and polychoric correlations were moderate to high for sociodemographic variables, we did not fit adjusted models.
Results
Descriptive characteristics for CTs included in the sample are shown in Table 1. Approximately 6% of CTs had at least one dispensary, and the average count of dispensaries was 0.10 (standard deviation: 0.49). Supplementary Table S1 describes the mean values of each sociodemographic variable, by CT, by the presence of at least one dispensary versus none for each state.
Census Tract Sociodemographic Characteristics and Dispensary Availability in States That Allow Adult Recreational use, United States, 2021 (N = 35,420)
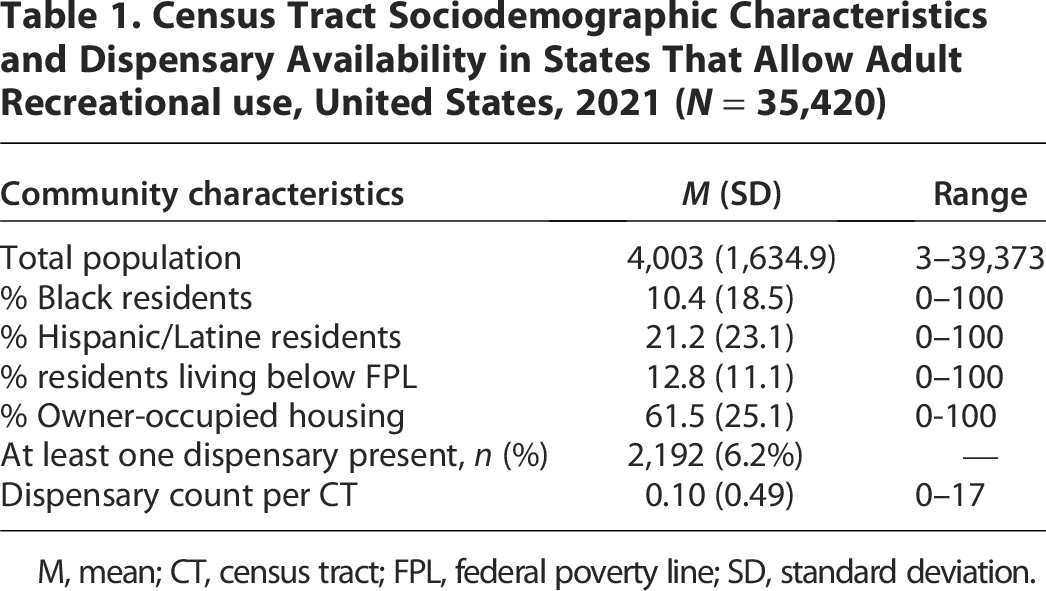
M, mean; CT, census tract; FPL, federal poverty line; SD, standard deviation.
Generalized linear mixed models indicated that CTs with a greater percentage of Black residents had a higher odds of having at least one cannabis dispensary (vs. none) across all quintiles as shown in Table 2. For example, CTs with the highest (vs. lowest) percentage of Black residents had 2.07 (95% CI: 1.07–2.52) times the odds of having one or more dispensaries (vs. none). We observed a similar pattern as the percentage of Hispanic/Latine residents and individuals living below the FPL in each CT increased. For example, CTs in Q2 of the percentage of residents living below the FPL had 1.67 (95% CI: 1.39–2.01) times the odds of having a cannabis dispensary as compared to CTs in Q1. This effect size increased to 3.12 (95% CI: 2.60–3.75) for CTs with the highest (vs. lowest) percentage of individuals living below the FPL. In contrast, as the percentage of homeowner-occupied housing increased across quintiles (Q2–Q5) there were lower odds of having a cannabis dispensary in the CT.
Associations Between Census Tract Sociodemographic Characteristics and the Presence of at Least One Cannabis Dispensary (Versus None), United States, 2021 (N = 35,420)
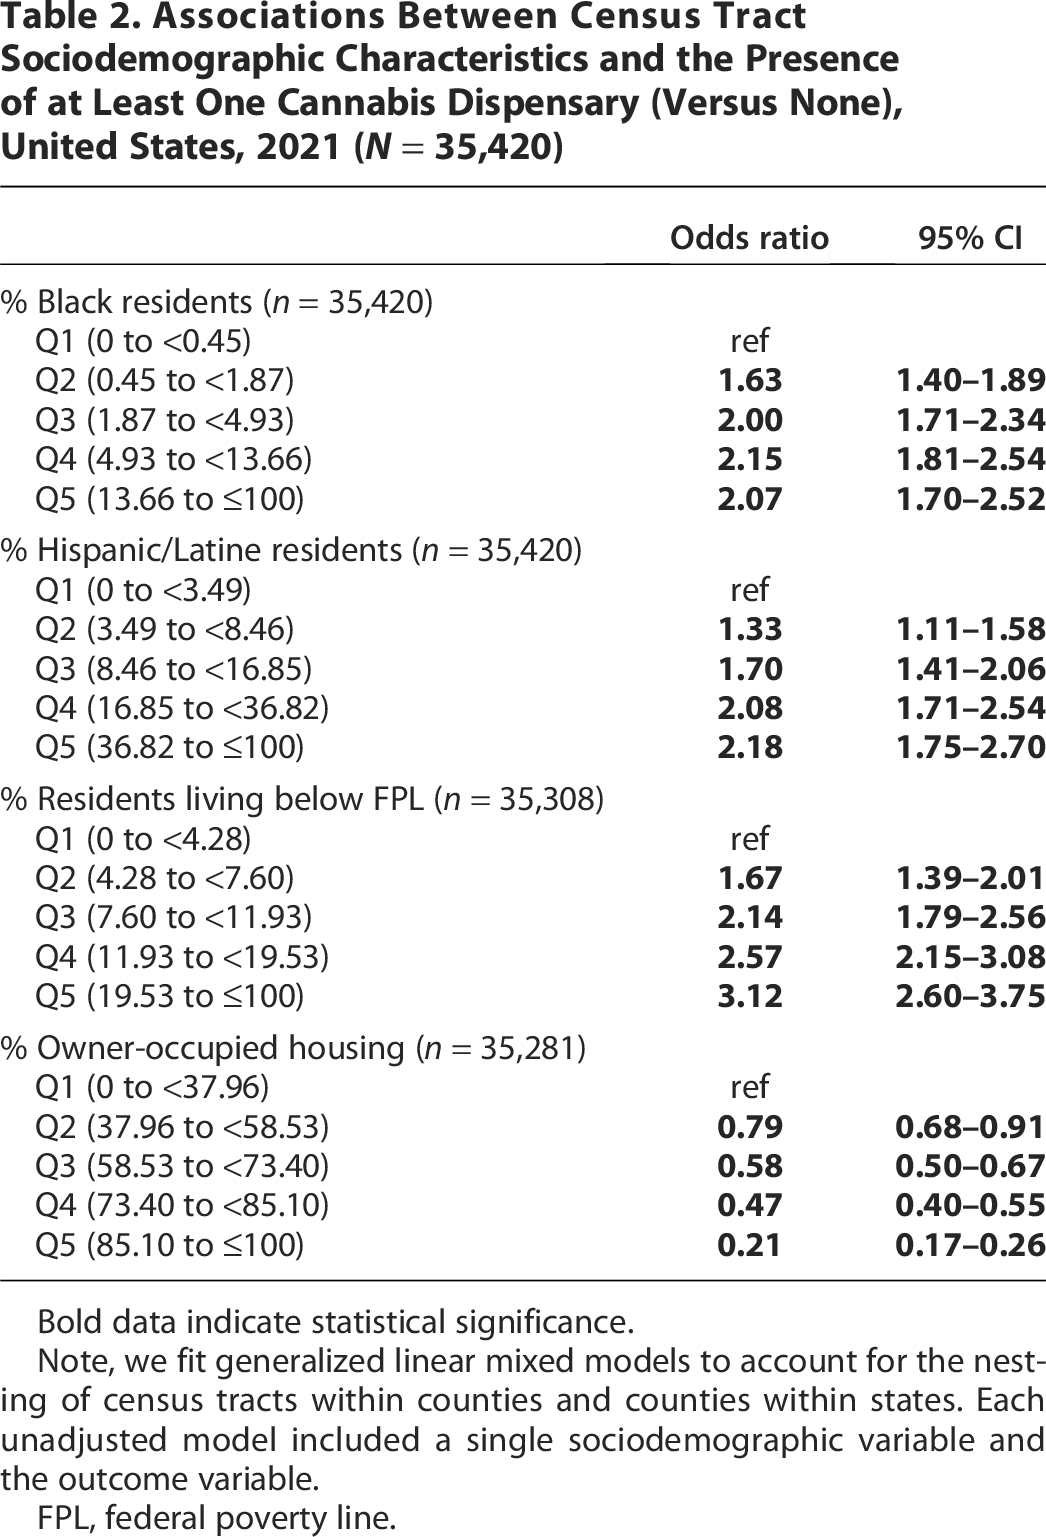
Bold data indicate statistical significance.
Note, we fit generalized linear mixed models to account for the nesting of census tracts within counties and counties within states. Each unadjusted model included a single sociodemographic variable and the outcome variable.
FPL, federal poverty line.
Discussion
Our study demonstrates that dispensary availability is not equally distributed across communities in U.S. states that legalized adult recreational use, suggesting opportunities for policy interventions to promote more equitable spatial distribution. Like others,15,17 we found evidence that CTs with a greater percentage of Black residents had a greater likelihood of having a dispensary as compared to CTs with the lowest percentage of Black residents. Our results also suggest that as the percentage of Hispanic/Latine residents increases in each CT, so too does the likelihood of CT hosting at least one dispensary. This national pattern mirrors the results of studies in California 15 and Colorado 17 which found that dispensaries were more likely to be located in Hispanic/Latine neighborhoods.
We also found that increasing percentages of homeowner-occupied housing units decreased the odds of having a dispensary in a CT. Similar results were found in Portland, Oregon, using a composite indicator of deprivation that included homeownership. 16 Our results also suggest that higher rates of poverty are associated with a higher odds of a CT having at least one cannabis dispensary. Similar results were observed statewide in California 15 and Colorado, 17 but our work is the first to document these spatial patterns at the national level.
These patterns can be cause for concern as previous work has established that neighborhood differences in dispensary availability may also be associated with health outcomes such as CUD among Black and African American residents,2,8 cannabis-related hospitalizations, 10 and heightened rates of use. 8 Neighborhood sociodemographic differences in the availability of recreational cannabis suggest the need for continued investigation into health outcomes at varying spatial scales to better understand how the availability of cannabis influences community economic, social, and physical well-being.
In the face of increasing acceptance and legalization of cannabis use, local authorities are being called upon to promulgate rules, land use policies, and permitting processes that allow for the cultivation, processing, and use of cannabis.24–26 The speedy proliferation of recreational use regulations challenges local governments to manage the economic, social, health, and safety outcomes associated with retail cannabis through land use controls, licensure, and taxation. 27 Data about the impacts of the availability of cannabis for recreational uses are needed to promote evidence-based policy formulation.
This is particularly true given the changing nature of views about cannabis retail availability in communities. While residential proximity to dispensaries is often viewed as a locally undesirable land use because of concerns about its impact on neighborhood quality of life and community well-being, 28 dispensaries are increasingly seen as one approach to reconciling past injustices inflicted upon communities of color due to the criminalization of cannabis. 29 Awareness continues to grow about the potential economic, public health, and equity benefits of cannabis policy to reduce harms enacted on Black communities as part of the American war on drugs.27,30 Stark differences exist between cannabis-related criminalization between White and Black communities, where Black people are almost four times more likely to be arrested for cannabis possession, despite similar cannabis use rates across groups. 31 Public health interventions and public policies are needed that acknowledge existing racial, carceral, economic, and health disparities while also curbing problematic use. 32
Policy efforts aimed at rectifying these inequalities have been implemented. As of 2023, 22 states with laws allowing for adult recreational use also have social equity provisions that provide for resentencing and criminal record relief, community reinvestment, and assistance to help those who have already been harmed by cannabis criminalization to start cannabis-related businesses.9,33 These programs are explicitly intended to foster the economic vitality and livelihood of communities of color; however, evidence suggests their impact is limited 33 and must also be paired with changes to policing and the racist enforcement of cannabis-related rules. 31
Addressing differences in the availability of cannabis dispensaries through public policy must address two competing equity goals: one, to limit the health impacts of CUD, and the other, to address the carceral impacts of cannabis criminalization. Policy options currently exist for states and municipalities to address a potential concentration of cannabis dispensary availability. Dispensary operation is regulated by an interacting set of state and municipal policies that often include licensure, permits, land use regulations, and requirements pertaining to the storage and disposal of cannabis products. 28 Land use policies to regulate cannabis sales often involve prohibiting dispensaries near youth-oriented uses like schools or playgrounds, limiting dispensaries to specific land uses such as commercial or industrial, and licensing or permitting for business operations. 26
There are limitations to the current study. First, our dataset of cannabis dispensary locations was derived from Weedmaps, and we did not discern between dispensary types (medical, recreational, hybrid). Validation studies suggest that Weedmaps identified 80% of open, brick-and-mortar cannabis dispensaries in a study in California 34 and 95% of open dispensaries in Los Angeles County. 35 Weedmaps data has also been employed in studies investigating the availability of cannabis and health outcomes in California 36 and 18 U.S. states where cannabis was medically available via prescription. 37 While this evidence suggests Weedmaps is a reliable tool for gathering dispensary data, it is possible that we did not capture all active cannabis dispensaries. Second, given regional and state-level analyses examining sociodemographic correlates of neighborhood cannabis dispensary availability, the goal of the current paper was to provide a national analysis for all states with legalized, adult recreational use. Our analysis is therefore conducted nationally, and we do not test differences within a state (see Supplementary Table S1 for descriptive sociodemographic differences by state). Finally, our sample only included states with legalized adult recreational use, and our analysis, therefore, may not be generalizable to states that only allow for medically prescribed use.
Conclusion
Overall, we document racial, ethnic, and socioeconomic differences in the availability of cannabis dispensaries in the 18 U.S. states that allowed adult recreational use as of 2021. Ongoing discussion on the design and implementation of policies that balance public health concerns about risky cannabis use alongside evidence that dispensaries may bolster economic vitality and address carceral inequities may promote more equitable cannabis policies. The growing acceptance of cannabis and the proliferation of adult recreational use laws offer an opportunity to engage local communities in shared decision-making about the location and role of dispensaries.
Authors’ Contributions
B.C.L.: Conceptualized the article and led study design, contributed to data collection, contributed to data interpretation, and led article writing and preparation. M.R.E.S.: Conceptualized the article, contributed to the study design, led data collection, and contributed to data interpretation and article preparation. A.Y.K.: Contributed to study design, conducted data analysis, led data interpretation, and contributed to article writing and preparation. All authors provided feedback, edited, and approved submission of the article.
Footnotes
Acknowledgments
The authors would like to acknowledge Christin Lacey and Danika Tei, computer science students at San Diego State University at the time of this research, for their assistance with data collection.
Author Disclosure Statement
A.Y.K.: has served as a paid expert consultant in litigation against the tobacco industry. All other authors declare that they have no competing interests.
Funding Information
The authors did not receive financial support for the research reported in this article.